EraCrisisMeter
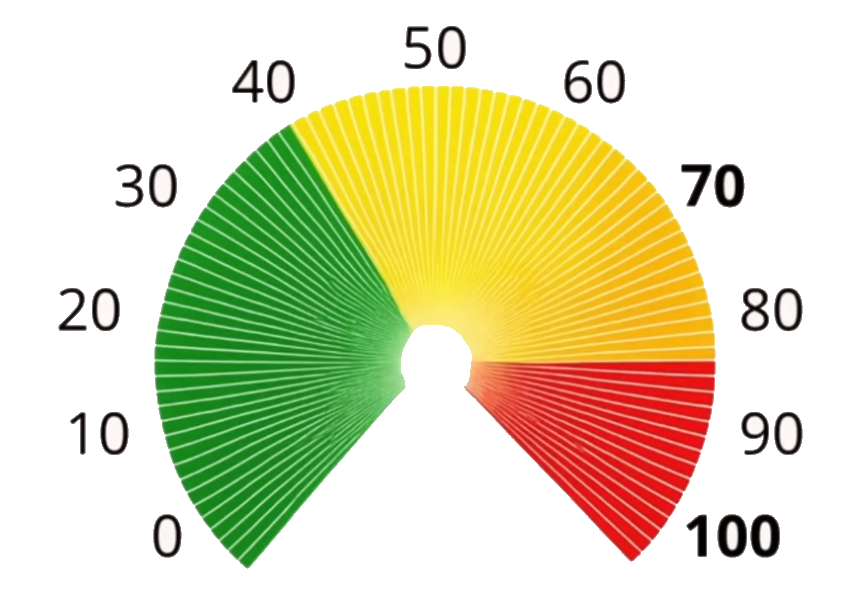
Risk Level of the Analysis System by Era of Change:
64/100
| # | Macro Indicator | Current | Delta vs Prev. |
| 1 | Разница в доходности UST | 0.49 | 0.00 |
| 2 | Индекс доллара США – DXY | 99.93 | 0.27 |
| 3 | Индекс VIX (волатильность S&P 500) | 27.44 | 2.11 |
| 4 | Baltic Dry Index (BDI) | 1882 | -13 |
| 5 | Заявки на пособие по безработице | 210000 | 5000 |
| 6 | PMI — индекс деловой активности | 52.40 | 0 |
| 7 | Ставка ФРС (Federal Funds Rate) | 3.64 | 0 |
| 8 | Денежный агрегат М2 | 22,667.30 | 225.20 |
| 9 | Баланс ФРС (Quantitative Tightening) | 6657161 | 1222 |
| 10 | Резервы в банках (Bank Deposits / Reverse Repo) | 2,799.72 | 0 |
| 11 | Индекс потребительского доверия | 56.40 | 3.50 |
| 12 | Индекс потребительских цен (ИПЦ) | 327.46 | 0.87 |
| 13 | Розничные продажи в США (Retail Sales) | 733537 | -1430 |
| 14 | Индекс деловой активности (PMI) в секторе услуг США | 59.90 | 0 |
| 15 | Безработица | 4.40 | 0.10 |
| 16 | Заказы на товары длительного пользования | 18,203.20 | 171 |
| 17 | Разрешение на строительство в США | 1376 | -72 |
| 18 | SOFR-OIS Spread | 3.63 | 0.01 |
| 19 | High-Yield Bond Spreads (HY Spreads) | 3.19 | -0.08 |
| 20 | St. Louis Fed Financial Stress Index (STLFSI) | -0.85 | 0 |
| 21 | Loan Officer Survey | 5.30 | -1.20 |
| 22 | VVIX (волатильность VIX) | 124.43 | 5.06 |
| 23 | Primary Dealer Positions (позиции первичных дилеров по гособлигациям США) | 108600 | -5031 |
| 24 | China Credit Impulse | -7.10 | 0 |
Note: The service calculates the level of macroeconomic stress in the US economy using 24 key indicators. Each indicator is assigned a weight between 0 and 15 points, depending on its value and contribution to recession risk. The total amount (maximum 100) is a comprehensive assessment of current economic sustainability. The data is collected once a day after publication on official websites and is calculated by artificial intelligence online. The higher the number, the more likely it is that economic problems or growth will slow.