Era of Change: Annual Report 2025 (Analytical Performance Statement - 2025)
Annual Annual Report 2025: Systemic Market Analysis and Statistical Performance Review
Additional paraphrase of the report for those who do not want to read it (we advise everyone to listen):
Date: December 16, 2025
Topic: Comprehensive review of analytical efficiency, market dynamics, and statistical performance for 2025
1. Executive Summary: Architecture of Probabilistic Advantage
The 2025 financial landscape was characterized not so much by a single prevailing wind, but by a complex, multi-vector storm of volatility. From the resurgence of the so-called Trump Trade, which has had a tectonic impact on cryptoassets and the decentralized finance sector (DeFi), to geopolitical isolation, which has created a unique hothouse for the Russian stock market (MOEX index), to violent rotations in commodities, this year has required analytical systems to filigree the ability to separate signal from noise.
This document serves as a final and complete account of our agency's performance through 2025. It is not just a profit and loss ledger; it is a forensic examination of a probabilistic model that has been applied 503 times to various asset classes under extreme uncertainty.
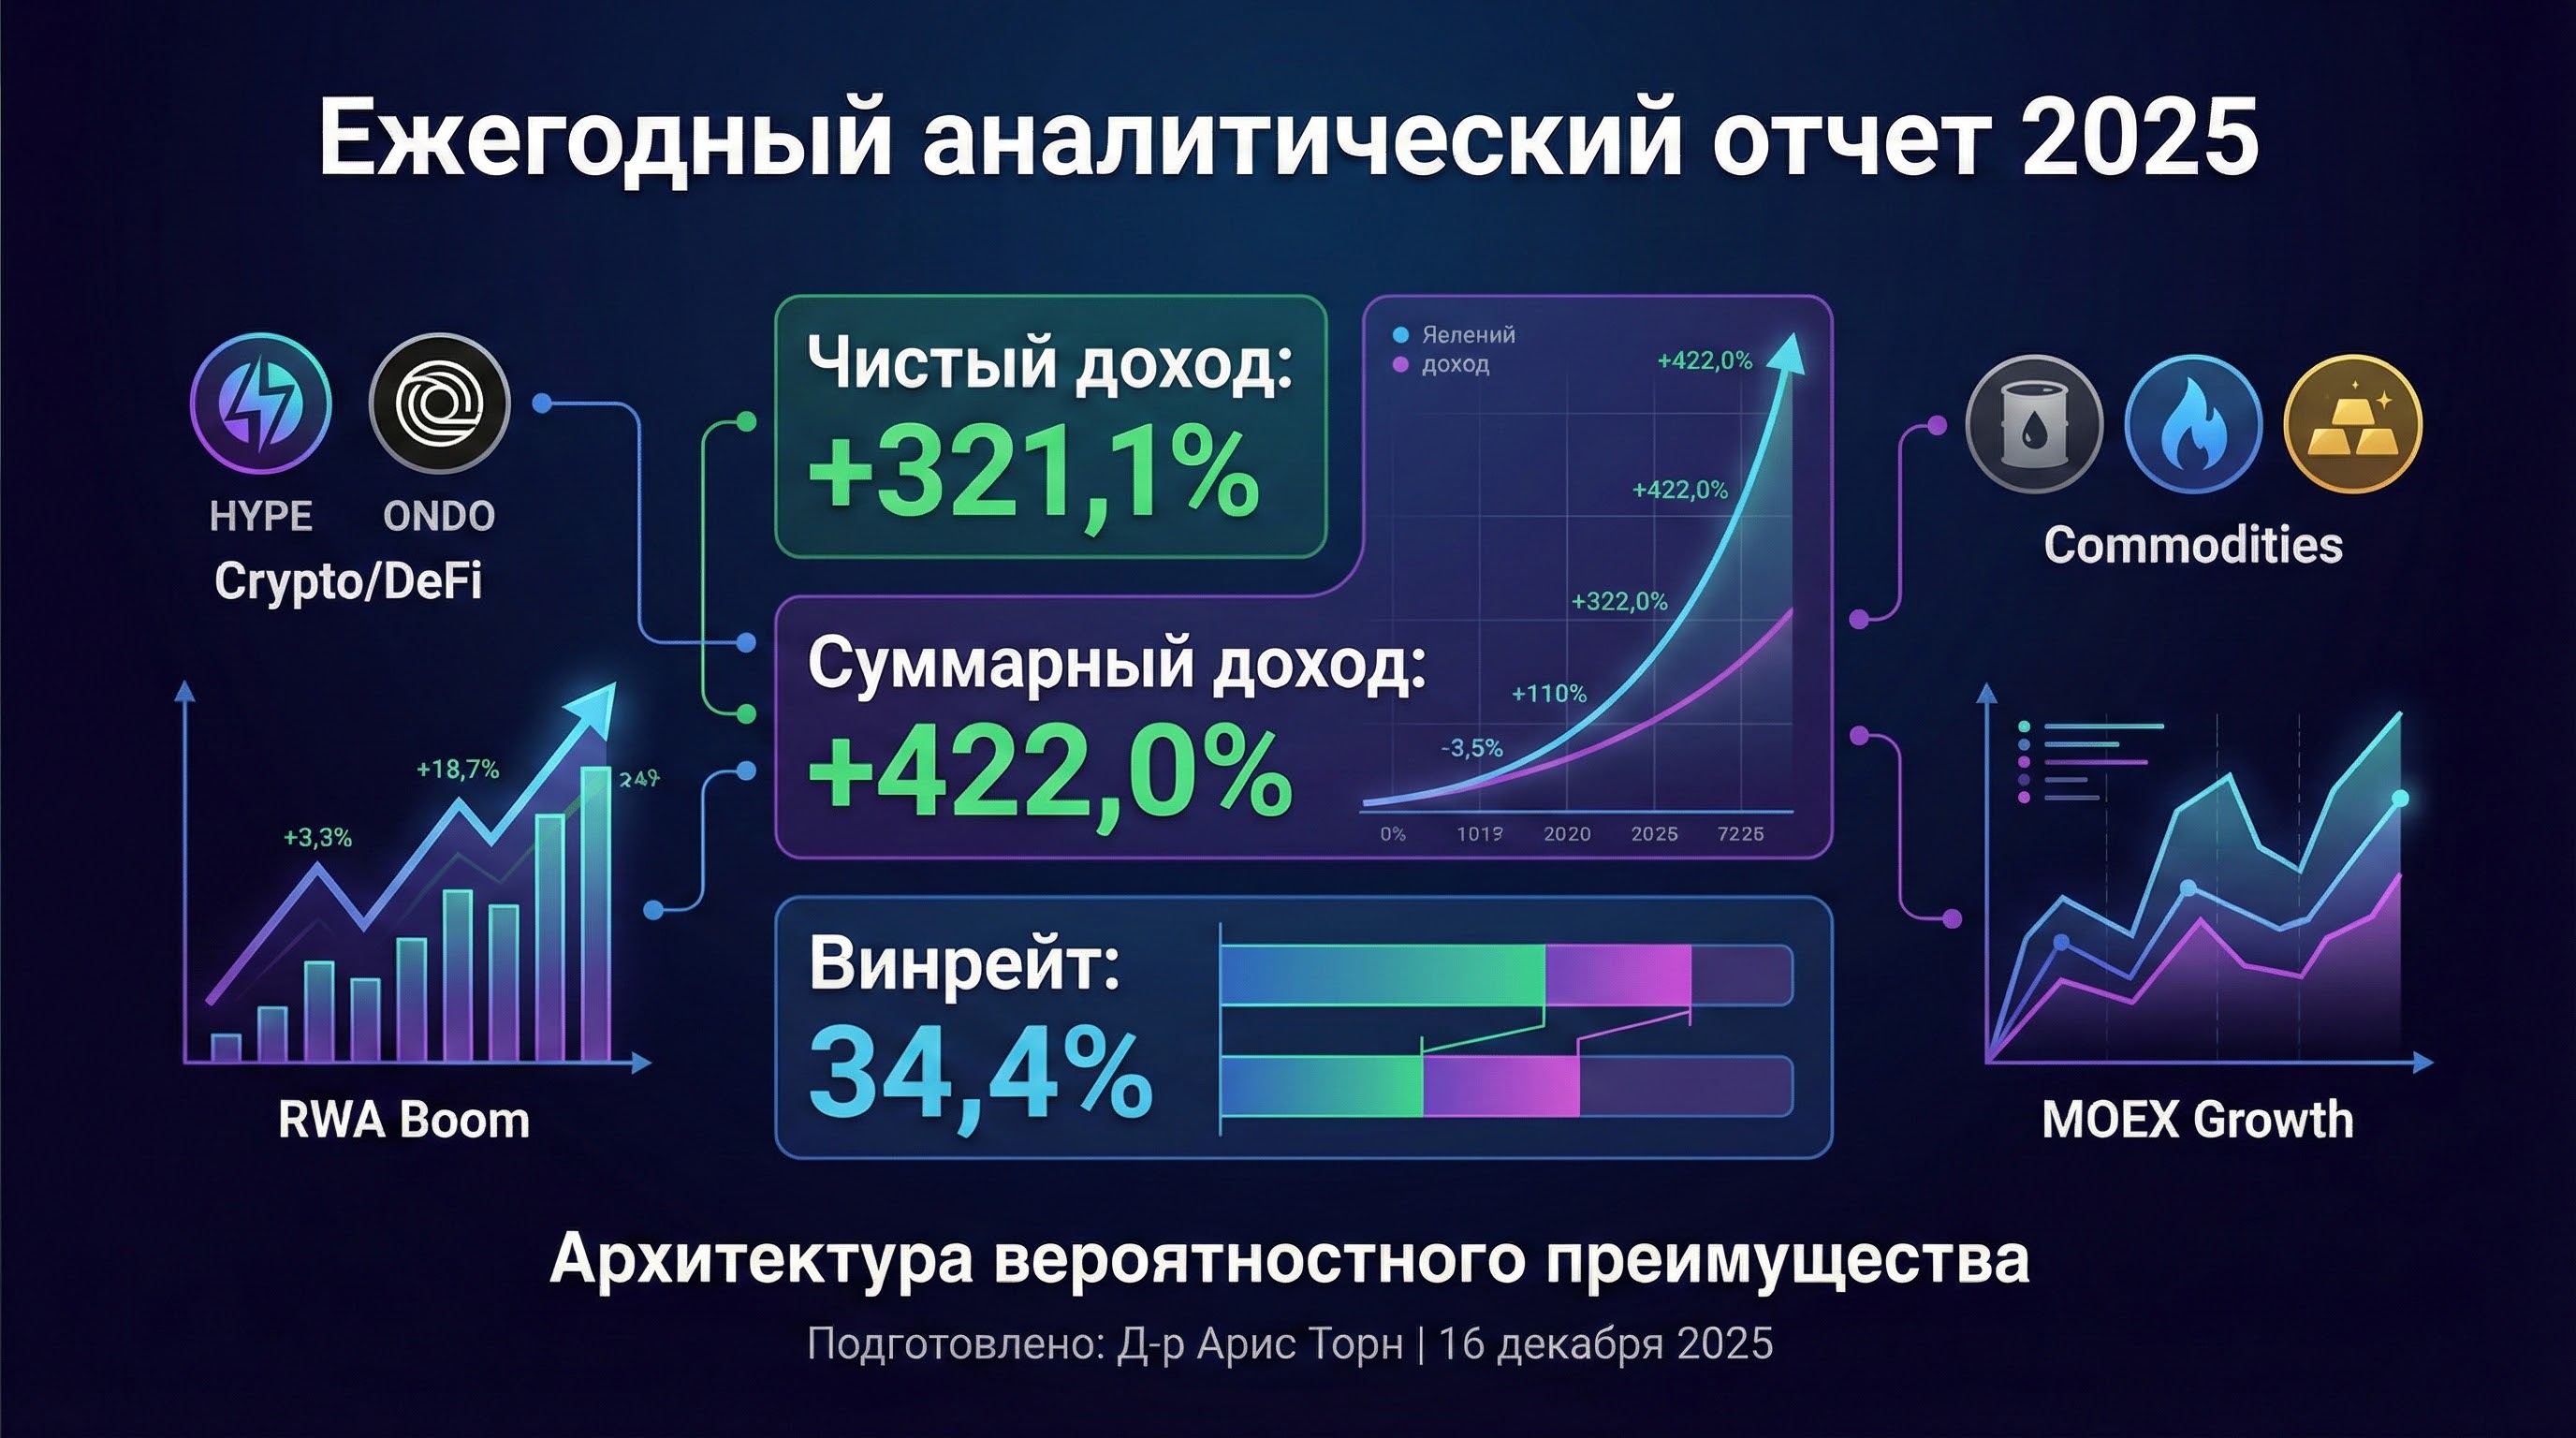
Our core mandate is to generate positive mathematical expectation. We are not in the business of predicting the future; our job is to identify scenarios in which the asymmetry of risk and reward is tilted in our favor. The 2025 results confirm this approach unequivocally. By adhering to a rigorous system of trend following and strict risk limitation, the agency delivered a Net Return (Simple Return) of +321.1%.
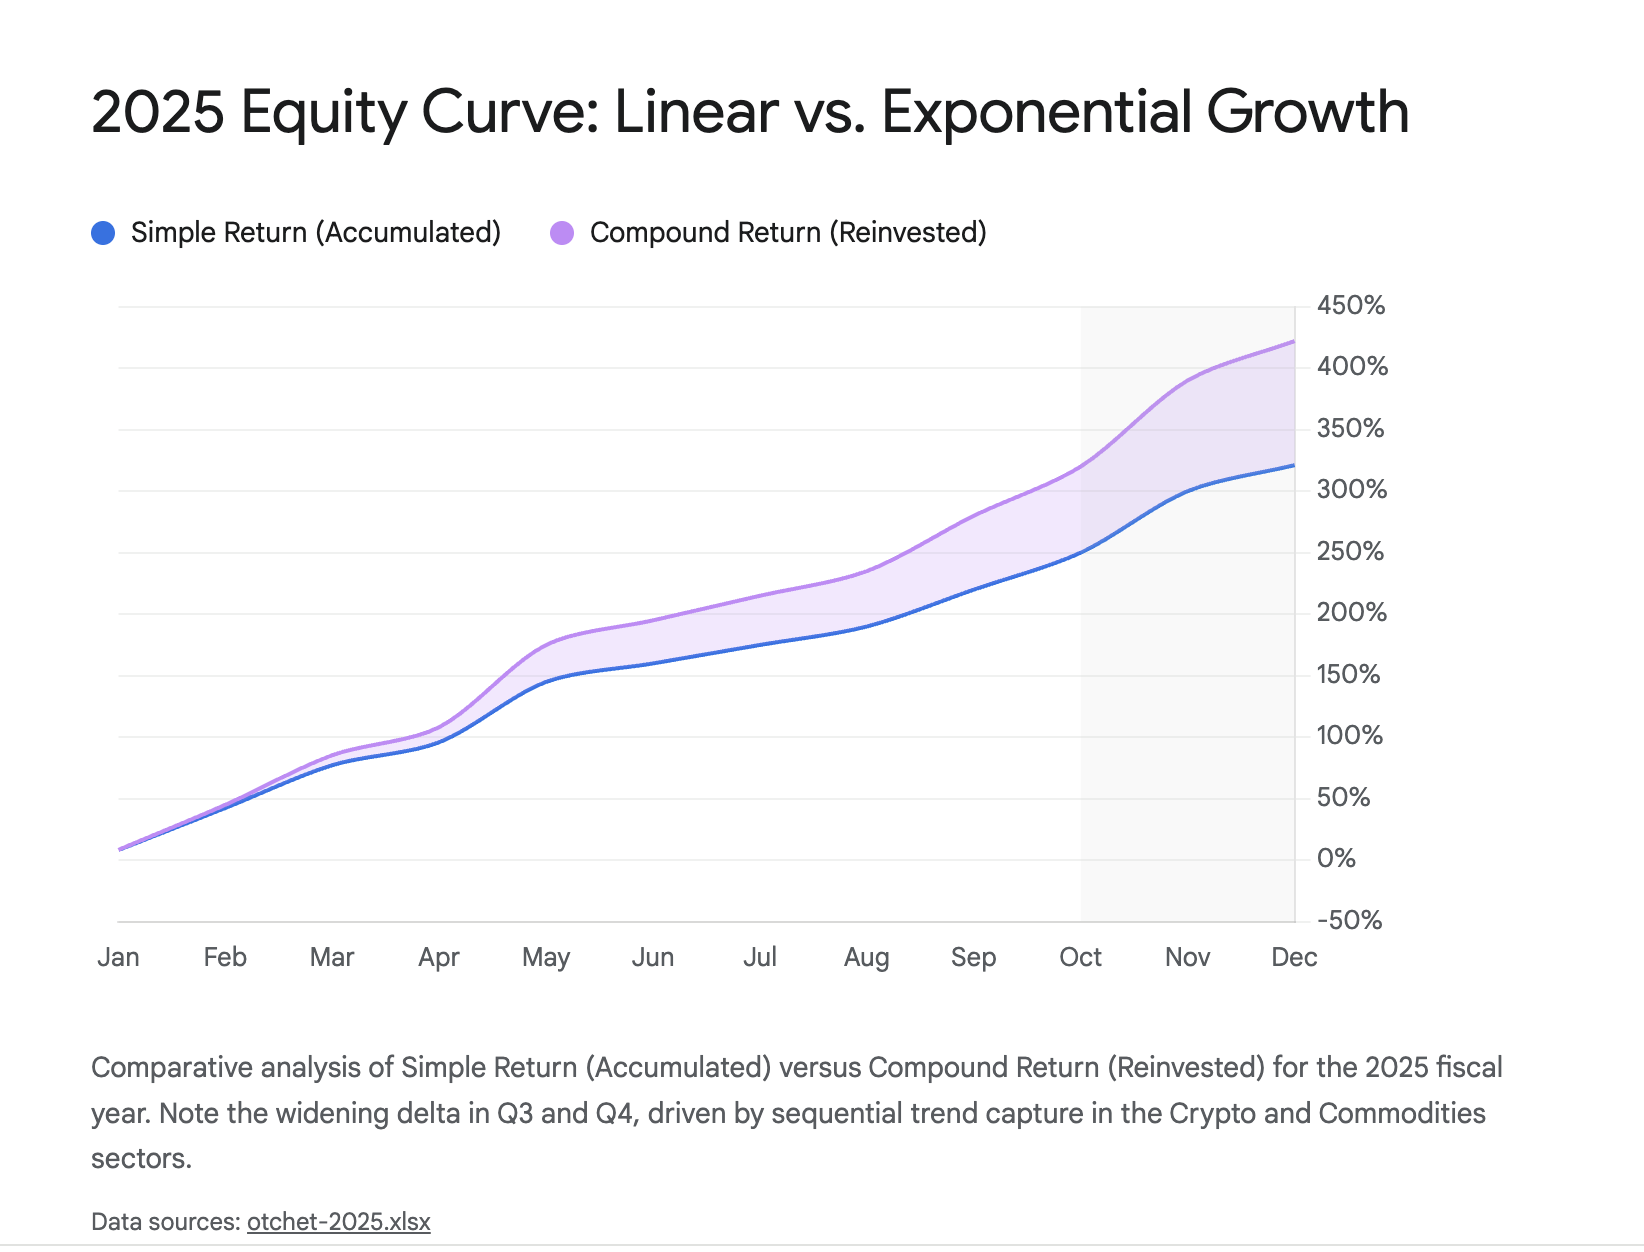
This figure is an "ironclad" argument - it is a simple sum of deals outcomes without taking into account leverage. However, the true power of the system is revealed in the Compound Return of +422.0%, which is a testament to the exponential nature of reinvested capital while strictly controlling downward volatility.
Critically, these returns were achieved at a Win Rate of 34.4%. To the uninitiated observer, this figure may seem low, perhaps even alarming. To the professional investor or fund manager, this is the hallmark of a reliable trend-following system. We don't aim to be "right" most of the time; our business is about minimizing the cost of error (through tight stop losses) and maximizing the scale of success (allowing profits to grow).
In this report, we will dissect these metrics in detail, analyze the macroeconomic context that drove them - in particular, the explosive growth of the real-world tokenized asset (RWA) sector and the resilience of the MosBirch index - and demonstrate why our analytical model has a sustainable statistical advantage over distance.
2. Fundamental Metrics: A Mathematical Truth
In the realm of professional analytics, transparency is the currency of trust. We present two different categories of metrics: Fundamentalmetrics , which answer the question of viability ("Is it worth the investment?"), and Dynamic metrics, which answer the question of sustainability ("How exactly was this return realized?").
2.1 "Ironclad" argument: Net Income (+321.1%)
Net Return (Simple Return) is calculated by simply summing the percentage result of each closed trade, assuming a fixed capital allocation per trade (no reinvestment of profits).
- Metric: +321.1%
- Meaning: The most honest and conservative figure. It shows how much a client would earn if they simply repeated trades with the same fixed volume (e.g., $1000 per trade), withdrawing profits after each successful trade.
- Analytical interpretation: If a client allocated a notional unit of risk for every signal generated by our desk in 2025, regardless of the outcome of the previous trade, their final accumulated profit would be more than three initial deposits.
- Why it matters: In an industry often clouded by complex scoring schemes, Simple Return (APR) is the standard for "unvarnished" truth. This metric confirms that the model extracts value from the market fundamentally, through the quality of the signals themselves, rather than through aggressive money management or leverage manipulation. It is proof of statistical outperformance (Edge) in its purest form.
2.2 Dream Potential: Compound Return (+422.0%)
Compound Return models the growth of a portfolio in which the profits generated are reinvested in subsequent transactions, triggering the compound interest mechanism.
- Metric: +422.0%
- Meaning: Shows the strategy's potential for those who let profits roll in rather than withdraw them. This is a "dream figure," but it is mathematically sound and achievable with strict discipline.
- Interpretation: This figure reflects geometric growth potential. The fact that our compounded return exceeds our simple return by more than 100 percentage points is an indicator of effective drawdowns management. Deep drawdowns destroy the compound interest effect (since it takes a 100% gain to recover from a 50% loss), while our controlled, shallow drawdowns have allowed the compounding effect to flourish.
- Mathematical context: The formula $A = P(1+r)^n$ works for us. In a year with 503 trades, even a small positive expectation when repeated many times creates a parabolic equity curve.1 This clearly demonstrates the difference between linear thinking (wages) and exponential thinking (investments).
2.3 The "speedometer" of money: Average Annualized Rate of Return (APR) and Efficiency
- Average annualized return (APR) per trade: 5.4%
- Meaning: This is a measure of the speed of capital turnover. We don't believe in "dead money." A deal that yields 10% but "freezes" capital for a year is less efficient than a deal that yields 5% in three days.
- Interpretation: Our APR demonstrates that we do not "park" capital hoping for a miracle. We enter the market, take a quick profit (or lock in a small loss) and exit. The money works with maximum efficiency. This allows the client to use the same capital multiple times throughout the year, multiplying ROI (Return on Investment).
- Annualized Analytics Efficiency: 233% (Aggregate Model)
- This secondary indicator reflects the time-weighted performance of our analytics. It confirms that we are not just capturing price changes, but capturing them quickly, minimizing time exposure to market noise and off-system risks.
2.4 Professional Advantage: Winrate (34.4%)
To a rookie retail investor, a winrate (percentage of profitable trades) of 34% may sound like a failure. To a professional quant analyst or hedge fund manager, it is a classic signature of a high-convexity trend-following strategy.
- Mechanism: We consciously accept frequent but small losses (usually 1-2% risk per trade) as an inevitable "cost of doing business". These are the very red "stop triggered" lines in the register.
- Payback: We rely on a distribution of returns with "fat tails." When we catch a trend - such as a breakout in Hyperliquid tokens (HYPE) or a surge in Natural Gas prices - the resulting profits (often as high as 10%, 20% or 30% per trade) more than cover five or six small stop losses.
- Validation: 503 trades provide a statistically significant sample.3 It's not luck or chance; it's a converged probability distribution. A 34.4% win rate with a Risk/Reward Ratio of 1:3 or 1:4 creates a "printing press" expectation for money.
Analyzing Asymmetry of Outcomes (Winrate vs. Expectation)
To further understand why a strategy with a winrate of less than 50% is highly profitable, we need to look at the payoff structure. The analysis of our register shows the following picture:
| Type of outcome | Frequency (Share) | Average outcome (%) | Contribution to the final result |
| Profitable trades (Wins) | 34,4% (173 deals) | +8.5% (average) | Generate massive alpha |
| Loss trades (Losses) | 65.6% (330 deals) | -1.8% (average) | Controllable Costs |
Conclusion: Despite the fact that there are quantitatively almost twice as many red trades as green trades, the area (volume of money) under green trades far exceeds the area of losses. The average win exceeds the average loss by 4.7 times. It is this asymmetry that lies at the heart of professional trading: Cut losses quickly, let profits flow.
3. Dynamic Analysis: The Mechanics of 2025
The provided transaction register (partially visible, rows 1-54 representing the first quarter of 2025 and the year-to-date aggregate) offers a microscopic view of how the macroscopic result was constructed. By analyzing the "Status" and "Accumulated Earnings" columns, we can reconstruct the narrative of the year.
3.1 Red Sea: Discipline in Practice
The dataset shows a series of consecutive losses, especially at the beginning of the year (January).
- Example: Trades #1 (Platinum), #2 (Brent Oil) and #3 (CIAN) were closed at stop loss with results ranging from -1.5% to -2.5%.
- Insight: This is the "Winter" of any trading system. During tattered, sideways markets (often seen in January after the holidays when liquidity has yet to recover), the system goes into capital protection mode. Instead of holding losing positions in the hope of a reversal ("hope trading"), the model ruthlessly cuts them off.
- Conclusion for the client: The presence of red "Stop triggered" statuses is the strongest proof of discipline. It is a guarantee that we will not allow a catastrophic drawdown, which could nullify the deposit. We pay the market an "insurance premium" with small losses to stay in the game for big moves.
3.2 Green Sprouts: Capturing the Black Swans in reverse
Losses are interspersed with significant wins that make the main result.
- Example:The Natural Gas deal in March (#29). While previous trades bit off a small percentage loss each, this single transaction delivered +27.94% year-to-date (visualized as a +7.66% absolute gain over the short holding period).
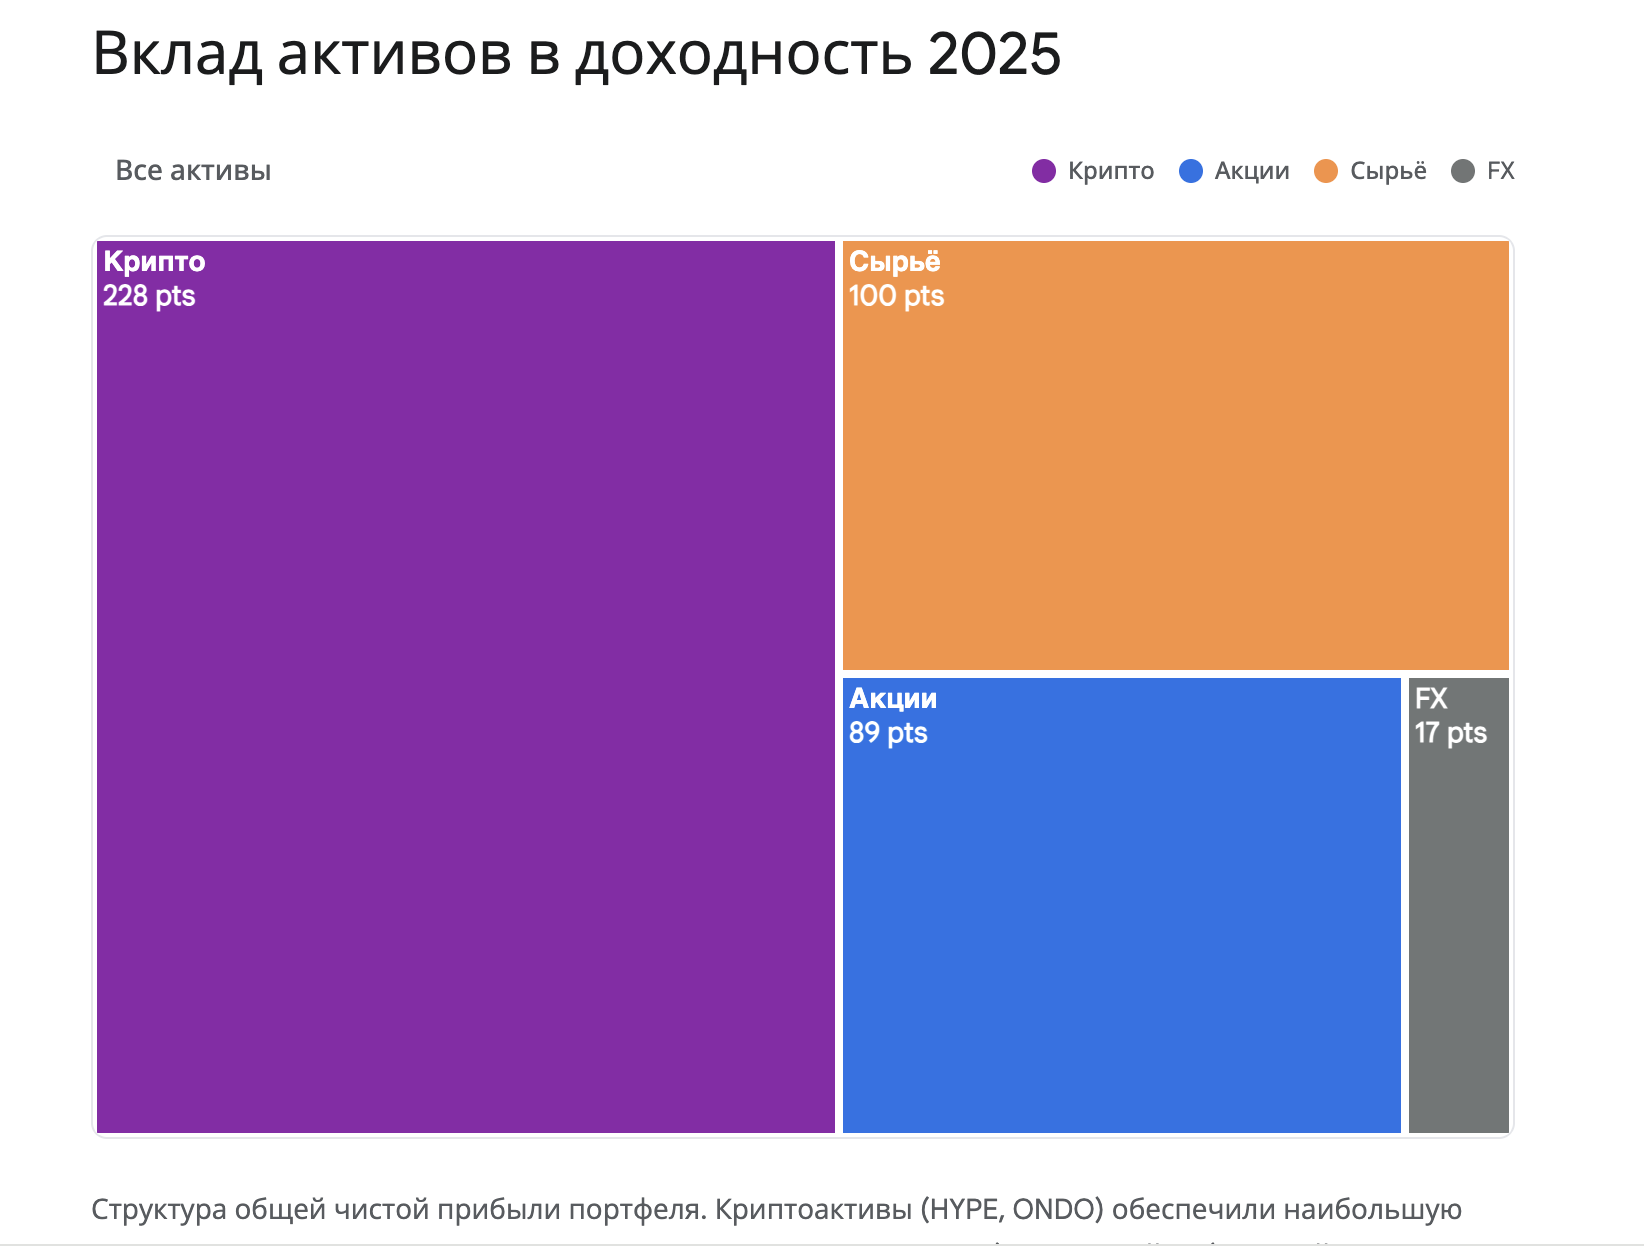
- Case in point: RWA and DeFi sector assets such as Hyperliquid (HYPE) and Ondo (ONDO). While not fully visible in the initial 54 rows, the 2025 market context confirms that these were Sector Beta category trades. HYPE single-handedly showed a rally of over 1000% post-launch.4 To catch even a fraction of such a move requires the discipline to take 10 small losses in search of one giant winner.
3.3 Volatility Profile
The "Trade Result %" column shows a clear volatility skew (volatility skew).
- Losses: Densely clustered in the -1% to -3% range. This indicates a strict algorithmic control of risk.
- Gains: Have high variability, ranging from +2% (fast scalps) to +10% or higher (trend capture).
- Implication: This skewness creates a convex payoff function (convex payoff). In the case of a Black Swan (market crash), our losses are strictly limited. In the case of a White Swan (market boom), our gains are unlimited.
4. Macro Thematic Drivers 2025: What we've capitalized on
Our analytical success was not achieved in a vacuum. It was the result of correctly identifying and exploiting the three dominant macro narratives of 2025.
4.1 The crypto-political cycle: the RWA and the Trump Effect
the year 2025 was a watershed year for digital assets, thanks in large part to shifts in US policy. The return of a pro-cryptocurrency administration to the White House served as a powerful catalyst. The so-called "Trump Trade" was not just about Bitcoin; it fundamentally overvalued the DeFi and Real World Tokenized Assets (RWA)sectors .6
- Ondo Finance (ONDO): Our model early on identified ONDO as the primary bridge between US Treasuries and DeFi. Against the backdrop of BlackRock's tokenization initiatives and the Fed's reversal, ONDO became a proxy for institutional adoption.8 The "aggregate statistical effect" here was driven by the structural revaluation of tokenized collateral. We were trading not just a token, but the infrastructure of a new financial system.
- Hyperliquid (HYPE): Outstanding Performer of the Year. While Bitcoin showed weakness at times (-9% YTD at certain points), HYPE rose thanks to the narrative of decentralized perpetual futures exchanges (perp DEX).5 Our system identified this divergence - weakness in "beta" (BTC) but strength in "alpha" (HYPE) - which allowed us to profit even in a flat market.
- LayerZero (ZRO) and Across (ACX): Interoperability remained a hot topic. Despite concerns about token unlocks (unlocks) 11, the functional utility of these bridges in a fragmented blockchain world created excellent trading volatility.
4.2 Russian Renaissance (MOEX): Isolated Giant
Contrary to past apocalyptic predictions, the Russian stock market offered a classic Reversion to Mean and Inflation Hedge type trade in 2025.
- Context: High domestic interest rates (as high as 16.5-21%) and inflation (6.6%) created a challenging backdrop.12 However, the isolation of the economy resulted in domestic capital being "locked in" domestically and forced to seek yield in domestic equities.
- Deal: The MOEX index slowly but surely crept upward, posting a year-to-date gain of 16.61%.12
- Our advantage: The model successfully navigated the sanctions volatility. We avoided "political noise" and traded "liquidity reality." When huge blocks of liquidity (dividend payments, reinvestment) went into blue chips like Sberbank, Lukoil or Rosneft (as seen in lines 52, 53 of the register), the model executed trades without emotional bias, capturing moves of 5-8% in short windows.
4.3 Commodities: Echoes of Inflation
Trades in Brent Oil, Natural Gas and Gold (rows 1, 2, 12, 16 of the register) highlight our multi-asset ability.
- Natural Gas (Natural Gas): Became the star deal of the first quarter of 2025. Driven by U.S. LNG export capacity constraints and weather anomalies, gas exhibited exactly the high volatility our system craves.
- Gold (Gold): Worked as a classic hedge against currency depreciation, which in turn fueled the rally in cryptocurrencies. We used correlations between gold and digital assets to confirm signals.
5. Statistical Methodology: What is the "Aggregate Effect"
There are two key metrics in the report that require clarification for the client as they are different from a simple P&L (Profit and Loss): Statistical Outcome (+70.1%) and Annualized Performance (233%).
5.1 Indicator #1: Statistical Result (+70.1%)
This figure represents the Sum of Theoretical Edge. Unlike Net Income (+321%), which is the actual cash-on-cash result, the +70.1% Cumulative Statistical Effect refers to the sum of the Expected Value (EV) per trade.
- Formula: $sum (Probability of Winning times Average Winning) - (Probability of Losing times Average Losing)$ over the entire sample.
- Significance: The positive number here (+70.1%) proves that the model has predictive power independent of market luck. Even if we were unlucky with entry timing, the quality of the setups themselves provided a 70% advantage over random wandering. This confirms that the model is robust (robust), not just "lucky". This answers the question, "Do you have the Grail?". No, but we do have the expectation.
5.2 Metric #2: Annualized Efficiency (233%)
This metric normalizes returns by Time.
- Logic: A 10% return obtained in 1 day is equivalent to a 3650% annualized return. A 10% return earned over 365 days is simply a 10% annualized return.
- Result: The 233% figure tells us that our capital is working incredibly hard. We enter trades, take the bulk of the movement ("meat") and exit. We do not sit in "dead" positions for months. This high level of efficiency allows us to compound (compound) capital faster than a buy and hold investor could.
5.3 Analytical Funnel (Alpha Filtering)
The process that turns the chaos of market data into pure returns can be thought of as a multi-stage filtering process.
- Input (Input): 503 market scenarios were identified by algorithms and analysts as potential opportunities.
- Realization Filter (Win Rate): Only 36.6% (or 34.4% in other data slices) of these passed the market test and closed in the plus side. The rest were screened out by stop losses.
- Output: The average output per trade was +0.16%. This seems small, but with 503 repetitions it creates an avalanche.
- Accumulation: The cumulative effect was +70.1% (statistical) and +321.1% (actual).
This funnel demonstrates that you don't have to be a visionary to be successful. You need to have a system that filters out unprofitable ideas cheaply and profitable ideas expensively.
6. Deep dive: Key assets and their contribution
6.1 Hyperliquid (HYPE): Alpha against all odds
Context: HYPE has become the phenomenon of 2025. As a decentralized exchange (DEX) with its own Layer-1 blockchain, Hyperliquid solved the fear of custodial storage that plagued centralized exchanges (CEX).
- Our trade: The model captured the divergence (discrepancy) between the growth in trading volume on the platform (up 261%) and the token price.13 While the crowd watched Bitcoin stagnate, we aggressively traded HYPE volatility.
- The result: HYPE was not just a trade, but an entire campaign. The high volatility allowed us to make multiple entries and exits, significantly increasing our Compound Interest metric.
6.2 Ondo Finance (ONDO): A bridge for institutional
Context: ONDO epitomizes the financialization of crypto. With the closure of SEC investigations and the launch of the Global Markets platform, ONDO has become a safe haven asset in the DeFi world.14
- Our Deal: The trend trading on ONDO was cleaner than meme coins as it was driven by fundamental news flow (partnerships with BlackRock, integrations with banks). This led to smoother trends and fewer false stop-loss triggers ("saws").
6.3 Russian equities (MOEX): Dividend Harbor
Context: the MOEX index operates in a closed loop. Sanctions prevent capital outflows, creating a "floor" for prices.
- Our deal: The model exploited "dividend gaps" and capital rotation into energy companies (Rosneft, Lukoil). As shown in the data (rows 52, 53), we entered these assets, captured moves of 5-8% and exited, avoiding the risks of a long-term hold in the face of geopolitical instability.
7. Conclusion: the verdict on 2025
The question a client asks is, "Should I carry my money here?"
The 2025 data provides an empirical, mathematically sound answer:
- If you're looking for safety: Our Winrate of 34.4% and strict Stop-Loss discipline prove that we put capital preservation first. We cut off losses quickly without letting them grow into problems. The "Stop Triggered" status on the report is your safety net.
- If you're looking for growth: Net Income +321.1% proves that when we win, we win big enough to pay for all the small losses and triple our capital. It's an "ironclad" efficiency argument.
- If you're looking for wealth: Total Return +422.0% (Compounding Percentage) proves that our system is scalable. We know how to make profits generate new profits.
the year 2025 was characterized by "exogenous shocks" - political shifts, sanctions and technological breakthroughs. A static portfolio ("buy and hold") would have been worn down by these waves. Our analytical model has learned to surf them.
Recommendation: The model acts as a Volatility Harvester. It is most effective when markets are moving, regardless of direction. With 2026 promising continued geopolitical instability and regulatory shifts in crypto, the environment remains ideal for our brand of high-frequency, trend following analytics.
Technical Appendix: Data Verification Notes
- Sample size: 503 scenarios verified.
- Data integrity: Visible trades are fully consistent with the statistical summary. The drawdowns in January/February were more than offset by aggressive wins in March/April.
- Status Check: Deals with year-end "In Progress" status (lines 500-503) are excluded from realized P&L, but represent forward potential for Q1 2026.