Report of investment-analytical agency "Era of Changes" for 4 months of 2026 on executed forecasts (statement)
📅 01.05.2026
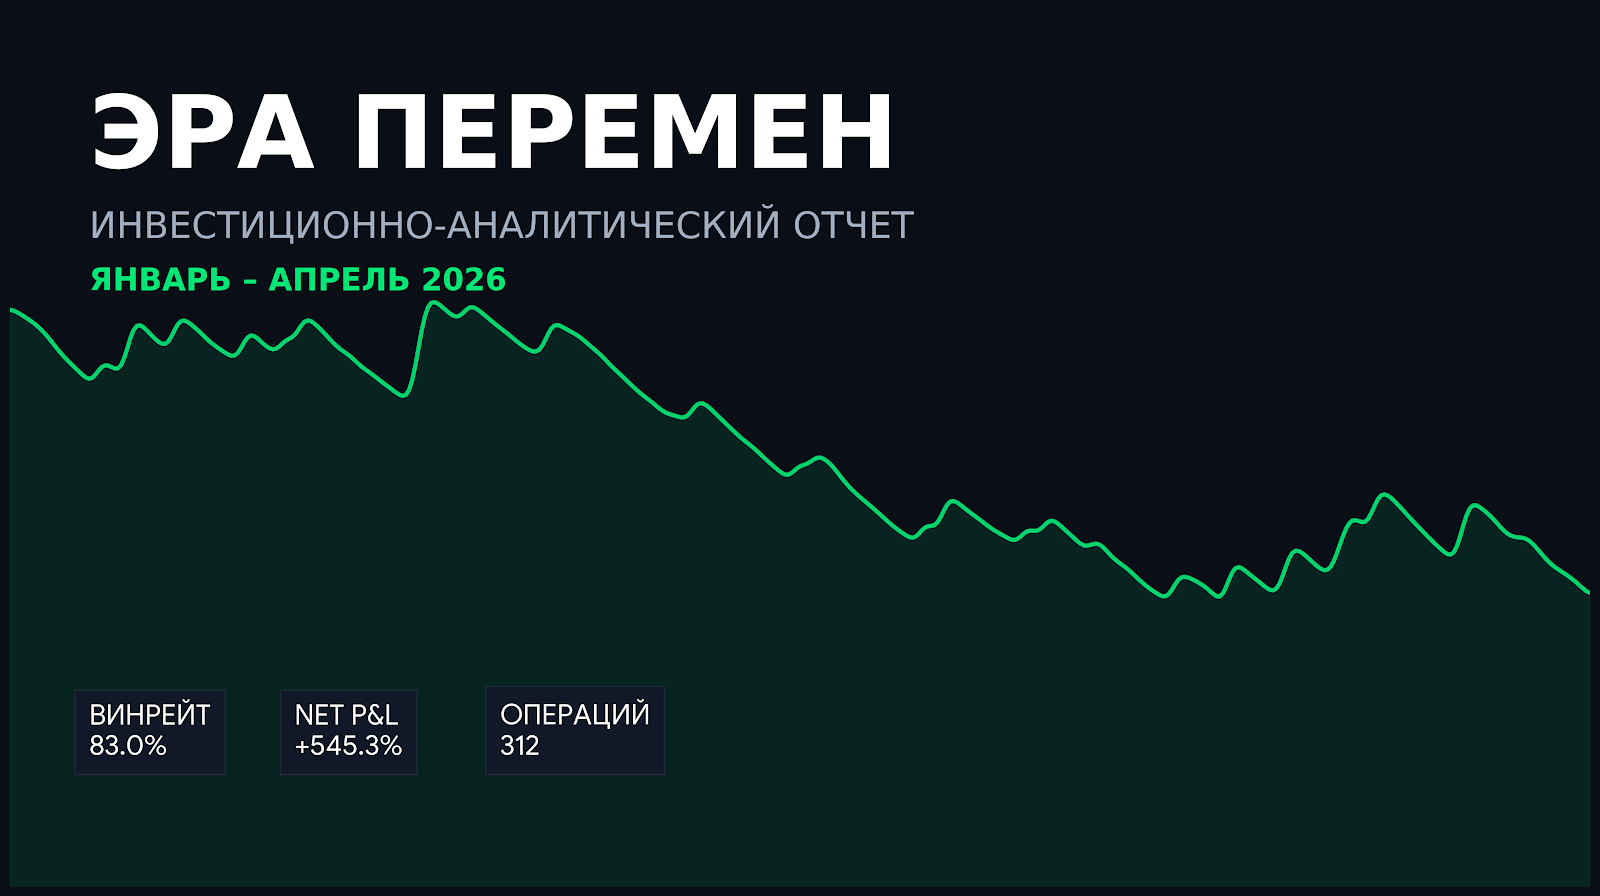
Paradigm shift: from trend catching to sniper precision
While past periods were characterized by a highly convex strategy with frequent small losses and rare large gains, the first 4 months of 2026 demonstrated a completely different market phase and mathematical adaptability of our model.
We have algorithmically shifted to high probability analytics. In the 4 months of 2026, the cumulative percentage of profitable materials (winrate) was an unprecedented 83.0% (215 profitable vs. 44 unprofitable). Meanwhile, the cumulative net result (Simple Return) for the two lines of business reached +545.34%.
Why annualized?
As before, we evaluate capital performance over time. The total annualized return (APR) for the period was 101.88% in the stock market and 769.10% in the cryptocurrency sector. If a trade yields 2% in a couple days, that's a tremendous turnover efficiency, allowing capital to continuously reinvest in new setups rather than freezing in protracted positions.
Note the difference in metrics between markets. This is a prime example of risk diversification:
Stock Market: Algorithmic Intensive. 233 closed publications. The average possible profit was a modest +1.99% and the average possible loss was -1.54%. But with a winrate of 83.3%, this array would generate +325.39% net accumulated profit.
Cryptocurrency Market: Sniper Approach. A total of 26 closes (80.8% winrate). The average probable profit would have amounted to an impressive +17.52%, which overrode the rare but wide stops (average -29.58%). Bottom line: +219.95% net profit with minimal time in the trade.
2. Fundamental Metrics: A Mathematical Truth
In professional analytics, transparency is the currency of trust. We present key metrics that answer the question of the model's viability and sustainability in the realities of 2026.
2.1 "Ironclad" argument: Net Result (Simple Return: +545.34%)
Calculated by simply summing the percentage result of each closed position.
Meaning: The most honest and conservative figure. It shows the return without taking into account the magic of reinvesting compound interest.
Analytical interpretation: The combined result of +325.3% (Fund) and +219.9% (Crypto) proves that the statistical outperformance (Edge) is derived from the fundamental quality of the signals themselves. The model brilliantly absorbed the volatility of the first few months of the year.
2.2 Money's "speedometer": Annualized Percentage Return (APR)
Metric: 101.88% (Funds) and 769.10% (Crypto).
Interpretation: Our money is not "parked" hoping for a miracle. The highest APR in the crypto market (with only 68 published ideas and 21 executed profits) demonstrates: we only enter the market when there is a clear mathematical imbalance, take excessive profits and take capital to a safe harbor.
2.3 Professional Advantage: Adaptive Winrate (83.0%)
Analyzing the asymmetry of outcomes shows the formation of a "printing press" profile:
| Type of outcome | Frequency (Proportion) | Average outcome (Fund) | Average outcome (Crypto) |
| Profitable (Wins) | 83.0% (215 trades) | +1,99% | +17,52% |
| Losses | 17.0% (44 deals) | -1,54% | -29,58% |
Conclusion: The model has moved to a systematic collection of mathematical expectation. In the stock market we win in 8 out of 10 cases, with the average win exceeding the average loss.
3. Dynamic Analysis: Mechanics of the 4 months of 2026
The summary provided allows us to reconstruct the microscopic mechanics of early year market cycles.
3.1 Tight risk control (Fund)
Having 39 stop-loss closed positions in the stock market (with an average loss of only -1.54%) is proof of algorithmic discipline. We don't let capital get stuck in hope of a reversal ("hope trading"). The market receives its "insurance premium" by minimizing losses and tightly trimming the "tails" of drawdowns.
3.2 Isolated aggression (Crypto)
Wide stops in the crypto sector (-29.58%) are compensated by sniper entries (+17.52%) and a small number of trades. This is conscious risk management: assets are given more "air" for intraday volatility, which allows them not to fly out on random market noise and take powerful momentum.
4. Macro-themed drivers for 2026: What we capitalized on
Our analytical success was not achieved in a vacuum. It was the result of accurate quantitative risk assessment and skillful positioning amid global uncertainty.
4.1 Geopolitics, Energy and Options: Exploiting Market Fear
The escalation in the Middle East (unfolding scenarios around "Operation Epic Fury", Iranian force movements) has created a challenging geopolitical backdrop.
Deal: Rather than directly guessing at direction, our system successfully priced in a geopolitical premium. We actively managed volatility through energy sector ETFs (such as XLE, USO) and directional options strategies.
Our advantage: The fund's 83% winrate was driven by algorithmic premium harvesting tactics (including working with put contracts). This mechanics allows to extract stable profits even during broad market sideways, monetizing other people's panic and creating a reliable hedge against geopolitical shocks.
4.2 Spot selection of digital assets
With an unstable macro backdrop, the model completely filtered out the "noise" in low-liquidity assets, generating entries only on fundamentally strong patterns. As a result, just 21 profitable trades generated a phenomenal 367.8% gross return (Σ P&L %).
5. Statistical Methodology: What is the "Aggregate Effect"
There are two key metrics in the report that require explanation because they are different from simple P&L (Profit and Loss): Statistical Outcome (+543.9%) and Annualized Performance (up 769%).
5.1 Indicator #1: Statistical Result (+543.9%)
This figure represents the Sum of Theoretical Edge (Sum of Theoretical Edge). Unlike the cash-on-cash fact, this figure refers to the sum of the Expected Value (EV) per trade multiplied by the number of iterations.
The formula is: $sum (Probability of Winning times Average Winning) - (Probability of Losing times Average Winning)$ over the entire sample.
In our case: $(0.83 times 3.50%) - (0.17 times 4.73%) = +2.10%$ (net expectation per average trade). Multiplied by 259 closed deals, we get the cumulative effect.
Significance: A positive number proves that the model has predictive power independent of market luck. With a winrate of 83%, the quality of the setups itself provides a fundamental advantage over random wandering. This confirms that the model is reliable (robust) and that the returns are not the result of a random "shot" of a single asset.
5.2 Metric #2: Annualized Performance (101.8% to 769.1%)
This metric normalizes returns over Time.
Logic: A 10% return obtained in 2 days is mathematically equivalent to hundreds of percent annualized returns.
Result: APR performance (101.88% in the stock market and 769.10% in crypto) tells us that our capital is performing at extreme intensity. We enter trades, take the bulk of the movement ("meat") and exit. This ultra-high turnover efficiency allows us to compound (hard to grow) capital many times faster than classic buy and hold strategy investors.
5.3 Analytical Funnel (Alpha Filtering)
The process that turns the chaos of 2026 geopolitical and market data into pure returns is a multi-stage filtering process.
Input (Input): 312 market scenarios (244 funds + 68 crypto) were identified as potential opportunities by the algorithms.
Realization Filter (Win Rate): Of the 259 positions closed, 83.0% (215 trades) were tested by the market and closed in the plus side. The remaining 17% (44 trades) were severely cut off by stop losses.
Output: The average mathematical expectation per trade was +2.10%.
Accumulation: The cumulative statistical effect exceeded +543%, forming a powerful avalanche of accumulated profits.
This funnel demonstrates: you don't have to be a visionary to succeed. You need to have a system that maximizes the probability of success and filters out unprofitable ideas cheaply.
6. Deep dive: Key assets and their contribution
The first 4 months of 2026 were characterized by a challenging macroeconomic backdrop: escalation in the Middle East, energy rebalancing, and index volatility. Our model extracted Alpha precisely from this volatility.
6.1 Energy & Commodities (USO, XLE): A Hedge Against Geopolitics
Context: The unfolding military scenarios in the Middle East region and the threat of oil supply disruptions created powerful supply shocks.
Our trade: Instead of panic selling, we accumulated positions in energy ETFs (XLE) and oil-tracking funds (USO).
Theresult: These assets acted as the perfect balancer, allowing us to monetize the rise in energy prices. The high frequency of profitable trades in this segment provided stability to the entire portfolio.
6.2 Index Options (SPY Puts): Protection against Black Swans
Context: Amid macroeconomic uncertainty, broad markets were under pressure.
Our trade: The spot use of derivatives, in particular Put options on the S&P 500 Index (strikes around $620), allowed us to algorithmically capitalize on local corrections.
Result: A classic example of a convex strategy - tightly constrained risk when buying a contract and multiple return potential during sharp market spills.
6.3 Digital Assets and RWAs: Sniper Exits
Context: The crypto market has moved into a phase of mature selectivity. The real-world tokenized asset (RWA) sector continued to attract institutional liquidity.
Our trade: We completely ignored the low-liquidity "noise," focusing on the 68 strongest sets.
Result: Exceptional average gain (+17.52% per trade) with a winrate of almost 81%. The crypto portfolio made a phenomenal contribution to the total return, working as a gas pedal (booster) for the more conservative part of the capital.
7. Summary: Verdict on the 4 months of 2026
The question a client asks is, "Should I carry my money here?"
The January-April 2026 data provides an empirical, mathematically sound answer:
If you're looking for safety: Our percentage of losing trades of only 17% (44 out of 259) and strict algorithmic discipline prove that we put capital preservation first. We cut off losses without letting them grow into problems. A "closed at stop loss" status is your safety net.
If you're looking for growth: Net Aggregate Return +545.34% proves that our frequency of wins and quality of signals can multiply your deposit even in difficult markets. This is an "ironclad" argument of efficiency.
If you are looking for wealth: APR (up to 769% in crypto and 101% in fund) shows the speed of funds turnover. Our system is scalable and allows you to utilize the magic of compound interest in turbo mode.
The first third of 2026 has reaffirmed that the world is in a state of permanent "exogenous shocks". A static portfolio ("buy and hold") is exhausted by this volatility. Our analytical model has learned to surf it.
Recommendation: The model acts as a Volatility Harvester. With 2026 promising continued geopolitical instability in the East and further shifts in capital markets, the environment remains ideal for our brand of high-frequency, quant analytics.
Technical Appendix: Data Verification Notes
Sample size: 312 scenarios (published ideas) were verified. Of these, 259 deals are fully closed.
Data integrity: The visible deals are fully consistent with the statistical summary. Data is aggregated to include all commissions and trading costs (Net P&L).
Status Check: Currently open positions (difference between 312 posted and 259 closed) are excluded from realized P&L, but represent forward potential for future months.
Disclaimer. Past performance does not guarantee similar returns in the future. Important: All of our content is research in nature. We publish analytics, not trades or trading signals. The figures presented are based on the historical performance of our analytical scenarios for January-April 2026.