Executive Summary
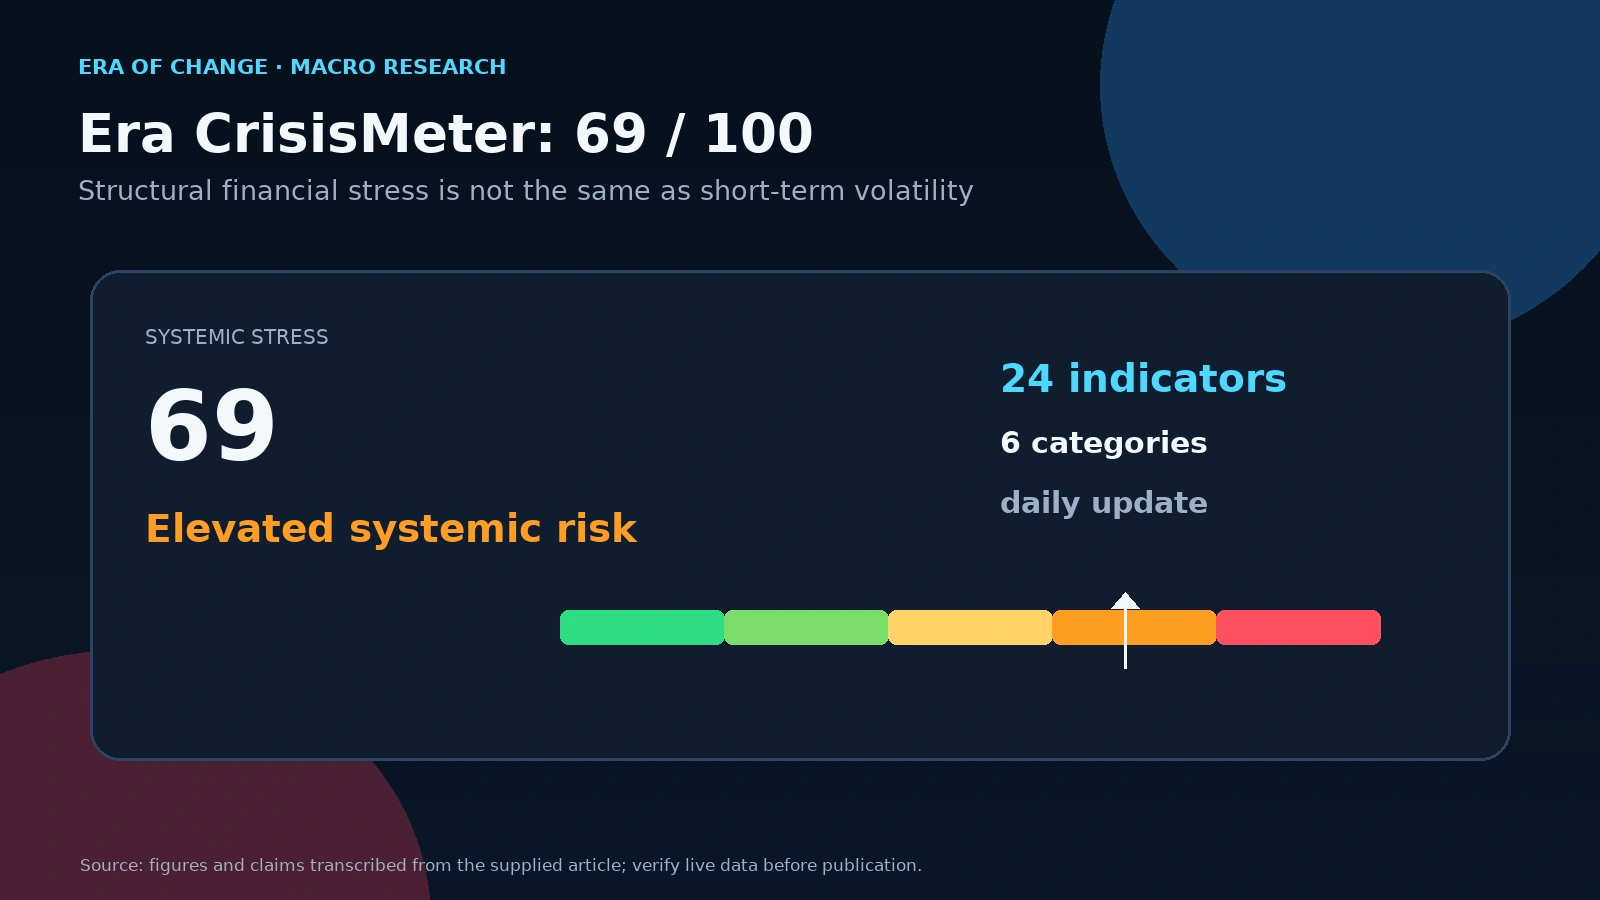
The Era CrisisMeter is the operational expression of the Era Global Risk Index, a composite updated daily that aggregates 24 structural macroeconomic and geopolitical indicators into a single score between 0 and 100 representing systemic financial stress. It does not measure market sentiment, news cycles, or short-term volatility. It measures the structural condition of the financial system's circulatory architecture: credit markets, interbank liquidity, monetary policy, capital flows, labor dynamics, and geopolitical risk concentration.
The CrisisMeter reading reported in this July 9, 2026 analysis is 69 out of 100. E.R.A. interprets this as elevated structural risk across several categories, not as a live quotation or a statistically calibrated probability of a crash.
This article explains what the CrisisMeter is, what each zone on the scale actually means in structural terms, and why the most counterintuitive reading on the entire index, above 85, is not a signal to panic. It is something else entirely.
Key Takeaways:
- The CrisisMeter measures structural financial stress, not market sentiment or volatility
- Its framework spans six structural categories: monetary policy, credit markets, interbank liquidity, capital flows, labor dynamics, and geopolitical risk
- In E.R.A.'s framework, readings above 60 call for closer risk monitoring and a review of leverage and liquidity
- E.R.A. treats sustained readings above 75 as a maximum-defense zone; the score alone does not establish that corporate defaults are occurring
- Readings above 85 represent E.R.A.'s acute-stress zone, where forced selling may create selective opportunities but does not guarantee a market bottom
- The CrisisMeter is a risk management framework, not a market timing tool
Introduction
The way most people learn about financial crises is through announcement. Markets fall sharply. Analysts appear on television. A government body convenes. A declaration is issued. By the time all of that happens, the structural conditions that produced the crisis have typically been present in the data for months, sometimes for the better part of a year.
I have spent a long time studying the gap between when financial stress begins to build and when it becomes visible to the average market participant. That gap is where the real risk management happens. Not after the VIX has spiked to 40 and everyone is using the word "systemic" on a daily broadcast. Before. When the instruments that actually read the health of the financial system are already telling a different story than what equity markets are pricing.
The Era CrisisMeter was built to make that gap measurable. It is not a volatility index. It is not a sentiment tracker. It is a structural diagnostic, a daily reading of the financial system's bloodstream, aggregating 24 independent indicators that have historically preceded major dislocations. It produces a number between 0 and 100. What that number means at each stage, and what an investor should logically do about it, is what this article is for.
What Is the Era CrisisMeter?
The CrisisMeter is the primary output of the Era Global Risk Index, our proprietary framework for monitoring the structural health of the global financial system. It is updated daily. Its inputs are drawn from the Federal Reserve, the U.S. Treasury, the Bureau of Labor Statistics, the Bureau of Economic Analysis, and equivalent international institutions including the IMF, OECD, and Bank for International Settlements.
The score reflects the aggregate reading of 24 structural indicators organized across six categories: monetary policy conditions, credit market stress, interbank liquidity, capital flows and money supply dynamics, labor and consumption pressures, and geopolitical risk. Each indicator is normalized against its historical range and weighted dynamically according to its current deviation from historical norms and its demonstrated correlation with subsequent financial stress events.
What the CrisisMeter is not matters just as much as what it is. It is not a volatility measure like the VIX, which reads equity options pricing and reflects what the market has already priced into its fear of near-term swings. It is not a news-based sentiment index that quantifies uncertainty language in financial press. It is not a trading signal or a market timing tool. A reading of 69 is not an instruction to liquidate. It is a structural measurement that tells you the probability distribution of outcomes over the next 12 to 24 months has shifted in a direction that your portfolio should reflect.
Why Traditional Risk Indicators Are Not Enough
The tools most investors rely on were not designed to catch slow-building systemic stress. This is not a criticism of the frameworks themselves, each measures something genuine. The problem is that investors use them as proxies for systemic risk, which is a different thing altogether, and the gap between what these tools measure and what systemic risk actually looks like is where the most costly surprises live.
The VIX measures the 30-day implied volatility of S&P 500 options. When the market is nervous, options are expensive, and the VIX rises. That is useful information about current market sentiment. It is not useful information about structural stress that is building below the surface. The VIX spent most of 2007 below 20 while the interbank funding markets were already showing the kind of pressure that would eventually produce the Lehman Brothers collapse.
The TED spread, the gap between short-term interbank lending rates and Treasury yields, was already widening in August 2007. The credit markets were signaling. The VIX was calm. By October 2008, the VIX had spiked amid acute credit stress. That signal arrived precisely when it was no longer actionable.
GDP and official economic data carry the same problem in a different form. These indicators describe what the economy produced in the quarter that has already ended.
By the time the NBER's Business Cycle Dating Committee officially declares a recession, which requires committee review of multiple quarters of data, the recession has typically been running for six to twelve months. Understanding this is essential to understanding why early structural analysis matters at all. GDP is the rear-view mirror of macroeconomics. It is the official record of what already happened. It cannot function as an early warning system.
News-based frameworks draw on different text corpora. The World Uncertainty Index, for example, tracks uncertainty-related language in Economist Intelligence Unit country reports, while other indices may analyze financial press or brokerage reports. These measures describe the information environment rather than the financial system’s actual structural condition. A geopolitical development can produce severe financial stress without dominating news coverage. An event can saturate every headline while markets absorb it with minimal structural impact. What matters is not what journalists are writing about. It is what the money is actually doing in the credit, funding, and capital flow markets.
No single indicator captures systemic risk, because systemic risk is not a single-variable event. It emerges from the simultaneous deterioration of multiple structural dimensions and then amplifies through the feedback loops between them. That is precisely what the CrisisMeter was built to detect.
What the CrisisMeter Actually Measures
Rather than cataloguing all 24 indicators, let me explain the architectural logic because understanding the architecture is what makes the score interpretable in practice.
Monetary Policy Conditions captures the real tightness of central bank policy: not the stated rate alone, but the gap between current policy and what neutral monetary conditions would look like given actual inflation and output dynamics. When the Fed holds rates materially above neutral, credit creation is being compressed system-wide. That compression appears in the structural data before it appears in growth statistics.
Credit Market Stress is tracked primarily through the ICE BofA US High Yield Option-Adjusted Spread, the premium investors demand to hold sub-investment-grade corporate debt relative to equivalent-maturity Treasuries. This spread is the credit market's real-time verdict on institutional default risk expectations. When it widens, institutional capital is demanding more compensation for credit risk. When it compresses, as it has to approximately 2.71 percent as of mid-June 2026, the risk is not relief. It is a divergence between credit pricing and what the structural indicators across other categories are showing. Tight spreads in a 69-reading environment are not confirmation that conditions are benign. They are a signal that complacency may be compounding the underlying structural risk.
Interbank Liquidity monitors short-term funding conditions, including SOFR and other relevant measures. SOFR measures the cost of overnight cash borrowing collateralized by U.S. Treasury securities; it is a secured repo rate, not a direct measure of unsecured bank-to-bank lending. A SOFR-OIS spread compares SOFR with an overnight-indexed swap rate, and its value depends on the tenor and calculation used; it should be distinguished from unsecured interbank-credit measures. On September 15, 2025, SOFR was 4.51%, 18 basis points above EFFR. The U.S. Treasury described the pressure around tax payments and Treasury settlements as modest and short-lived. A temporary funding-rate move is not, by itself, evidence of an emergency or impending crisis. Events like that rarely make the front page. They register in the short-term funding category.
Capital Flows and M2 Dynamics monitors money supply conditions alongside the China Credit Impulse. China accounts for approximately one-third of global demand impulse. When its credit creation contracts, the effect on commodity prices, export economies, and cross-border capital flows arrives in the structural data nine to twelve months before it becomes visible in trade statistics or official economic releases.
Labor and Consumption Pressures incorporates initial jobless claims, consumer confidence, and real wage dynamics, the indicators that reveal whether household balance sheet stress is beginning to compound the pressures that are already visible in the credit and interbank categories.
Geopolitical Risk is the sixth layer. Here, structural geopolitical dynamics (currency regime fragility, sanctions impact, sovereign debt stress, escalation risk) are incorporated not as sentiment measures but as structural inputs that affect supply costs, capital flow patterns, and monetary policy independence in quantifiable ways.
Financial systems fail when stress accumulates across these categories simultaneously and the feedback loops between them begin amplifying the deterioration faster than any single indicator can track. That convergence is what the CrisisMeter was designed to detect before it becomes visible on the surface.
Understanding the CrisisMeter Scale
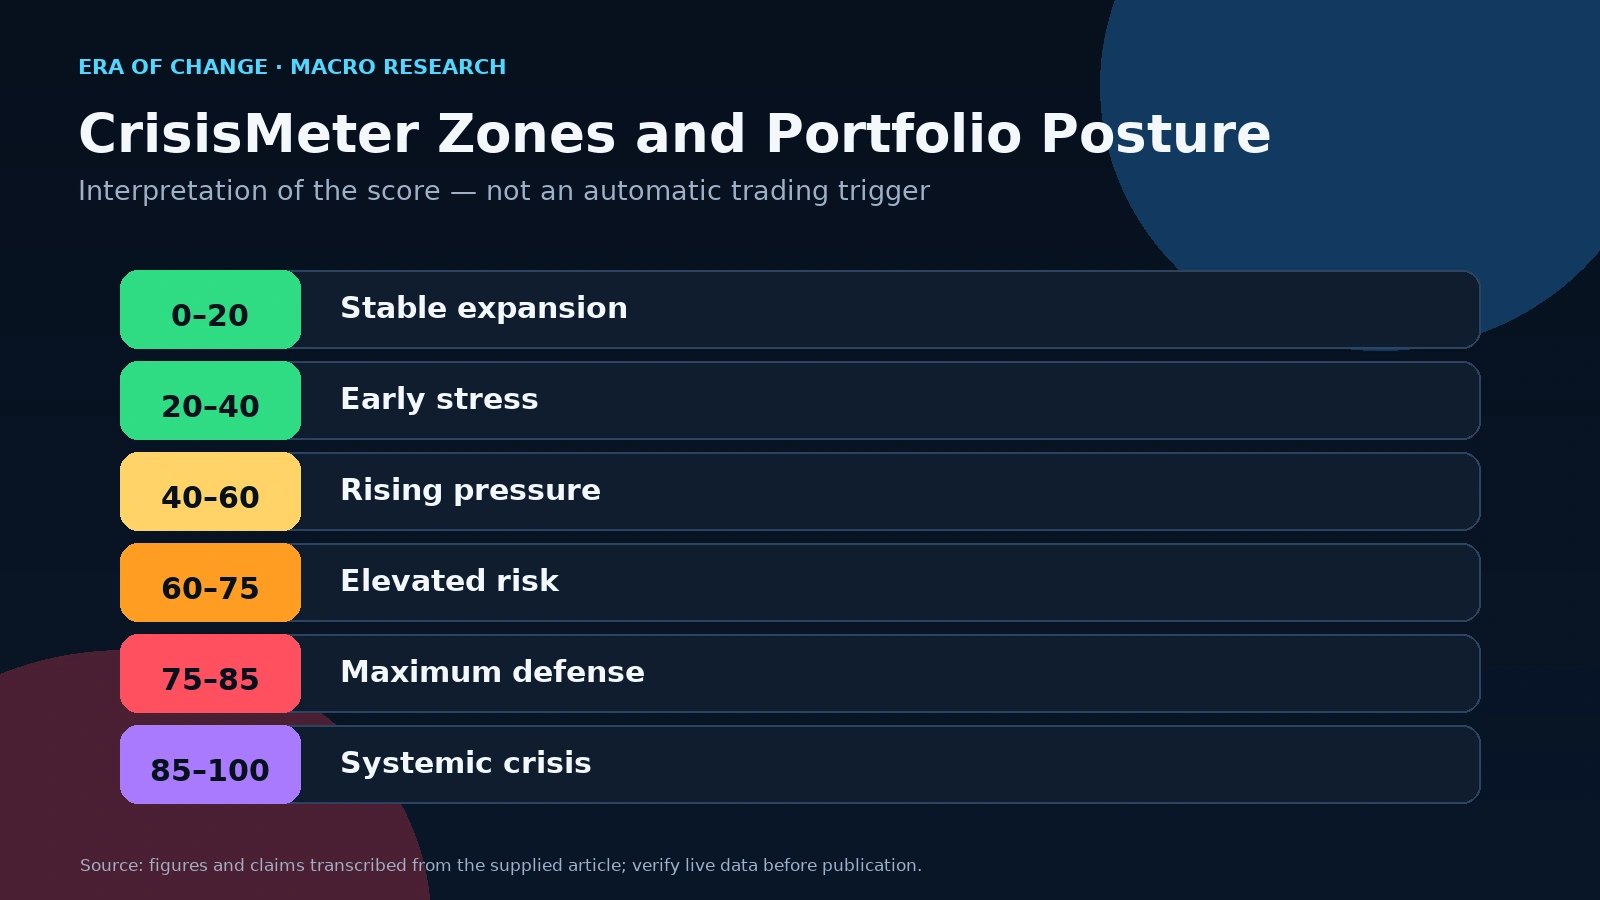
The score runs from 0 to 100. Each zone carries a specific structural meaning, not a color on a gauge, but a precise description of what the financial system's underlying architecture looks like at that reading.
0 to 20 — Stable Expansion. Liquidity is ample. Credit conditions are accommodative. Monetary policy is calibrated near neutral. Interbank funding markets operate without measurable stress. Structural conditions support risk-taking, and the probability distribution of outcomes is weighted toward continued growth.
20 to 40 — Early Stress. One or more indicator categories show deviation from historical norms. The system's overall architecture is sound, but a structural shift is beginning in at least one dimension. The appropriate response is monitoring, observing whether the stress is isolated to a single category or beginning to spread to adjacent ones.
40 to 60 — Rising Structural Pressure. Material stress is present across multiple categories. The system is still absorbing the pressure, but its resilience is diminishing. Capital is beginning to distinguish between high-risk and low-risk assets in ways that are not yet visible in headline equity market pricing. This is the zone where structural analysis starts diverging meaningfully from conventional market commentary.
60 to 75 — Elevated Systemic Risk. This is where we are now, at 69. What this reading communicates is not that a crash is imminent or certain. It communicates that the structural conditions are assembled for meaningful economic deterioration over the next 12 to 24 months that the foundations are under simultaneous stress across multiple categories, and that institutional capital has already begun the quiet repositioning that precedes visible surface events. Markets may appear relatively stable. The architecture underneath is not.
75 to 85 — Transition to Maximum Defense. This is the threshold that produces the most material shift in my actual portfolio behavior. In this framework, sustained readings above 75 prompt a check for actual defaults, labor-market deterioration and tighter credit. Those developments must be verified from their own data rather than inferred from the score alone. The system stops absorbing the stress and begins transmitting it. Maximum defensive positioning at this level is the author's risk-management preference, not a universal rule for every portfolio.
85 to 100 — Systemic Crisis. The CrisisMeter above 85 is territory I think of as the financial infarction zone. The system's circulatory architecture fails simultaneously across all categories. This is structurally different from anything at 70 or 75, and understanding why it is different is one of the most important things any investor can internalize before it happens.
What Happens Above 85: The Financial Infarction
Most investors assume that a CrisisMeter reading above 85 is the worst signal the index can produce. In terms of systemic stress, it is. In terms of long-term opportunity, the picture is considerably more complex and it is the counterintuitive dimension that I want to be explicit about.
When the index reaches 85 and above, it reflects a system in acute crisis: panic-level expansion in credit spreads, paralysis in interbank funding markets, and a cascade of margin calls creating an acute shortage of dollar liquidity across the entire financial architecture simultaneously. This is precisely the structural picture of September 2008, when Lehman Brothers filed for Chapter 11 bankruptcy with more than $600 billion in assets, triggering the broadest forced liquidation in the post-war era. It is the structural picture of March 2020, when the COVID shock compressed the same dynamic into a matter of weeks rather than months.
In both cases, what happened to asset prices was counterintuitive in ways that continue to surprise investors who have not studied the mechanism directly. Stocks fell. Corporate bonds fell. But gold also fell down approximately 21 percent in fourteen days between late February and March 17, 2020, hitting a low of $1,472 per ounce. Oil fell. Even U.S. Treasury bonds experienced dislocated pricing in the acute phase. Everything fell simultaneously not because every asset became fundamentally less valuable overnight, but because every market participant needed cash at the same time. Funds were selling gold to cover equity margin calls.
Prime brokers were reducing exposure across all asset classes indiscriminately. Institutions were liquidating positions not because they chose to, but because the mechanics of their leverage and collateral structures obligated them to. The correlation between every asset class in the system moved toward one, driven not by individual asset fundamentals but by a single systemic force: the urgent, uncoordinated, simultaneous demand for liquidity.
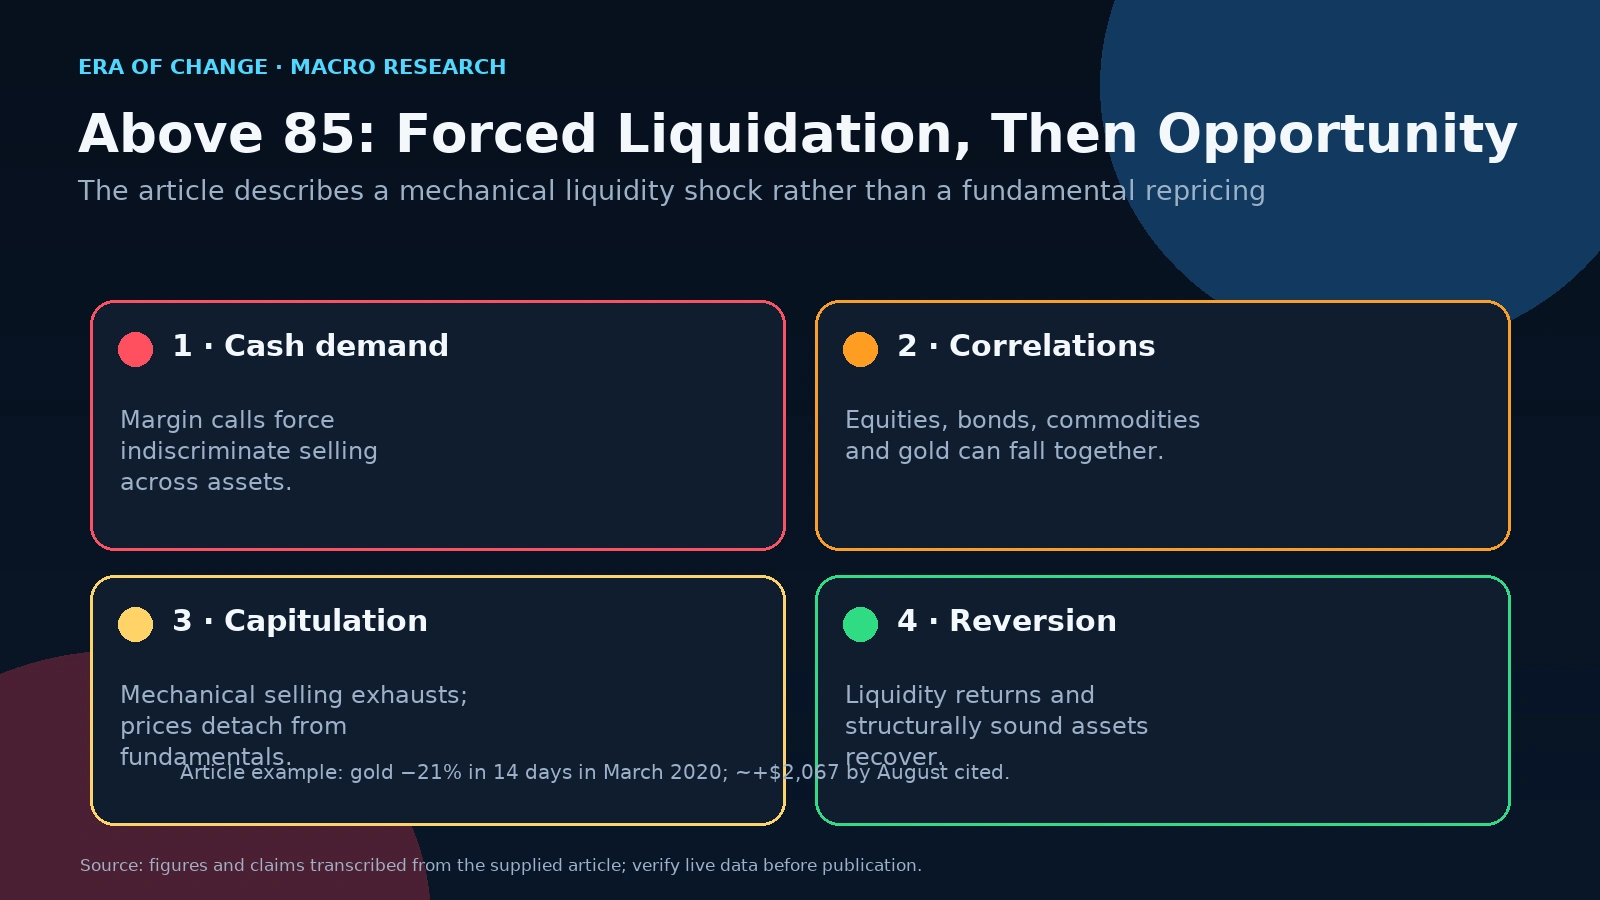
This is the financial infarction. The bloodstream of the economy stops circulating. Every system that depends on that circulation (credit extension, funding markets, collateral chains, derivative settlements) begins to fail at once.
The counterintuitive reality that history keeps producing is this: those acute forced liquidation phases have also been the best long-term entry points for real assets and structurally sound positions. Gold fell 21 percent in March 2020 and reached a record high of $2,067 per ounce by August of the same year, a gain of approximately 40 percent from the March low, in five months. The selling during a forced liquidation phase is mechanical, not fundamental. It reflects margin call dynamics, not a reassessment of intrinsic value. When the forced selling ends, the reversion can be violent.
The practical implication for how I approach a CrisisMeter reading above 85 is that the strategy does not simply intensify the defensive posture from the 75 range. It partially inverts. At readings above 85, I am looking for the assets that are being liquidated at prices driven by mechanics rather than fundamentals and preparing to accumulate them precisely because the market is in capitulation. This is not courage. It is the logical consequence of understanding what is actually happening during that phase.
How I Use the CrisisMeter in My Own Portfolio Decisions
I want to be direct here, because I think the most useful thing I can offer is not an abstract description of a framework, It is an honest account of how I actually use it.
The CrisisMeter is not background information for me. It is a direct input into portfolio risk parameters. When it moves through meaningful thresholds, my positioning moves, not in response to a market price or a headline, but in response to a structural reading.
At the current level of 69, I am in a mode I would describe as disciplined, systematic reduction. I have been reducing leverage, taking profits on positions that have become stretched relative to structural conditions, and maintaining what I consider core long-term hedging positions, specifically, directional put structures on broad equity indices using SPY options with extended expiration windows. I hold these hedges not because I know exactly when or how the structural stress will express itself as a visible market event, but because the reading tells me the probability distribution is skewed enough that asymmetric protection is worth carrying at its current cost.
The cost of that protection is not constant. This is the point about the VVIX, the implied volatility of the VIX itself that I find most investors systematically underweight in their thinking. The VVIX in a 69-environment is meaningfully lower than the VVIX in a crisis. When the CrisisMeter approaches 80 and the structural stress becomes visible on the surface, options premiums reflect that fear, and the cost of building the same protection is materially higher, sometimes prohibitively so. The time to buy insurance is before the fire, not during it. Not because you know with certainty the fire is coming, but because the structural environment is the best signal you have about when the premium pricing is still rational.
When the Strategy Changes: Three Structural Stages
The CrisisMeter produces three distinct shifts in my investment posture, each corresponding to a zone that crosses a structural threshold, not a price level, not a central bank announcement, not a GDP print.
Above 60. Risk reduction becomes systematic rather than selective. I reduce leverage, increase the allocation to genuinely liquid assets, and review the portfolio for positions that would be difficult to exit cleanly under stress conditions. The goal is optionality, ensuring that when the structural reading demands a more decisive response, I have the capacity to act.
Above 75. The posture shifts to what I think of as maximum defense. Free liquidity becomes a priority rather than a drag. Options-based hedging on tail risks moves from a structural position to an actively managed one. Speculative exposure is reduced toward zero. The portfolio's center of gravity moves toward assets that generate real, tangible cash flows from established operations today, businesses with genuine pricing power, infrastructure, and commodity production capacity, rather than businesses priced on future earnings projections that assume a macro environment that may not survive the next twelve months.
Above 85. This is the counterintuitive stage, and it requires explicit psychological preparation to execute correctly. When the CrisisMeter crosses 85 and the system is in acute crisis, I shift from defense to selective, disciplined accumulation. The forced liquidation creates the kind of pricing in real assets, commodity producers, structural inflation hedges hat only appears in genuine panic conditions.
The challenge is that everything feels maximally dangerous at precisely the moment the long-term opportunity is most compelling. Understanding the mechanics of forced liquidation that the selling is not a reassessment of fundamental value, it is a cash demand shock is what makes it possible to act rather than freeze.
What Most Investors Get Wrong
The common thread across the most consequential investment mistakes I have observed and made is timing. Specifically, the persistent tendency to manage risk reactively rather than structurally.
The most damaging version of this is the timing of portfolio protection. Options-based hedging is most cost-effective when implied volatility is at moderate levels. When the VVIX is in its normal range, put structures on broad indices can be purchased at premiums that represent genuine insurance: meaningful downside protection at a manageable ongoing cost.
When the CrisisMeter moves through 75 and into the red zone, and the structural stress becomes visible to everyone, the VVIX spikes sharply, often above 130 or 150 in acute crisis phases, and the cost of the same protection becomes prohibitive. Investors who wait until they are genuinely frightened to buy insurance are not buying protection at that point. They are paying panic pricing for coverage they needed six months earlier.
The second error is the illusion that certain assets function as structural safe havens regardless of the macro environment. The most dangerous version of this in the current environment is treating large-cap technology companies as a defensive destination when conditions deteriorate. In a standard liquidity-driven recession, this reasoning has some historical support.
In a stagflationary environment with monetary contraction and rising real discount rates, it does not. When the discount rate rises and stays elevated, businesses whose entire valuation case was built on the assumption of cheap capital and high future-earnings multiples face multiple compression that is not a temporary market pricing event. It is a genuine structural re-rating. Technology megacapitalization companies were priced for a world of near-zero real rates that no longer exists. Treating them as a safe haven in a 69-reading environment is precisely backwards.
The third and most pervasive error is waiting for official confirmation before acting. Waiting for two consecutive quarters of negative GDP. Waiting for the NBER declaration. Waiting for the Federal Reserve to use the word "recession" in a press conference. By the time any of those confirmations arrive, the structural conditions that produced them have been present in the data long enough that the investor who responds at announcement has absorbed the full cost of the structural deterioration without the benefit of the early intelligence that would have allowed them to position ahead of it.
Managing capital from GDP prints and quarterly earnings reports is managing from the rear-view mirror. It describes what already happened. The CrisisMeter is designed to tell you what the structural environment looks like before it becomes the announced record.
How the CrisisMeter Fits Within the Era Framework
The CrisisMeter does not operate in isolation. It is the aggregate output of a methodology that draws from multiple structural layers simultaneously, and its reading is sharpened considerably when interpreted alongside the individual components that comprise it.
The yield curve is one of the most historically reliable recession leading indicators available, but it captures one dimension of monetary transmission, and its inversion can persist for extended periods before the structural stress it signals becomes economically visible. M2 money supply dynamics tell you about the pace of monetary creation and what it implies for demand conditions nine to twelve months forward, the same lead time at which the China Credit Impulse operates for global demand impulse.
Credit spreads give you a real-time market indication of corporate default expectations. Secured repo rates such as SOFR help track collateralized short-term funding conditions; they are not direct measures of unsecured bank-to-bank lending. A SOFR-OIS spread compares SOFR with an overnight-indexed swap rate, with the measured spread depending on the tenor and calculation used; it is distinct from a direct measure of unsecured bank-to-bank lending. Understanding recession probability frameworks and stagflation risk dynamics tells you whether the macro environment is moving toward the specific conditions that strip central banks of their most effective tools.
None of these indicators, read alone, gives you the complete structural picture. Each captures a dimension. The CrisisMeter assembles those dimensions into a single interpretable reading. The individual components tell you where the stress is concentrated and what its transmission mechanism is likely to be. The aggregate score tells you how broadly and how severely that stress is distributed across the system as a whole. Both levels of the analysis are necessary for the picture to be complete.
Current Reading: What 69 Means Today
At 69, the CrisisMeter is in the elevated systemic risk zone. This is not where it was two years ago, and the trajectory matters as much as the level.
The reading reflects simultaneous deterioration across monetary, credit, geopolitical, and capital flow categories that does not yet appear in the headline economic data. Credit spreads, at approximately 2.71 percent on the ICE BofA US High Yield Index as of mid-June 2026, look relatively contained in isolation. They look different when held alongside what the interbank liquidity category and the geopolitical risk category are currently showing.
A tight credit spread in an environment where the CrisisMeter reads 69 is not evidence that the structural concerns are overstated. It is evidence of a divergence between the surface pricing of risk and the structural reality beneath it and divergences like this have a historical tendency to resolve in the direction of the structural reading, not the surface complacency.
I am not putting a date on when that resolution happens. The CrisisMeter is not a calendar. Markets can sustain elevated structural stress readings for extended periods before a surface event makes the underlying conditions visible to everyone who was not watching the structural data. What I am saying, at 69, is that the system's structural margin of safety is thinner than headline asset pricing reflects, and that the probability-weighted cost of being under-hedged and over-leveraged in this environment is higher than the cost of the alternative.
How Investors Should Use the CrisisMeter
The distinction between a risk management tool and a prediction engine matters more than almost anything else in how you approach an instrument like this.
A prediction engine tells you what will happen and when. The CrisisMeter does not do that, and I want to be explicit about why: the system can remain at elevated stress readings for extended periods without producing a visible crisis, just as it can sit at low stress readings and still be struck by a non-structural exogenous shock. The March 2020 collapse was driven by a health crisis that no structural financial indicator could have predicted, though the pre-existing vulnerabilities the CrisisMeter was already tracking made the shock more severe and the initial financial system response more acute than it would have been from a position of genuine structural stability.
Used correctly, the CrisisMeter is a framework for adjusting portfolio risk parameters based on structural evidence rather than narrative. It is a reason to reduce leverage when the structural data suggests the environment is becoming more dangerous, not because a crash is certain, but because the cost of being wrong in a deteriorating structural environment is asymmetric. It is a reason to build hedging positions while they are still affordable rather than waiting until the stress becomes visible and protection costs reflect panic. It is a reason to monitor the specific categories driving the reading to understand where the stress is concentrated and how it is likely to transmit through the system.
At 69, I use the CrisisMeter to maintain discipline to resist the temptation to add leverage when markets are calm, to hold the protection I have already built even when the surface looks stable, and to remain positioned for the structural scenario the evidence describes even when that positioning feels early. The investors who use structural risk intelligence most effectively are not the ones who use it to call the exact moment of crisis. They are the ones who use it to ensure that when the structural stress becomes publicly visible, they have the positioning and the liquidity to act rather than react.
Era Analyst's Perspective
"The thing about the CrisisMeter above 85 that most people find genuinely difficult to accept is that it is simultaneously the worst structural reading the index produces and one of the best long-term opportunity windows I have ever encountered. In September 2008 and in March 2020, everything fell at once: equities, corporate bonds, gold, oil. Asset class correlations converged toward one, not because every asset became permanently less valuable, but because the entire system needed cash simultaneously. Funds were selling gold to cover equity margin calls.
Prime brokers were reducing positions across the board. Institutions were liquidating assets they would never sell under any other conditions, at prices that reflected the urgency of their liquidity need rather than any assessment of fundamental value. This is the financial infarction: when the bloodstream of the economy stops circulating and every participant is forced into the same action at the same time.
Gold fell approximately 21 percent in fourteen days in March 2020, hitting $1,472 per ounce. By August of that year it had reached a record high above $2,067, roughly 40 percent from the March low, in five months. That is not a coincidence. That is the pattern that forced liquidation produces when the mechanical selling ends and fundamental value reasserts itself.
At a CrisisMeter reading of 69, we are not in a financial infarction. We are in the zone where those conditions are assembling. The investors who buy their insurance now, while the VVIX is still at levels that make protection affordable, before the reading crosses 75 and spreads the structural stress into visible events, are the ones who will have the liquidity and the positioning to buy when the reading crosses 85 and the forced selling creates the kind of pricing that only exists in genuine capitulation."
Frequently Asked Questions
What is the Era CrisisMeter?
The Era CrisisMeter is the primary output of the Era Global Risk Index, a proprietary composite that aggregates 24 structural macroeconomic and geopolitical indicators into a single daily-updated score from 0 to 100 representing systemic financial stress. It monitors six structural categories: monetary policy conditions, credit market stress, interbank liquidity, capital flows and money supply, labor dynamics, and geopolitical risk and weights each indicator dynamically based on its historical correlation with subsequent financial stress events. It is a structural diagnostic, not a sentiment measure, a volatility index, or a market timing tool.
How is the CrisisMeter different from the VIX?
The VIX measures the 30-day implied volatility of S&P 500 options, a real-time reading of what equity options traders believe about near-term price swings. The CrisisMeter measures the structural condition of the global financial system across 24 independent indicators. These two instruments measure fundamentally different things. The VIX can remain below 20 while the CrisisMeter registers severe structural stress, which is exactly what happened throughout most of 2007, when credit and interbank stress was already building fourteen months before the Lehman bankruptcy made the systemic crisis visible to everyone. The gap between a calm VIX and an elevated CrisisMeter reading is precisely where early structural intelligence has its highest value.
What does a CrisisMeter reading of 69 mean?
A reading of 69 falls within E.R.A.'s elevated-risk zone, above 60 and below its maximum-defense threshold of 75. These are interpretive thresholds, not independently calibrated default probabilities. It does not mean a market crash is imminent. It means the structural margin of safety in the financial system has narrowed to the point where the author considers downside risks greater than headline asset prices suggest. Disciplined reduction of leverage, maintenance of existing hedging positions, and avoidance of new speculative exposure are structurally justified at this level.
What happens when the CrisisMeter exceeds 85?
E.R.A. uses readings above 85 to describe acute stress, looking for evidence such as widening credit spreads, funding disruption, dollar liquidity shortages and cascading margin calls. In 2008 and March 2020, these conditions produced forced liquidation phases in which many assets came under selling pressure as investors sought cash; that does not mean every asset class fell throughout either crisis. The author sees stressed conditions as a reason to search selectively for undervalued assets, while recognizing that stress alone does not identify a market bottom. The strategy at 85+ is not intensified defense. It is a disciplined, selective accumulation of assets that forced liquidation has priced at irrational discounts.
Can the CrisisMeter predict market crashes?
No, and I want to be clear about why. The CrisisMeter is a structural diagnostic, not a prediction engine. It measures whether the conditions under which crashes become probable are assembling or dissipating, the structural margin of safety the system carries. It does not tell you the date of the event, the immediate trigger, or the exact sequence of transmission. Many crises are triggered by exogenous non-structural shocks, the March 2020 collapse is the most recent clear example,
that are not predictable from structural data alone. What the CrisisMeter tells you reliably is when the system's resilience has diminished to the point where the cost of being unhedged and leveraged has become structurally unjustified.
How often is the CrisisMeter updated?
Daily. Data is collected immediately following official publications from the Federal Reserve, U.S. Treasury, Bureau of Labor Statistics, Bureau of Economic Analysis, and equivalent international institutions. The score reflects the most current available structural data across all six categories at any given time.
Which indicators are included in the CrisisMeter?
The index incorporates 24 structural indicators across six categories: monetary policy conditions including real rate dynamics and policy tightness relative to neutral; credit market stress centered on the ICE BofA US High Yield Option-Adjusted Spread; interbank liquidity including secured repo-market conditions such as SOFR and SOFR-OIS spread dynamics, which are distinct from unsecured interbank-credit measures; capital flows and money supply including M2 growth and the China Credit Impulse; labor and consumption dynamics including initial jobless claims and real wage trends; and geopolitical risk including currency regime fragility, sovereign debt stress scores, and escalation risk. Full methodology documentation is available at eraperemen.info/en.
How should investors respond to rising CrisisMeter readings?
The response is graduated and structural, not binary. Readings moving toward 60 warrant systematic leverage reduction and a review of the portfolio's ability to exit positions cleanly under stress. Sustained readings above 60 justify active defensive positioning, reducing speculative exposure, building cash reserves, and initiating options-based hedges while implied volatility remains at manageable levels. Above 75, the posture shifts to maximum defense: capital preservation takes priority over return capture, and tail-risk protection becomes the dominant concern. Above 85, the counterintuitive phase applies, identifying positions subject to forced mechanical liquidation and preparing to accumulate real assets and commodity producers at pricing driven by margin mechanics rather than fundamental value.
About E.R.A. OF CHANGES
E.R.A. OF CHANGES is an independent macroeconomic research and geopolitical intelligence firm providing institutional-quality analysis to investors worldwide. Our research combines macroeconomics, financial markets, blockchain analytics, and geopolitical risk into proprietary forecasting frameworks designed to identify structural market trends before they become consensus.
The Era Global Risk Index, updated daily from 24 structural indicators, serves as the foundation of our analytical methodology, providing a forward-looking measure of systemic financial stress grounded in structural economic evidence rather than market sentiment. Our full methodology, live index reading, and forecast archive are available at eraperemen.info/en.
The content published by E.R.A. OF CHANGES is for informational and educational purposes only and does not constitute financial, investment, legal, or tax advice. All views expressed are the personal analytical perspective of the author. Past forecast accuracy does not guarantee future results. Readers should conduct their own research and consult a qualified financial professional before making any investment decisions.
Sources
- FRED: ICE BofA US High Yield Index Option-Adjusted Spread (BAMLH0A0HYM2)
- FRED: Secured Overnight Financing Rate (SOFR)
- FRED: CBOE Volatility Index (VIX)
- Federal Reserve Bank of New York: SOFR Reference Rate Data
- CME Group: Is the SOFR Benchmark Becoming More Volatile?
- MacroMicro: US FRA/OIS Spread
- Cboe: VIX Volatility Products and Methodology
- SpotGamma: VVIX Explained — What the Volatility Index Tells Traders
- NBER: Business Cycle Dating Committee
- Yale Journal of Financial Crises: The Lehman Brothers Bankruptcy — The Global Contagion
- Brookings Institution: Lehman Brothers Collapse and the 2008 Financial Crisis
- GoldSilver.com: Gold During Recessions and Market Crashes
- Yahoo Finance: Gold During the COVID-19 Pandemic and Beyond



