Historical examples and the accompanying timeline are illustrative applications of the framework, not published contemporaneous index observations or an independently validated backtest.
Executive Summary
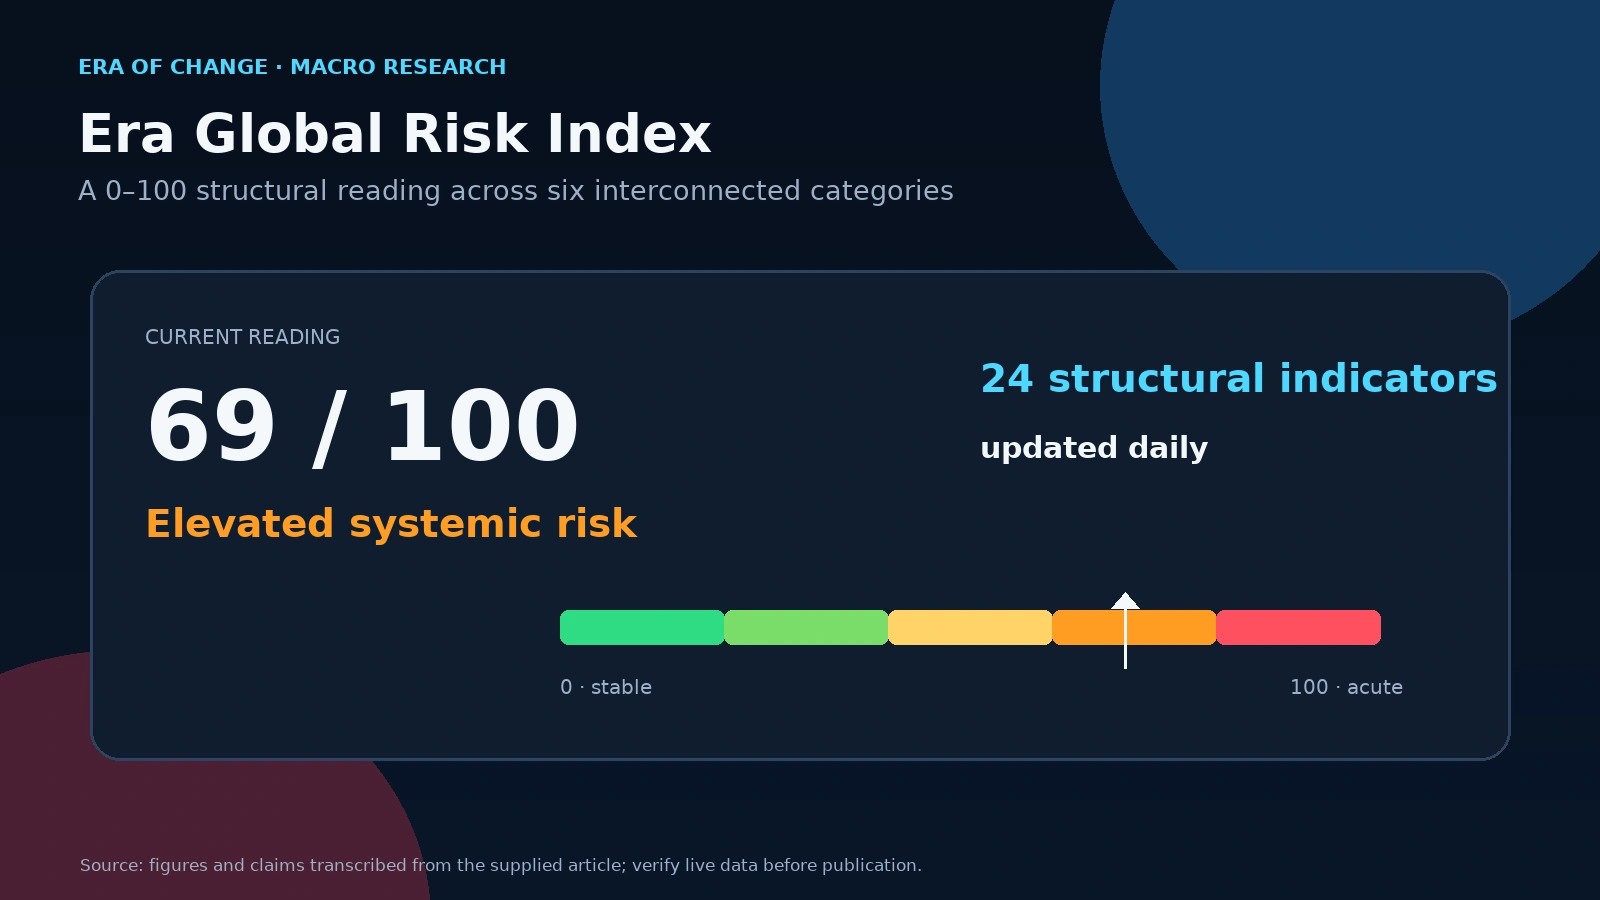
The Era Global Risk Index, what we call the EraCrisisMeter, is a proprietary macroeconomic indicator that aggregates 24 structural data points across liquidity conditions, credit markets, monetary policy, capital flows, and geopolitical dynamics to assess the probability of systemic financial instability. It is updated daily. It does not measure sentiment. It does not scan news cycles. It measures whether the structural foundations of the global financial system are under stress and by exactly how much.
The E.R.A. reading reported in this June 11, 2026 analysis is 69 out of 100. This author-reported score is not a live quotation or a 69% probability of crisis.
That number has a precise meaning. This paper explains what it is, how we built it, what history would have looked like through its lens, and why we believe most investors are currently navigating a period of elevated systemic risk with instruments that were not designed for the conditions they are trying to read.
Why We Built This
I've spent years studying how financial crises form, and one pattern repeats with uncomfortable regularity. The system fails visibly, publicly, catastrophically and almost everyone looks genuinely surprised. But if you go back and examine the structural data in the months before each major dislocation, the signals were present. The interbank spreads were already widening.
The credit impulse was already fading. Capital was already repositioning quietly. The foundations were buckling well before the surface cracked.
The tools most investors rely on were never designed to catch that. The VIX shows fear after it's already priced. GDP shows you what happened last quarter. News-based sentiment indices reflect what journalists were writing about, which is usually whatever already occurred.
We built the Era Global Risk Index because we needed something structurally different. A framework that reads the plumbing of the financial system before the pipes burst. Not a trading signal. Not a market prediction. A genuine early warning instrument that aggregates the indicators which have historically preceded major market dislocations and presents them as a single, interpretable score.
The Problem With Existing Risk Indicators
I want to be precise here. I am not dismissing the frameworks that already exist. The World Uncertainty Index, developed by Ahir, Bloom, and Furceri at the NBER, is serious academic work built on decades of data. BlackRock's Geopolitical Risk Indicator is produced by one of the most sophisticated investment organizations in the world. The VIX has been the dominant fear gauge for thirty years.
Each of these measures something real. But each has a structural constraint that limits what it can tell you about the kind of risk I care about most: the slow-building, interconnected, systemic kind that produces the events people later call black swans.
The VIX Measures Fear, Not Fracture
The VIX is a 30-day implied volatility index derived from S&P 500 options pricing. It measures what options traders collectively believe about the likely magnitude of near-term price swings. When the market is nervous, options are expensive, and the VIX rises. That is genuinely useful information. But it reflects current consensus and consensus is almost always wrong at inflection points.
In 2007, as the subprime mortgage architecture was already fracturing, the VIX spent most of the year below 20. The TED spread was beginning to widen. Interbank stress was building in the funding markets. Yet the VIX remained calm because equity options traders hadn't yet priced what the credit markets were already expressing. By October 2008, the VIX hit 89. The signal arrived precisely when it was no longer actionable.
The VIX does not measure fracture. It measures fear. These are related, but the gap between them is exactly where financial crises live.
Economic Data Tells You What Already Happened
GDP, unemployment, and CPI are retrospective by construction. They are published weeks to months after the underlying economic activity they describe has already occurred. By the time the NBER officially declares a recession, a determination that requires committee review of multi-quarter data, the recession has typically been running for six to twelve months. These indicators are the official record of history. They are critical for understanding the macro environment. But they cannot function as early warning signals. They are the autopsy, not the diagnosis.
News-Based Indices Measure Headlines, Not Foundations
The World Uncertainty Index quantifies the frequency of uncertainty-related language in Economist Intelligence Unit country reports. BlackRock's BGRI tracks geopolitical risk language frequency across brokerage reports and financial news, weighted by sentiment. Both are methodologically rigorous. Both measure something important.
But text-based indices measure the information environment: what analysts and journalists are focused on. They do not directly measure how the financial system is actually responding to that risk. A geopolitical development can produce enormous structural financial stress without dominating the news cycle. An event can saturate coverage while markets absorb it with minimal structural impact. What we need to understand is not what is being written. It is what the money is actually doing.
Introducing the Era Global Risk Index
The Era Global Risk Index measures the bloodstream of the financial system. It reads 24 structural indicators that have historically preceded major financial dislocations, and outputs a single normalized score from 0 to 100, updated daily as official data publishes.
The index was built on a specific conviction: systemic financial risk is measurable before it becomes visible. The structural data that precedes a crisis is present in the system well in advance of the event itself. What has been absent is a unified framework that aggregates those signals into something interpretable for a real-world investment decision. That is what we built.
What the Index Actually Measures
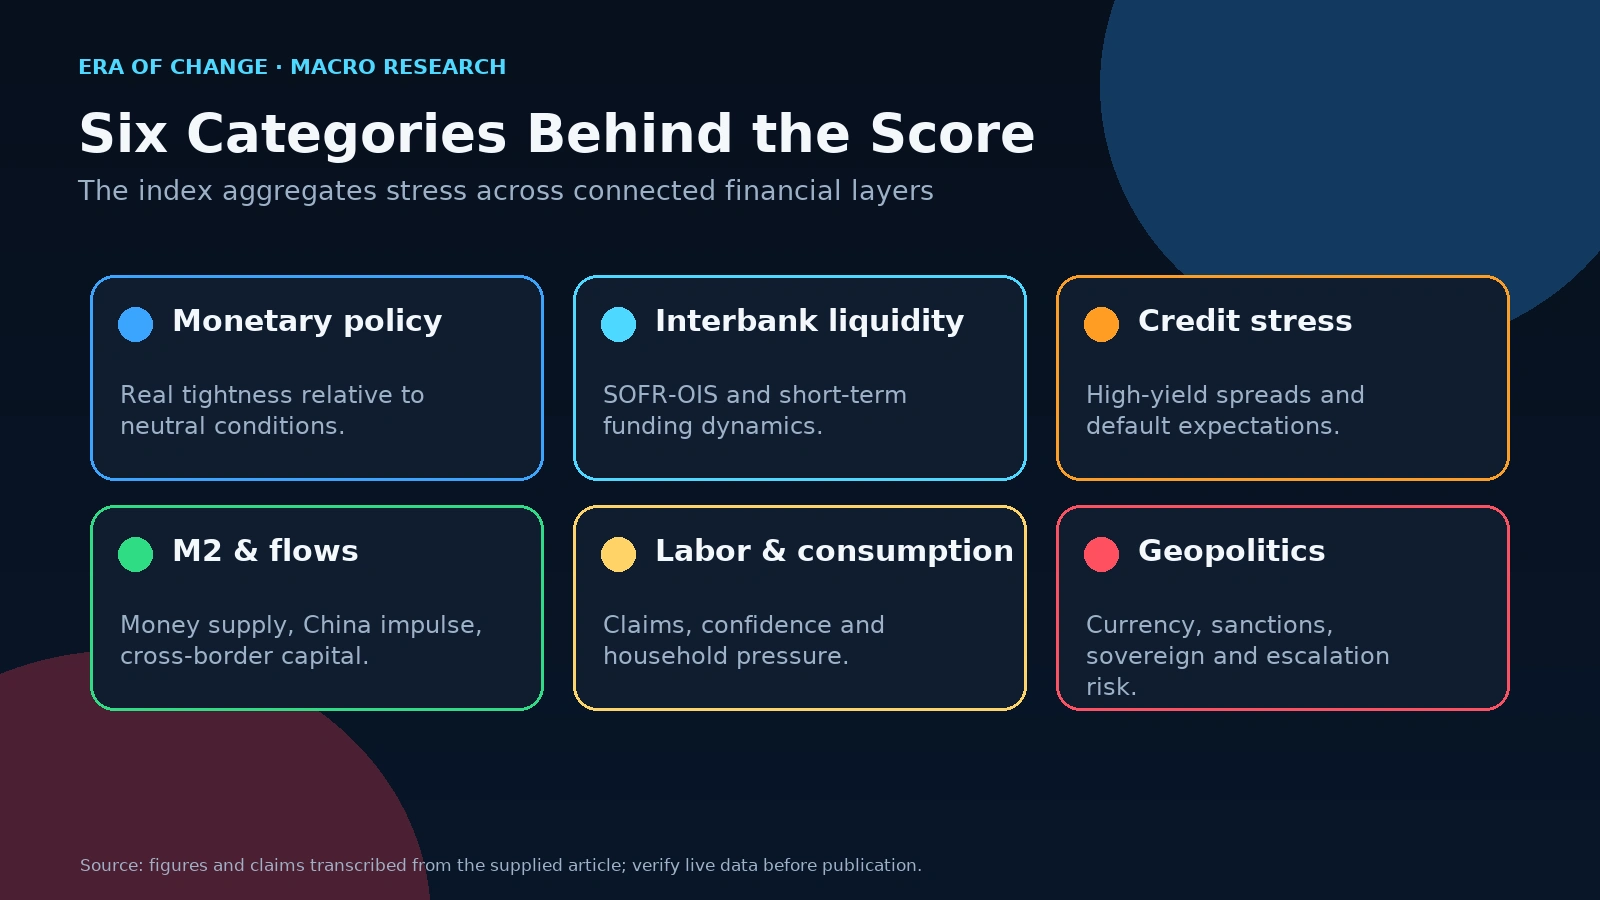
Rather than listing 24 individual data series, let me explain the architecture. We organize the indicators into six structural categories because financial systems don't fail along a single dimension. They fail when stress accumulates across interconnected layers simultaneously.
Monetary Policy Conditions tracks the real tightness of central bank policy, not just the stated rate, but the gap between that rate and what neutral monetary policy would look like given current inflation and output conditions. A Fed that is materially too tight relative to economic conditions compresses credit creation. That compression shows up in the structural data before it shows up in growth numbers.
Interbank Liquidity monitors short-term funding conditions, including SOFR and any separately defined SOFR-OIS series. SOFR is the rate on overnight borrowing collateralized by U.S. Treasury securities; it is a secured repo measure, not a direct measure of banks’ willingness to lend to each other unsecured. The TED spread is a distinct historical measure, defined as the three-month USD LIBOR rate minus the three-month Treasury-bill rate. It widened above 450 basis points in October 2008 and began moving in August 2007; that history illustrates interbank funding stress, not what a SOFR series measures.
Credit Market Stress centers on the ICE BofA US High Yield Option-Adjusted Spread, the premium investors demand to hold sub-investment-grade corporate debt relative to Treasuries. When this spread expands, institutional capital is demanding more compensation for credit risk. That is not sentiment. It is pricing. High yield spreads sat near historic lows through 2024. They have since widened above 5%, a level that has historically coincided with meaningful economic deterioration.
M2 and Capital Flow Dynamics monitors money supply conditions, the China Credit Impulse, and cross-border capital flows. China accounts for roughly one-third of global growth impulse. When its credit impulse contracts, the effect on commodity demand, export economies, and global liquidity filters through the rest of the world on a 9-to-12-month lag. Ignoring this signal means being consistently surprised by macroeconomic developments that were telegraphed months in advance.
Labor and Consumption Pressures incorporates initial jobless claims, consumer confidence data, and leading labor market indicators, the components that reveal whether household balance sheet stress is beginning to compound the macro pressures visible elsewhere in the system.
Geopolitical and Systemic Risk is the final layer. Here we incorporate structural geopolitical dynamics, currency regime stress, sanctions impact modeling, sovereign debt fragility scores, and military escalation data, that do not yet appear in standard economic data but carry meaningful potential for financial shock.
Methodology: How We Build the Score
Each of the 24 indicators is normalized against its historical range and assigned a dynamic weight between 0 and 15 points, calibrated to its current deviation from historical norms and its demonstrated historical correlation with subsequent financial stress events. The weights are not fixed. They adjust as risk concentration shifts across the system's layers.
Data is collected daily immediately after official publications from the Federal Reserve, Treasury, Bureau of Labor Statistics, and equivalent international institutions. An AI-assisted processing layer handles normalization, weight recalibration, and outlier detection. The resulting score is the sum of all weighted indicator readings, expressed as a number between 0 and 100.
We do not publish the full weighting table. Some aspects of our methodology represent years of refinement and constitute the proprietary core of our analytical work. What we commit to and what separates us from frameworks that operate as black boxes is full transparency about the category architecture, data sources, update frequency, and most importantly, the historical back-tested performance of the framework, including its failures.
What Makes Era Different
Most risk tools are built around a single dimension: volatility, sentiment, or economic data in isolation. We combine all of it into one coherent framework. Our architecture deliberately spans macroeconomics, credit conditions, interbank liquidity, geopolitical dynamics, capital flows, and market structure because financial crises are never single-variable events. They are the product of multiple stresses converging.
We also do something almost nobody does in this industry: we publish a monthly Forecast Scoreboard reviewing the accuracy of our prior calls, including the ones we got wrong. Transparency about prediction accuracy is rare precisely because it is uncomfortable. We believe it is the only credible foundation for the kind of analytical trust our subscribers are placing in our work.
The Current Reading: 69 Out of 100
Here is what each zone of the scale means in structural terms.
0–20: Foundations are stable. Liquidity is ample, credit markets function normally, monetary policy is appropriately calibrated. Structural conditions support risk-taking.
20–40: Early-stage stress is building in isolated areas. One or more indicator clusters show deviation from historical norms. Worth monitoring, not yet acting on.
40–60: Material stress is present across multiple categories. The system is absorbing pressure, but its resilience is diminishing. This is the zone where smart capital begins repositioning before the surface shows obvious cracks.
60–80: Structural stress is broad, interconnected, and approaching historically significant levels. The system is in a phase of hidden distribution: markets may appear stable on the surface while institutional capital quietly withdraws from high-risk positions. The reading discussed here is 69 out of 100.
80–100: E.R.A.'s acute-stress zone. The author prioritizes capital protection at this level; the threshold is a framework interpretation, not an independently validated crisis-frequency estimate.
Sustained elevation above 60–65 is the threshold I use as a trigger for transitioning from capital growth orientation to capital protection. The reported reading is above my 60-65 threshold for shifting toward capital protection.
For investors, the practical implication is straightforward: reduce leverage, build cash reserves, implement hedges on broad equity exposure (I favor long-dated put structures on SPY for this purpose) and rotate toward real assets and short-duration fixed income. The objective is not to exit markets entirely. It is to ensure that when the index approaches 80 and panic pricing begins, you have the liquidity to buy, not the accumulated losses that force you to sell.
What History Would Have Looked Like
We have back-tested the framework against three major historical episodes.
September 2008 — Lehman and the Global Financial Crisis. In retrospect, the structural signals were extraordinary in their clarity. From August 2007 onward, fourteen months before the crisis reached its public climax, interbank funding stress was measurable, high yield spreads were widening, and the credit impulse was contracting. This is a retrospective illustration of the framework, not a series of contemporaneously recorded E.R.A. scores for 2008. The VIX, by contrast, spent the first half of 2008 in a range most traders considered elevated but manageable. Two fundamentally different readings of the same environment.
March 2020 — COVID Market Collapse. I want to be honest here: the COVID shock was genuinely exogenous. A health crisis, not a financial system crisis. Our framework, weighted toward structural financial indicators, would have provided meaningful advance warning of pre-existing vulnerabilities but not of the pandemic event itself. Readings were already in the orange zone through early 2020, reflecting tightening credit conditions and late-cycle dynamics, but the index would have spiked sharply in March alongside the event, not weeks before it. Any structural framework has this limitation when confronted with non-financial external shocks.
2022 — Inflation and the Rate Shock. This is the clearest demonstration of the framework's value. M2 had expanded by over 40% between 2020 and early 2022. The monetary policy tightening required to address that expansion and the structural damage it would inflict on bond portfolios, rate-sensitive equities, and leveraged positions was entirely visible in the structural data well before the S&P 500 began its 25% decline. The 2022 example is a retrospective interpretation of the rate shock using E.R.A.'s categories, not a contemporaneous archive of index readings. The damage that followed was not a surprise to anyone watching the structural indicators. It was, unfortunately, a surprise to most people watching the market.
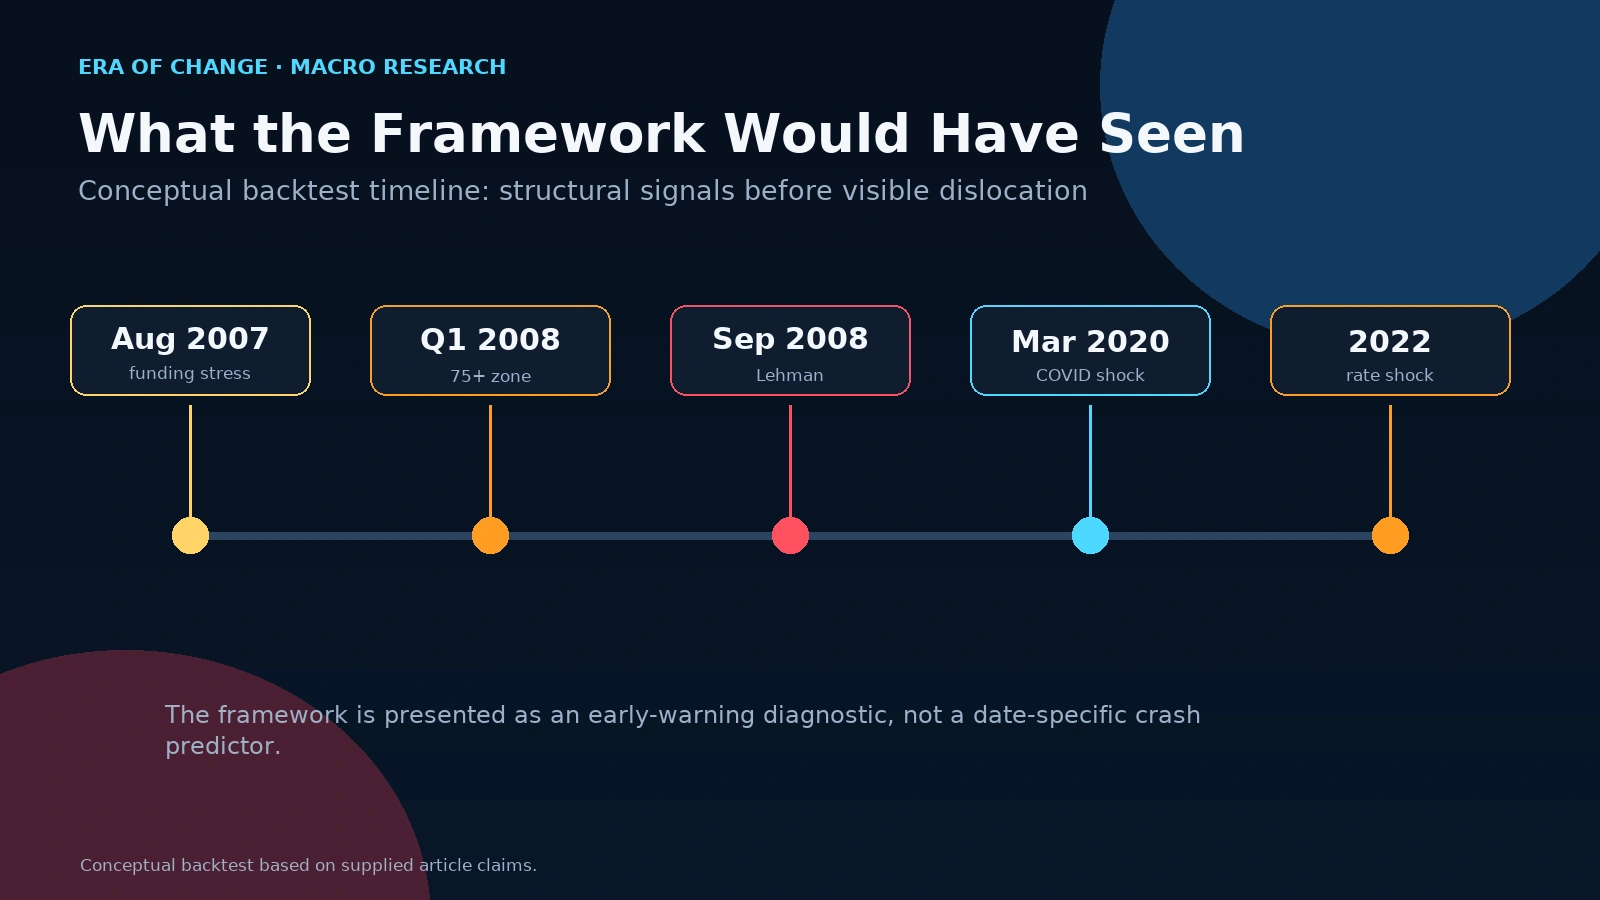
Illustrative retrospective timeline, not a series of contemporaneously recorded E.R.A. scores.
What This Means for Investors Right Now
I'll put a number on it directly. I assess the probability of a significant global financial dislocation within the next 18 months at 65–70%. I hold that view with high confidence, because it is grounded in verifiable data rather than macroeconomic narrative. The cumulative effect of elevated interest rates is compressive and non-linear. It doesn't reveal itself evenly over time, it builds and then releases. M2 growth has stalled.
The China Credit Impulse is signaling below-trend global demand with its characteristic 9-to-12-month lead. Corporate debt refinancing pressure is accelerating into a rate environment that has not meaningfully eased. High yield spreads are telling us that institutional credit pricing has already shifted. The CrisisMeter at 69 is not a prediction of imminent collapse. It is a measurement that the system's structural margin of safety is thinning month by month.
What I underestimated in 2022 and 2023 was the inertia of the American economy. The excess liquidity accumulated during the pandemic years allowed the labor market and consumer spending to absorb high Fed rates far longer than classical macro analysis predicted. That inertia appears to be finally exhausting itself.
The risk I believe is most underpriced in current markets is a partial formalization of gold's role within the global monetary architecture, not a return to Bretton Woods, but an emergency confidence mechanism as faith in the fiat system continues to erode. If China moves aggressively to partially back the yuan with its gold reserves as a direct challenge to dollar hegemony, the shock to currency and sovereign bond markets would be outside the range of scenarios that current institutional positioning accounts for. I watch this risk more closely than anything in my geopolitical category.
What This Index Does NOT Measure
Let me be explicit about the boundaries.
The EraCrisisMeter does not predict tomorrow's S&P 500 price or Bitcoin's next weekly close. It does not score individual companies, sectors, or specific securities. It does not incorporate electoral outcomes or political prediction markets as direct inputs. And it is not a mechanical trading trigger. A reading of 69 does not mean you sell everything today and repurchase at 30. Markets can remain elevated under significant structural stress for extended periods, as the 2022–2023 experience demonstrated.
What it measures is system-wide structural stress: the conditions under which the probability of a major dislocation is meaningfully elevated relative to historical base rates. Think of it as a weather instrument rather than a day-specific forecast. You use it to understand the structural environment you're operating in, not to time individual entries and exits.
Frequently Asked Questions
What is a global risk index, and how does it differ from other risk measures?
A global risk index aggregates multiple structural financial and macroeconomic indicators into a single score representing overall systemic stress. Unlike single-variable measures, VIX for equity volatility, CPI for consumer prices, a composite structural index captures the interaction between multiple risk dimensions simultaneously. That interaction is what generates the non-linear outcomes markets label as "unexpected."
How often is the Era Global Risk Index updated?
Daily. Data is collected immediately following official agency publications from the Federal Reserve, Treasury, Bureau of Labor Statistics, and equivalent international institutions.
Can it predict recessions?
Not with timing precision. E.R.A. interprets readings above 60 as a warning to examine recession risks and portfolio resilience. The score is not a calibrated recession probability or a calendar.
How is it different from the VIX?
The VIX measures 30-day implied volatility in equity options. The EraCrisisMeter measures the structural condition of the financial system across 24 independent indicators spanning credit, liquidity, monetary policy, capital flows, and geopolitics. The VIX can be low during periods of high structural stress as it was throughout most of 2007 and early 2008 and high during volatility events that resolve without systemic consequence. The frameworks answer different questions.
Why isn't sentiment analysis enough?
Sentiment reflects the emotional state of market participants at a given moment. Structural risk reflects the actual condition of the financial plumbing. These can diverge significantly, and they diverge most dramatically in the months preceding major crises, precisely the periods when the gap between sentiment and structural reality is most dangerous to ignore.
How should an investor respond to a rising index reading?
Gradual movement from below 40 toward 60 warrants increasing defensive positioning and monitoring the specific category contributions driving the rise. Sustained readings above 60 suggest active protective measures are warranted. E.R.A. treats readings above 80 as an acute-stress warning; such readings are most informative alongside credit, funding and economic data.
About E.R.A. OF CHANGES
E.R.A. OF CHANGES is an independent macroeconomic research and geopolitical intelligence firm providing institutional-quality analysis to investors worldwide. Our research combines macroeconomics, financial markets, blockchain analytics, and geopolitical risk into proprietary forecasting frameworks designed to identify structural market trends before they become consensus.
The Era Global Risk Index, updated daily from 24 structural indicators, serves as the foundation of our analytical methodology, providing a forward-looking measure of systemic financial stress grounded in structural economic evidence rather than market sentiment. Our full methodology, live index reading, and forecast archive are available at eraperemen.info/en.
Sources
- NBER: The World Uncertainty Index — Ahir, Bloom, Furceri
- BlackRock Investment Institute: Geopolitical Risk Dashboard
- BlackRock: Geopolitical Risk Framework Methodology
- FRED: ICE BofA US High Yield Index Option-Adjusted Spread
- FRED: Secured Overnight Financing Rate (SOFR)
- MacroMicro: China Credit Impulse Index
- Peak Frameworks: VIX Index — Definition and Limitations
- NBER: Business Cycle Dating Committee



