Executive Summary
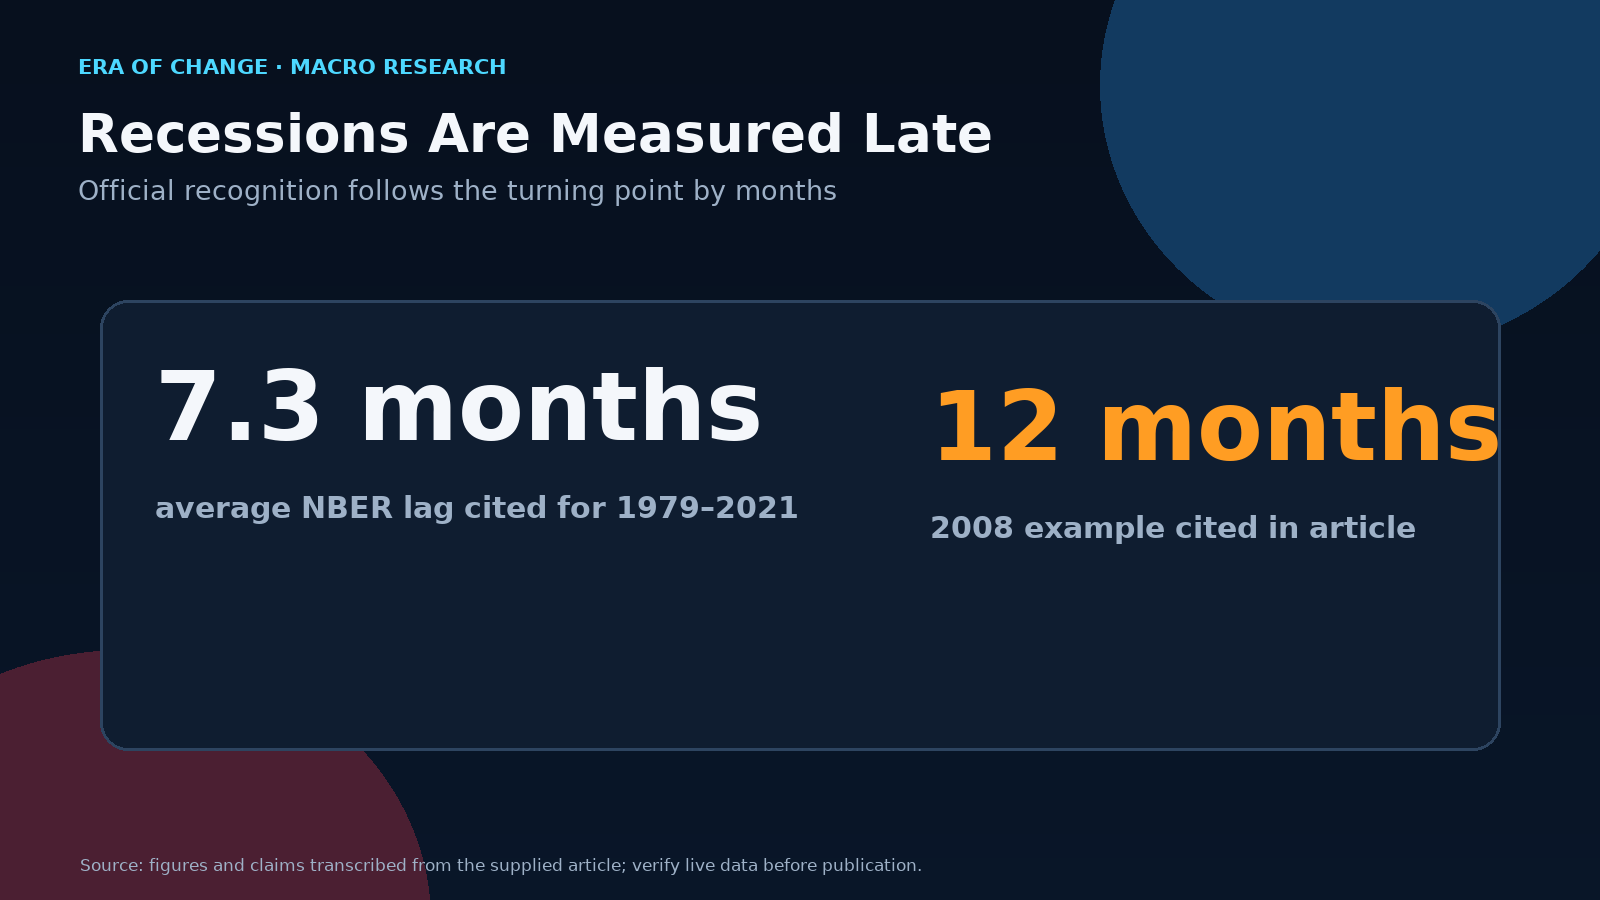
Most investors believe a recession begins when economists officially announce it. That belief is operationally dangerous. By the time the National Bureau of Economic Research publishes its recession declaration, the average lag from the actual economic peak has been 7.3 months and in 2008, it was a full twelve months. Markets do not wait. Institutional capital repositions based on structural leading indicators well before any official announcement arrives.
This article explains what those indicators are, why GDP, the most widely quoted measure of economic health, is a lagging instrument by design, and how E.R.A. OF CHANGES constructs its forward-looking recession probability framework using real-time credit market data, interbank liquidity signals, and labor market dynamics. Understanding this distinction is not academic. It is the difference between positioning ahead of a downturn and becoming, as I see it, a liquidity provider for the institutions that already left.
Introduction
The way most people learn about recessions is through announcement. A government body publishes a report. Financial media covers it. The word "recession" appears in headlines. Official declarations follow. By the time all of that happens, the recession has typically been running for the better part of a year.
This is not a minor timing inconvenience. It is a structural feature of how economic data works, and failing to understand it causes investors to make decisions based on information that describes where the economy was rather than where it is heading.
Let me be direct about the core problem. GDP is the rear-view mirror of macroeconomics. Waiting for it to confirm a recession before repositioning is the equivalent of trying to drive a car by staring at the road already behind you. By the time the data reflects the turn, you have already missed it.
The question professional investors actually ask is not "are we in a recession?" It is: what is the probability that we are moving toward one and what does that probability imply for how I should be positioned right now? Those are different questions. And they require fundamentally different instruments to answer.
What Is a Recession?
The definition most people have learned is clean and simple: two consecutive quarters of negative GDP growth. It travels well in headlines. It is almost universally cited. And it was never designed as a precision analytical tool.
The two-quarter GDP rule is what economists call a "technical recession." It provides a working shorthand for public communication. It is not the standard used by the institution that actually dates US recessions, and it does not capture the full complexity of what an economic contraction involves.
A more precise definition looks like this: a recession is a period of significant decline in economic activity that is broad-based across the economy and lasts more than a few months. It involves simultaneous deterioration in employment, real personal income, industrial production, wholesale and retail sales, and output. GDP is one measure of that broader deterioration, but one measure that arrives late, gets revised repeatedly, and captures only the aggregate monetary value of economic output, not the structural texture of how different parts of the economy are actually functioning.
The 2022 episode illustrates the failure mode clearly. The US economy contracted in both Q1 and Q2 of 2022. Under the two-quarter technical rule, that qualified as a recession. The NBER did not declare one because the labor market remained strong, consumer spending held, and the contraction was too narrow to meet the committee's criteria. The inverse is equally possible: an economy can be formally expanding on a GDP basis while the structural deterioration that will produce a recession is already six to nine months underway. The headline number and the underlying structural reality regularly diverge. Sometimes dramatically.
Who Officially Declares a Recession?
In the United States, recession dating belongs to the NBER's Business Cycle Dating Committee, a body of academic economists who evaluate a range of monthly economic indicators: payroll employment, real personal income excluding transfer payments, real personal consumption expenditure, wholesale and retail sales adjusted for price changes, and industrial production. They look for turning points where economic activity transitions from expansion to contraction, and they date those turning points with as much precision as the available data allows.
What the committee does not do is operate in real time. Their process is explicitly retrospective. They wait until sufficient data are available to eliminate the need for major revisions to the cycle chronology. The result is a lag that has averaged 7.3 months between an economic peak and its official identification across the period from 1979 to 2021.
The 2008 experience is the most instructive. Economic activity peaked in December 2007. The NBER declared the recession twelve months later, in December 2008, a full year after the turning point. By the time that declaration reached the public, Lehman Brothers had already filed for bankruptcy, the S&P 500 had already lost more than 40% of its value, and the credit markets had been in sustained distress for over a year.
The 2020 recession was the exception: the committee declared in June 2020, just four months after the February 2020 peak, made possible by the sudden and categorical nature of the COVID shock. That was the fastest declaration in the committee's history. The rule is still a lag measured in quarters.
Why GDP Is the Rear-View Mirror of the Economy
Even setting aside NBER dating delays, the GDP data itself arrives too late to be actionable as a forward-looking instrument.
The Bureau of Economic Analysis publishes an advance GDP estimate approximately one month after the reference quarter ends. A second estimate follows the month after that. A final estimate arrives one month later. Then annual revisions, benchmark revisions, and comprehensive updates that can materially change the historical picture years after the fact. What this means operationally: if the economy contracted in April, May, and June, the advance GDP estimate for Q2 arrives in late July, three months into the contraction, describing conditions that were already deteriorating half a year earlier, in a preliminary figure that will likely be revised.
This is not a flaw in BEA methodology. It is an inherent property of how aggregate economic statistics are constructed. Comprehensive economic output data cannot be compiled in real time. But that property disqualifies GDP as an early warning instrument entirely, a fact that most retail investors and many professional commentators consistently ignore.
Markets price the future, not the present. Institutional capital does not wait for GDP to confirm what it can already see in the credit markets and the weekly labor data. By the time GDP confirms a recession, the equity market has typically already priced in a substantial portion of the downturn. The investors waiting for official confirmation are not getting better information. They are getting earlier confirmation of something the market concluded months ago. In practice, they become the liquidity that allows institutional capital to exit at better prices.
Why Investors Need Leading Indicators Instead
The shift required here is from retrospective to probabilistic. Instead of asking whether we are technically in a recession today, the more actionable question is: what is the structural probability that the economy is moving toward contraction over the next 12 to 24 months and what evidence supports that estimate?
That reframing changes which instruments matter entirely. Recessions do not begin in shopping malls or employment surveys. They begin in the bloodstream of the economy in debt and capital markets, at the precise point where the cost of funding begins to exceed the returns businesses can generate with that funding. That is where structural deterioration originates, and it is the only place where it becomes visible early enough to act on.
High-Yield Credit Spreads
The ICE BofA US High Yield Option-Adjusted Spread measures the premium that below-investment-grade corporate borrowers must pay relative to US Treasuries to access capital markets. When spreads are tight, credit is available at relatively low cost and risk appetite is strong. When they widen, institutional lenders are demanding more compensation to accept the same credit risk, which tightens financial conditions specifically for the companies most dependent on credit market access: mid-sized businesses, leveraged borrowers, and high-yield issuers.
The historical pattern is consistent enough to treat as a structural feature rather than a coincidence. In mid-2007, high-yield spreads began widening as subprime mortgage stress spread to broader credit conditions. AAA and high-yield spreads represent different rating categories and should not be read as one series. Separately, high-yield spreads later peaked above 2,000 basis points during the crisis. FRED High-Yield OAS. Fourteen months of legible structural warning.
As of Q1 2026, high-yield spreads are running at approximately 470 basis points, a level historically associated with meaningful economic deterioration and materially elevated corporate default risk.
Secured Repo Funding: SOFR and the OIS Basis
The spread between the Secured Overnight Financing Rate and overnight indexed swap rates is one of the cleanest real-time measures of stress in the short-term funding system. When banks are comfortable extending overnight credit to each other, this spread is narrow. When they become cautious about counterparty risk or when dollar liquidity becomes constrained, the spread widens, and funding costs rise across the entire financial system.
The New York Fed defines SOFR as a rate on overnight Treasury-secured repo transactions. It is not an unsecured interbank rate and it is not itself a SOFR-OIS spread. SOFR can inform readers about secured repo funding conditions, but a claim about an elevated SOFR-OIS basis requires the OIS benchmark, tenor, calculation, and source for both components. This indicator should be read alongside credit spreads, not treated as a direct measure of unsecured bank credit risk.
Initial Jobless Claims
Initial jobless claims, the weekly count of new applications for unemployment insurance, published every Thursday morning, are one of the few genuinely high-frequency economic indicators available. Their timeliness makes them valuable in a way that monthly data cannot replicate.
The key is not the absolute level but the rate of change. A slow, sustained rise in initial claims across multiple weeks carries far more signal than a single-week spike. In the weeks through June 2026, initial claims are running around 226,000, contained on a historical basis.
Continuing claims have risen to 1,810,000, the highest in nearly three months. Neither figure is alarming in isolation. But I watch the four-week moving average and its slope more carefully than any individual weekly print. The structural reason unemployment data lags a cycle's onset is that companies reduce hours, freeze hiring, and cut capital expenditure well before they move to layoffs. The acceleration in initial claims tends to come as a cycle matures, not at its inception. The early signal is the first consistent upward inflection in the rate of change.
Money Supply and Credit Creation
M2 and the China Credit Impulse form the monetary layer of our leading indicator framework. When credit creation contracts, whether driven by central bank tightening, declining corporate loan demand, or deterioration in China's credit impulse, which leads global demand conditions by 9 to 12 months, the effect on real economic activity materializes well before it appears in any published economic report. I have covered this in detail in the Era Global Risk Index white paper. The compression in credit creation is invisible in GDP data. It is visible in M2 growth rates, lending surveys, and the China Credit Impulse months before the economic impact lands.
The Yield Curve
The 2-year / 10-year yield curve inversion began in 2022 and returned to positive territory in September 2024, a historically prolonged episode. See our yield-curve explainer. The Cleveland Fed yield-curve model and the New York Fed recession-probability indicator both show elevated but declining recession probability, with the New York Fed currently assigning roughly a 25% probability of recession by November 2026. Moody’s puts the figure at 42%.
The normalization of the curve does not mean the risk is resolved. It means the inversion's predictive window, which historically runs 12 to 24 months forward from the inversion peak, has largely elapsed. The economic impact of the period of inverted yield conditions is not neutralized by normalization. It means the predicted consequence should now materialize, or not, within the window we are currently in.
Era Analyst's Perspective
"What I actually watch is not any individual indicator but the pattern of simultaneous deterioration across multiple structural layers. A single widening in credit spreads is noise. Credit spreads widening alongside pressure in secured repo funding conditions, including SOFR relative to a specified OIS benchmark, while initial claims post their third consecutive weekly increase, that is a pattern, and it is a pattern I take seriously.
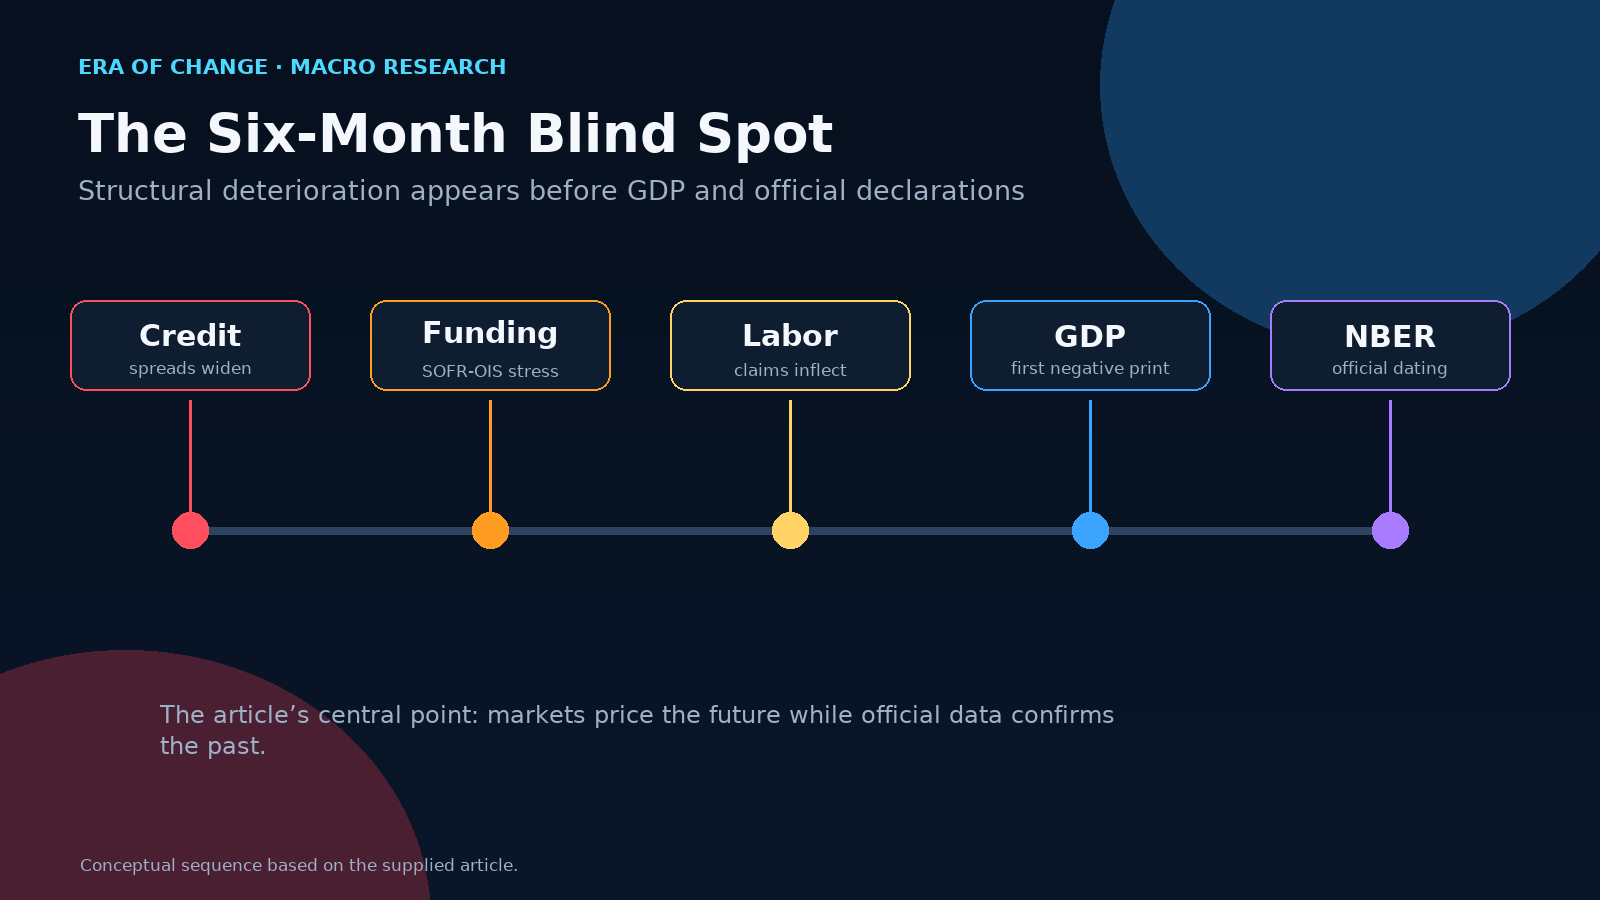
Financial systems fail in the same sequence every cycle. Funding costs exceed business profitability in the debt markets first. Credit availability then contracts. Businesses reduce capital expenditure. Hiring slows. Earnings fall. GDP follows. By the time the GDP print is negative, you have been watching this sequence develop for twelve to eighteen months.
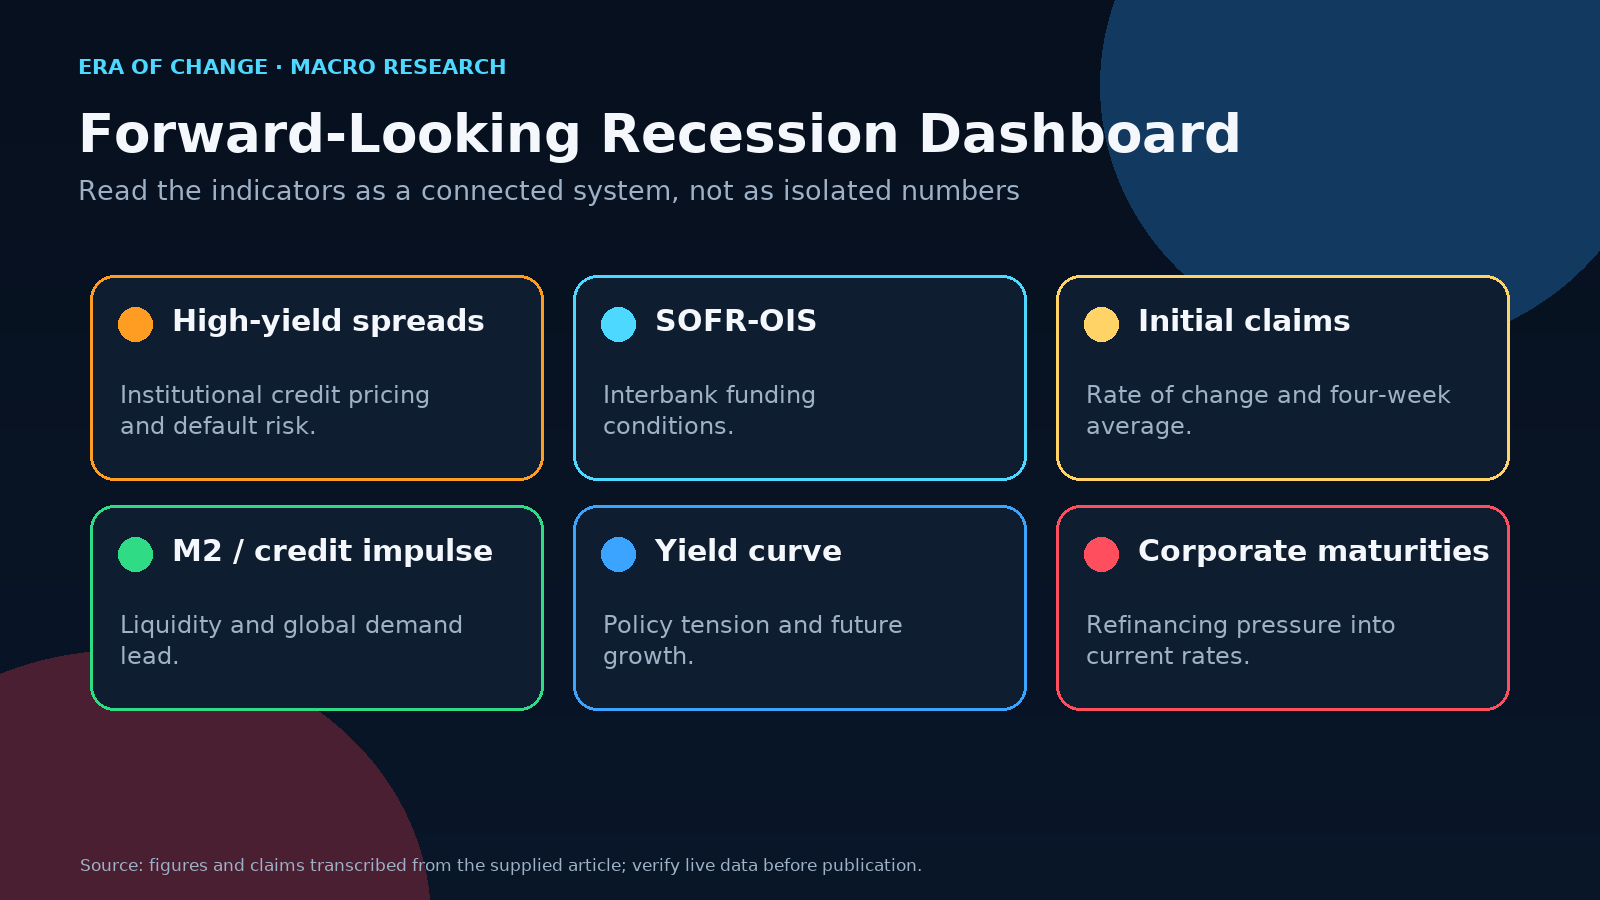
The consistent mistake I see is investors treating these indicators as independent data points rather than as a connected system. The bloodstream of the economy is interconnected. Dollar liquidity conditions determine credit availability, which determines corporate investment decisions, which determines hiring, which determines consumer spending. The sequence is logical and repeatable. What changes from cycle to cycle is the specific trigger that initiates the deterioration at the funding level, not the sequence itself."
The Six-Month Blind Spot
Here is what this lag looks like in operational terms, walked through as a sequence.
Financial indicators begin deteriorating first. Credit spreads widen. Secured repo funding costs rise; this is distinct from unsecured interbank borrowing costs. Companies start missing earnings guidance and quietly reduce capital expenditure, not announcing it, just doing it. The CFO memos go internal.
None of this is visible in published economic data yet. Labor markets then soften at the margins not greatly, but in the four-week moving average of initial claims and in the spread between labor demand and actual hiring. Consumer spending holds for longer than underlying income data justifies, sustained by savings drawdown and revolving credit. GDP holds positive.
Then comes the first negative GDP print, an advance estimate, subject to material revision, arriving one month after a quarter that described conditions already deteriorating six to nine months earlier. The NBER committee, doing its job with appropriate rigor, waits for the data to be definitive. Their average declaration lag is 7.3 months. In 2008, it was twelve.
By the time that official declaration reaches investors, the equity market has already priced the downturn. The institutional capital that was watching credit spreads and funding market dynamics repositioned during the structural deterioration phase. Those waiting for official confirmation are not exercising caution, they are systematically receiving information last and making decisions based on what institutions acted on months earlier. The illusion of normality holds right up until unemployment sharply accelerates and corporate earnings reports start falling like dominoes. Then the announcement arrives, and the investors who needed it confirm their losses.
Can Recessions Actually Be Predicted?
Honestly: no. No model predicts a recession's exact start date. I want to say this clearly because the framing of "recession prediction" implies a precision that rigorous macro analysis cannot deliver and should not claim to.
What structured analysis produces is a probability, an estimate of elevated or declining recession risk over a forward time horizon. That is categorically different from a date. And it demands different behavior in response. A 60% recession probability over the next 18 months does not mean you liquidate everything and move to cash. It means you size positions accordingly, increase hedges proportional to that elevated probability, reduce leverage, and build the defensive capacity to respond if conditions worsen. If the probability fades because credit conditions ease, because the labor data stabilizes, because monetary policy pivots more aggressively than expected, you adjust again.
This is also why accountability about forecast accuracy matters. I publish a monthly Forecast Scoreboard precisely because probabilistic thinking only means something if there is a track record to evaluate it against. A framework that consistently assigns 80% probability to events that occur only 40% of the time is not worth using, regardless of how sophisticated the methodology appears. Transparency about accuracy, including the errors, is the only credible foundation for analytical trust.
How Era Measures Recession Probability
The Era Global Risk Index evaluates structural conditions across six interconnected categories such as monetary policy, credit markets, interbank liquidity, capital flows, labor dynamics, and geopolitical risk and aggregates them into a normalized score from 0 to 100. The current reading of 69 reflects broad-based simultaneous deterioration across multiple categories, not a single flashing indicator.
Monetary conditions remain tighter than the underlying economic trajectory justifies. High-yield spreads have widened materially to approximately 470 basis points. The China Credit Impulse has been contracting on its typical 9-to-12-month forward lead. And corporate debt refinancing pressure is becoming acute: approximately $1.35 trillion in non-financial corporate debt matures in 2026 and needs to be refinanced at rates materially higher than those at which it was originally issued. The companies carrying this debt are not in a position of strength going into that refinancing. That pressure feeds directly back into credit conditions, hiring decisions, and capital expenditure, the same sequence I described above.
None of this is sentiment. It is structural financial reality, legible in the data available today.
The Current Outlook
Base case: I put the probability of a meaningful structural economic slowdown in the US within the next 12 months above 60%. The cumulative compressive weight of the prolonged 2-year/10-year yield curve inversion, which returned to positive territory in September 2024, the corporate refinancing wall, the stalling of M2 growth, and the gradual normalization of labor market slack all point in the same direction. The inertia of the American economy, which I underestimated in 2022 and 2023, when excess pandemic-era liquidity allowed the labor market and consumer spending to absorb high Fed rates far longer than classical macro predicted, appears to be finally exhausting itself.
There is, however, a wildcard that sits entirely outside the framework of financial modeling, and I think it is the most significant single risk in the current environment.
The dominant tail risk right now is not in the credit data or the labor market, it is in the political environment. Donald Trump can announce at any moment that the situation in Iran has escalated to full-scale conflict. If that happens, the current market paradigm ends immediately. A full-scale military confrontation in the Middle East triggers an instant energy price shock, disrupts the logistical arteries of global trade, and produces a sudden and severe resurgence of cost-push inflation. In that scenario, a classical credit-cycle recession transforms into a hard geopolitical crisis, one that requires completely different capital protection strategies.
Short-duration Treasuries do not perform the same way in a stagflationary energy shock as they do in a deflationary credit contraction. Real assets, energy exposure, and inflation-protected instruments move to the front of the defensive positioning framework.
I do not put a precise probability on this scenario because the variable driving it is a political decision rather than a structural economic process. What I can say is that I watch it more closely than anything else in my geopolitical indicator category because it is the one development that can make every quantitative probability estimate in this article irrelevant almost overnight.
What Investors Should Watch Over the Next 12 Months
The most structurally significant indicators to monitor in the current environment are: the four-week moving average of initial jobless claims and whether it sustains upward momentum past 250,000; the ICE BofA High Yield spread and whether current levels around 470 basis points hold or extend further; SOFR, a secured Treasury-repo rate, for funding conditions; any SOFR/OIS basis should be defined by its OIS rate, tenor, calculation, and source; the corporate default rate, which typically lags high-yield spread widening by 9 to 12 months and has not yet reflected current credit conditions; and the China Credit Impulse, which remains the most reliable single leading indicator of global demand conditions at a 9-to-12-month horizon.
What investors should explicitly avoid using as primary recession indicators: headline GDP prints, which arrive too late and get revised too frequently to be actionable; equity index levels, which can remain elevated under significant structural stress for extended periods as 2022 and 2023 demonstrated; and political commentary about the state of the economy, which reflects current narrative rather than structural conditions.
The discipline required is resisting the pull toward the familiar indicators that dominate financial media coverage, and maintaining consistent attention on the structural metrics that have demonstrated historical predictive value, even when those metrics are less convenient to watch and less likely to generate headlines.
Frequently Asked Questions
What is recession probability?
It is a quantitative estimate, expressed as a percentage of the likelihood that the economy enters a recession over a specified forward time horizon. It is derived from structural indicators rather than from current GDP levels, and it is more useful for investment decision-making than a binary recession/no-recession determination.
How is a recession officially measured?
The NBER Business Cycle Dating Committee evaluates multiple monthly indicators such as employment, real income, consumer spending, industrial production, and sales, alongside GDP. The formal standard is a significant, broad-based, and sustained decline in economic activity. The two-consecutive-quarters-of-negative-GDP rule is a colloquial shorthand, not the official criterion.
Who decides when a recession begins?
In the United States, the NBER Business Cycle Dating Committee makes this determination. Their process is retrospective: they wait for sufficient data before publishing a declaration.
What are the most reliable recession indicators?
The structural indicators with the strongest documented leading properties are high-yield credit spreads, liquidity measures including secured repo funding conditions reflected in SOFR and any separately defined SOFR/OIS basis, the rate-of-change trajectory of initial jobless claims, money supply and credit impulse data, and yield curve slope. No single indicator is sufficient. Their predictive value is strongest when multiple indicators deteriorate simultaneously in the structural sequence described above.
Is GDP a leading or lagging indicator?
Lagging. The advance GDP estimate publishes approximately one month after the reference quarter ends, is revised multiple times afterward, and describes economic conditions that were already established months before the report appears.
How long does it take for a recession to be officially recognized?
Between 1979 and 2021, the average lag between an economic peak and the NBER's declaration was 7.3 months. In 2008, it was twelve months. The 2020 recession was an exception at four months, driven by the categorical nature of the COVID shock.
Can recessions be predicted accurately?
No framework predicts exact timing. Rigorous macro analysis produces probabilistic assessments, elevated or declining risk estimates over forward horizons, not precise calendar dates. The appropriate use is calibrating portfolio risk positioning proportional to estimated probability, not making binary in-or-out market calls.
Why do investors monitor credit markets before GDP?
Because credit markets price future economic conditions in real time. When lenders demand higher premiums to accept credit risk, that demand feeds directly back into economic activity by constraining corporate borrowing and investment. Credit markets deteriorate before the economy does. GDP confirms what credit markets have already priced, typically months later.
About E.R.A. OF CHANGES
E.R.A. OF CHANGES is an independent macroeconomic research and geopolitical intelligence firm providing institutional-quality analysis to investors worldwide. Our research combines macroeconomics, financial markets, blockchain analytics, and geopolitical risk into proprietary forecasting frameworks designed to identify structural market trends before they become consensus.
The Era Global Risk Index, updated daily from 24 structural indicators, serves as the foundation of our analytical methodology, providing a forward-looking measure of systemic financial stress grounded in structural economic evidence rather than market sentiment. Our full methodology, live index reading, and forecast archive are available at eraperemen.info/en.
Sources
- NBER: Business Cycle Dating Committee
- NBER: Business Cycle Dating Procedure FAQ
- Newsweek: Calling a Recession — How Long Does It Take?
- BEA: GDP Advance Estimate Q1 2026
- FRED: ICE BofA US High Yield Index Option-Adjusted Spread
- FRED: Initial Claims (ICSA)
- Federal Reserve Bank of New York: SOFR Reference Rates
- Federal Reserve Bank of New York: Yield Curve as a Leading Indicator
- Cleveland Fed: Yield Curve and Predicted GDP Growth
- Third Way: Credit Spreads as Leading Indicators
- MacroMicro: China Credit Impulse Index



