Forecast outcomes and trading results in this review are E.R.A.'s retrospective self-assessment. The percentages summarize the small set of calls described here, not an audited portfolio return or a statistically validated performance record.
Executive Summary
Most forecasting firms in financial markets publish predictions. Very few publish their results. The gap between those two behaviors is exactly the gap between research and marketing and it is why the Era forecast monthly accuracy reviews exist.
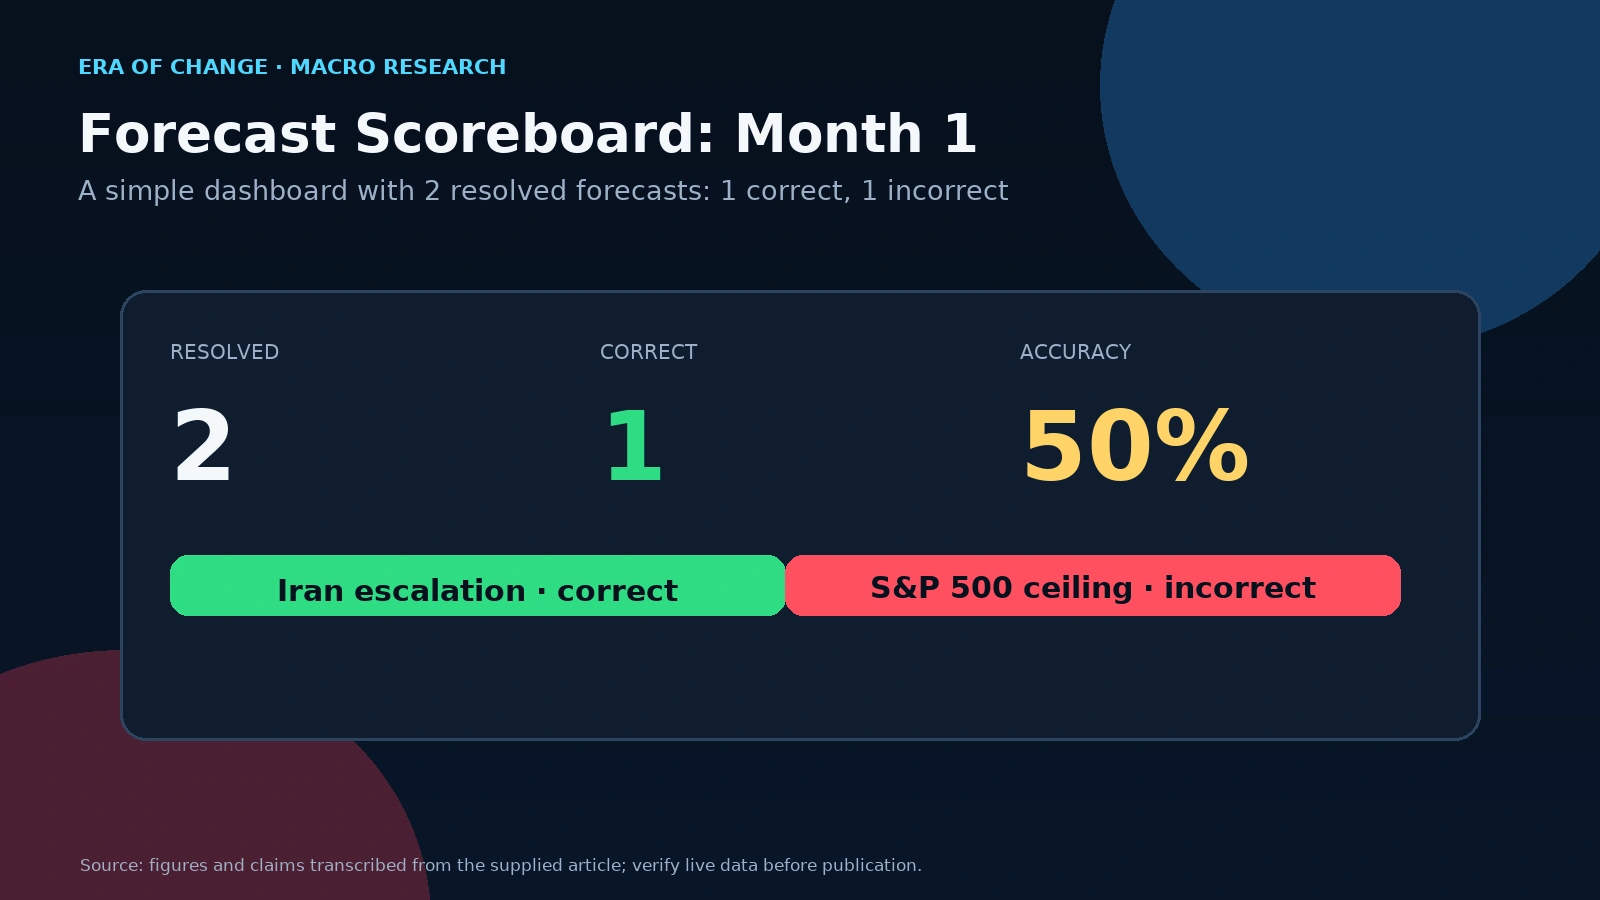
This June review evaluates two earlier E.R.A. forecasts. One was classified as correct in our retrospective review; the other was materially wrong. It also recounts how Nikolai described positioning around them, without presenting that account as an audited portfolio-return record. Both are reviewed here: the reasoning, the outcome, and what the incorrect forecast teaches us about the limits and evolution of our methodology.
The Iran escalation call reviewed here forecast the opening of full-scale hostilities to within a week. In Nikolai’s retrospective account, E.R.A. had taken a directional short on the broad U.S. equity market and a long on oil. Oil surged approximately 55 percent from pre-war levels to near $120 per barrel at its peak, while the broad equity market fell under the energy shock. The account describes the position as profitable but does not provide an entry, exit, sizing, or return calculation; it should not be read as a portfolio-performance claim.
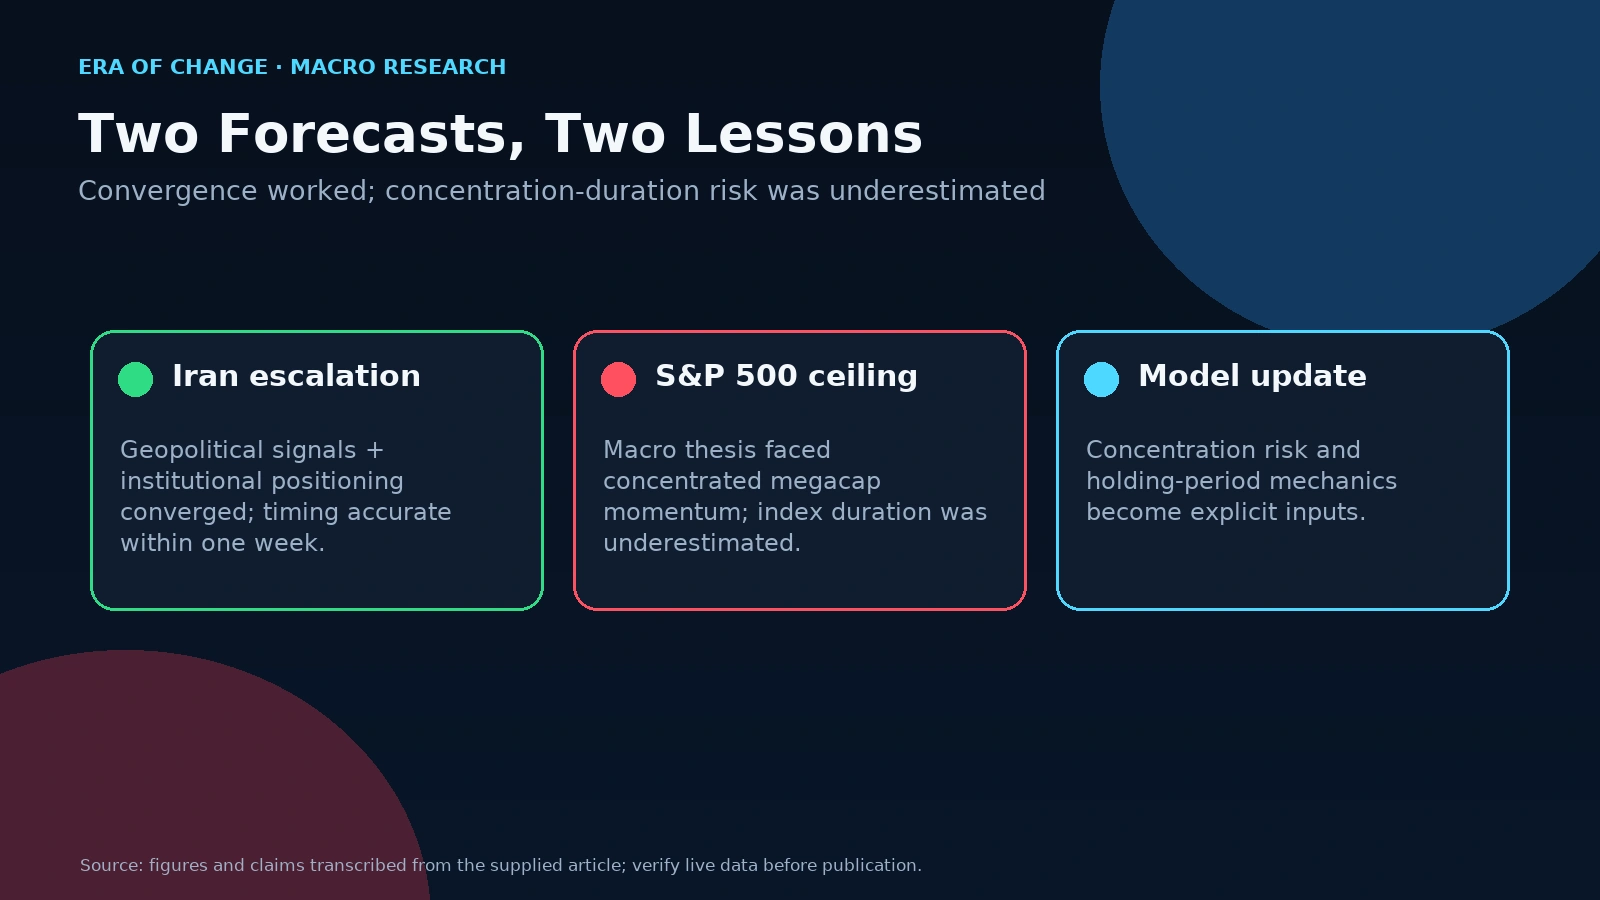
The incorrect forecast was about our tactical assessment of the S&P 500's structural ceiling. We forecast that the index had exhausted its fuel for further gains and would fail to break through the 7,000 to 7,500 technical level. In my account, the market moved above the 7,000 ceiling I expected it to fail at and extended its advance before the geopolitical shock reversed the dynamic. I was wrong about the ceiling and the timing. Our short position on the broad U.S. market absorbed a meaningful drawdown in that window before the geopolitical shock reversed the dynamic. Source. Source 2.
Both of these outcomes, the success and the failure, are documented here in full.
Key Takeaways:
- Every published Era forecast is reviewed publicly, including incorrect calls
- Forecast accuracy matters more than selective success stories
- Successful predictions provide cases for testing the structural methodology; they do not validate its reliability or establish an investment edge.
- Forecasting errors are analyzed to refine future models, not hidden to protect appearances
- Long-term analytical credibility is built on process and accountability, not on cherry-picked results
Introduction: Why We Do This at All
The forecasting industry, broadly defined, has a structural problem that has never been adequately solved and that the industry has very little incentive to solve. The problem is accountability.
Every major investment bank, every macroeconomic research firm, every newsletter, every trading desk publishes forecasts. Year-end price targets for the S&P 500. Probability estimates for recession. Commodity price projections. Currency direction calls. The published record of these forecasts is enormous. The published record of their accuracy is almost nonexistent.
The reason is not difficult to understand.
If you selectively surface your correct calls and quietly bury the incorrect ones, your marketing stays clean. Your subscribers stay confident. Your conversion rate stays healthy. The business model is not built on demonstrating consistent analytical accuracy. It is built on projecting the appearance of it. CXO Advisory's Guru Grades project recorded 46.9% accuracy across its sample of 6,582 public stock-market forecasts. That result describes the project's selection and grading rules, not a universal accuracy rate for professional analysts or a directly comparable benchmark for E.R.A. Source.
An IMF study examining private and public recession forecasts across 63 countries over 22 years found that professional forecasters consistently predicted growth averaging 3 percent in the year before recessions, failing systematically to predict the downturns they were paid to predict. These are not the numbers the industry advertises.
I want Era to operate by a different standard. Not because the moral posture of transparency is appealing in the abstract, though it is, but because I believe it is the only foundation on which serious analytical work can be built and tested over time. The Forecast Scoreboard exists to hold us accountable to a standard we have publicly accepted. Every forecast we publish is added to the record. Every resolution, correct, incorrect, or still developing, is reviewed here each month.
The cumulative record, over years and market cycles, will be the honest answer to whether our methodology has genuine predictive value or whether we are, like most of the industry, engaged in sophisticated-sounding guesswork.
Why Forecast Transparency Matters
I want to say something directly about the part of the forecasting industry that I have no patience for.
There is a substantial segment of market commentary across social media, newsletters, subscription services, and even some institutional research, whose business model is built entirely on the sale of certainty. The pitch is always some version of the same thing: we have a system, a signal, a proprietary model, that identifies opportunities with an unusual hit rate. The case studies presented are always the winners. The sample is always the ones that worked.
The errors, and every analytical process produces errors, without exception, are omitted, buried, or quietly replaced with a new prediction before anyone can notice the previous one failed to resolve.
If someone shows you only their winning trades and hides the losing ones, they are not an analyst. They are selling confidence. And confidence, manufactured from a curated highlight reel, is not analysis. It is one of the most expensive things a serious investor can purchase, because it produces exactly the false sense of edge that gets capital destroyed in the moments that matter most.
The standard I apply to Era's work and to my own is the same standard I would apply if someone pitched me their analytical services. I want the full track record. I want to know not just what they got right, but what they got wrong, when they got it wrong, why they got it wrong, and what they did about it.
Professionals who allocate significant capital understand instinctively that 100 percent accuracy is not a realistic standard. What they are evaluating is process discipline, mathematical edge over a large sample, and the intellectual honesty to learn from errors rather than conceal them. That is the investor we are trying to earn the trust of. And the only way to earn it is to demonstrate, month after month, exactly what we said and exactly what happened.
How We Measure Forecast Accuracy
Before reviewing the month's specific forecasts, it is worth being precise about the evaluation framework because the way you define accuracy determines everything about what the scoreboard actually measures.
We classify each forecast at resolution into one of four categories. A forecast is Correct when the primary directional call and the core logical framework both prove accurate. It is Partially Correct when the directional call is right but the timing, magnitude, or mechanism differs materially from what we specified. It is Incorrect when the primary call does not resolve in the predicted direction within the relevant timeframe, regardless of whether the underlying structural logic eventually proves valid. And it is Still Developing for forecasts whose resolution window has not yet closed.
The distinction between Incorrect and Still Developing matters because I hold some positions that the market has moved against and I do not want to resolve them as correct simply because I still believe the original thesis. A forecast is Incorrect when the outcome within the specified window did not match the call. Whether the structural analysis behind it ultimately proves valid is a separate question, and it gets its own entry in a subsequent scoreboard.
This month, two forecasts reached resolution. One was correct by a considerable margin. One was incorrect, with a meaningful directional loss on the position before subsequent events partially offset it.
Best Forecast of the Month: The Iran Escalation Timeline
The strongest forecast Era published in Month 1 was not the most original call. The thesis that the Middle East was heading toward a major escalation involving Iran was not unique to us in early 2026. Many analysts held that view in general terms. What differentiated our call was its specificity: we did not simply predict that escalation would occur. We calculated a window for the opening of full-scale hostilities, and we were accurate to within one week.
The analytical method that produced this forecast combined two distinct inputs. The first was systematic aggregation of geopolitical markers: the sequence of political decisions, military movements, intelligence signals, and diplomatic breakdowns that our geopolitical risk framework tracks as structural preconditions for conflict escalation.
The second, and arguably more telling, input was the behavior of institutional capital in the commodity and options markets in the weeks leading up to the event. Smart money does not always know the exact date. But when large institutional flows begin positioning aggressively in oil futures, energy infrastructure equities, and volatility products ahead of an event, that positioning is itself a signal, one that frequently carries information content that explicit intelligence sources do not.
When those two streams converged into a coherent picture in late February 2026, the probability assessment crossed the threshold that warranted a concentrated directional position. We took a long on oil and a directional short on the broad U.S. equity index simultaneously, the former as the primary geopolitical return, the latter as both a hedge and an independent directional call on the macro consequence of the energy shock.
The resolution was precise. On February 28, 2026, the U.S.-Israeli coalition launched military operations against Iranian military and nuclear infrastructure, what would become known publicly as "Operation Epic Fury". Brent crude moved immediately: from $71.32 per barrel on February 27 to $77.24 on March 2 an 8 percent jump in seventy-two hours. The move was only beginning.
According to Nikolai's retrospective account, the long position was profitable; the reported gain is not an audited portfolio return. Source.
In Nikolai’s retrospective account, the total position was profitable and provided protection during subsequent market turbulence. The review does not state a verified position-level return or establish portfolio performance.
Why did this forecast succeed? Because it was built on convergence, not conviction. No single indicator produces a reliable call of this specificity. The timing accuracy came from the simultaneous confirmation of geopolitical structural signals and the independent validation of those signals by institutional positioning data. When the pattern across independent data streams lines up with that degree of coherence, the probability estimate shifts materially and the position size should reflect that shift.
Incorrect Forecast About The S&P 500 Ceiling
Now for the part of the forecast accuracy review that matters most to me personally, because it is the part that is genuinely difficult to publish.
The incorrect forecast of the month was my tactical assessment of the S&P 500's structural ceiling. The thesis was straightforward, and the structural logic behind it remains, in my view, sound. The index had been rising in a macro environment characterized by elevated real interest rates, compressing M2 money supply, rising recessionary risk, and a CrisisMeter reading of 69: conditions that historically do not sustain equity multiple expansion.
My forecast was that the market had exhausted its upward fuel and would be unable to break and hold above the 7,000 to 7,500 technical resistance level. The position reflecting that view was a directional short on the broad U.S. equity index.
A contemporaneous market report described a brief move above 7,000, driven in significant part by the Magnificent Seven technology companies, which then represented approximately 34 percent of the index's market capitalization. The market later extended its advance before the Iran escalation reversed the dynamic, producing a meaningful drawdown on my position. Source.
The error was not in the structural analysis. It was in underestimating the specific mechanism through which the market maintained its upward momentum against the structural headwinds I was correctly identifying.
The mechanism was this: the Magnificent Seven, Apple, Alphabet, Amazon, Meta, Microsoft, Nvidia, and Tesla, have become so disproportionately large a share of the S&P 500's total capitalization that the index has effectively ceased to be a broad measure of U.S. corporate health. Nvidia alone commanded approximately 12.7 percent of the index's market capitalization.
By March 9, 2026, the Magnificent Seven collectively accounted for 40 percent of the S&P 500's total weight. This means that the fundamental deterioration I was tracking across 493 other companies in the index was being masked, and numerically overridden, by continued price appreciation in a handful of AI-narrative-driven megacapitalization companies that were not subject to the same rate sensitivity as the broad market.
The lesson is precise: in a market where 40 percent of the index is concentrated in seven companies, a short on the broad index is not a short on the fundamental economy. It is a short on seven specific businesses that are being sustained by flows that have their own momentum, (institutional allocation mandates, index rebalancing mechanics, AI narrative positioning) and that can sustain prices at levels disconnected from macroeconomic gravity for considerably longer than classical analysis would predict.
I knew about the concentration. I modeled it. I underestimated the duration over which irrational momentum in that narrow cohort could override the fundamental pressures I was tracking in the broader system.
What This Incorrect Forecast Teaches Us
I want to be clear about one thing before discussing what I learned: I have not closed the short position. The structural thesis that drove it has not changed, and the subsequent energy shock provided the partial offset I described in the Iran forecast. That outcome is consistent with the framework, but does not by itself validate its reliability. My account records a move above the level I expected to hold, as well as the drawdown on my position. Both are part of my account of the trade. Source.
What I have updated is my model's weighting for index concentration risk. In a market where this degree of megacapitalization dominance is present, a directional short on the broad index must either be structured with a longer duration and a wider stop-loss to survive the momentum period, or it must be implemented through instruments that more precisely target the specific exposures driving the thesis rather than the headline index, which is insulated from those exposures by the mechanical weight of the companies that are not subject to them.
The second thing this forecast reinforces is a principle I have written about in different contexts but clearly did not apply with sufficient rigor here: the market can remain irrational, momentum-driven, and structurally disconnected from underlying fundamentals for longer than position sizing and short-term stop-loss levels can accommodate. Keynes attributed a version of this observation to markets remaining irrational longer than you can remain solvent.
The modern version, in a market where seven companies account for 40 percent of the benchmark index, is that the concentration itself creates a structural momentum force that operates independently of the macro environment affecting the other 60 percent. My model did not adequately price that duration risk. It does now.
How Forecast Accuracy Fits Into the Era Methodology
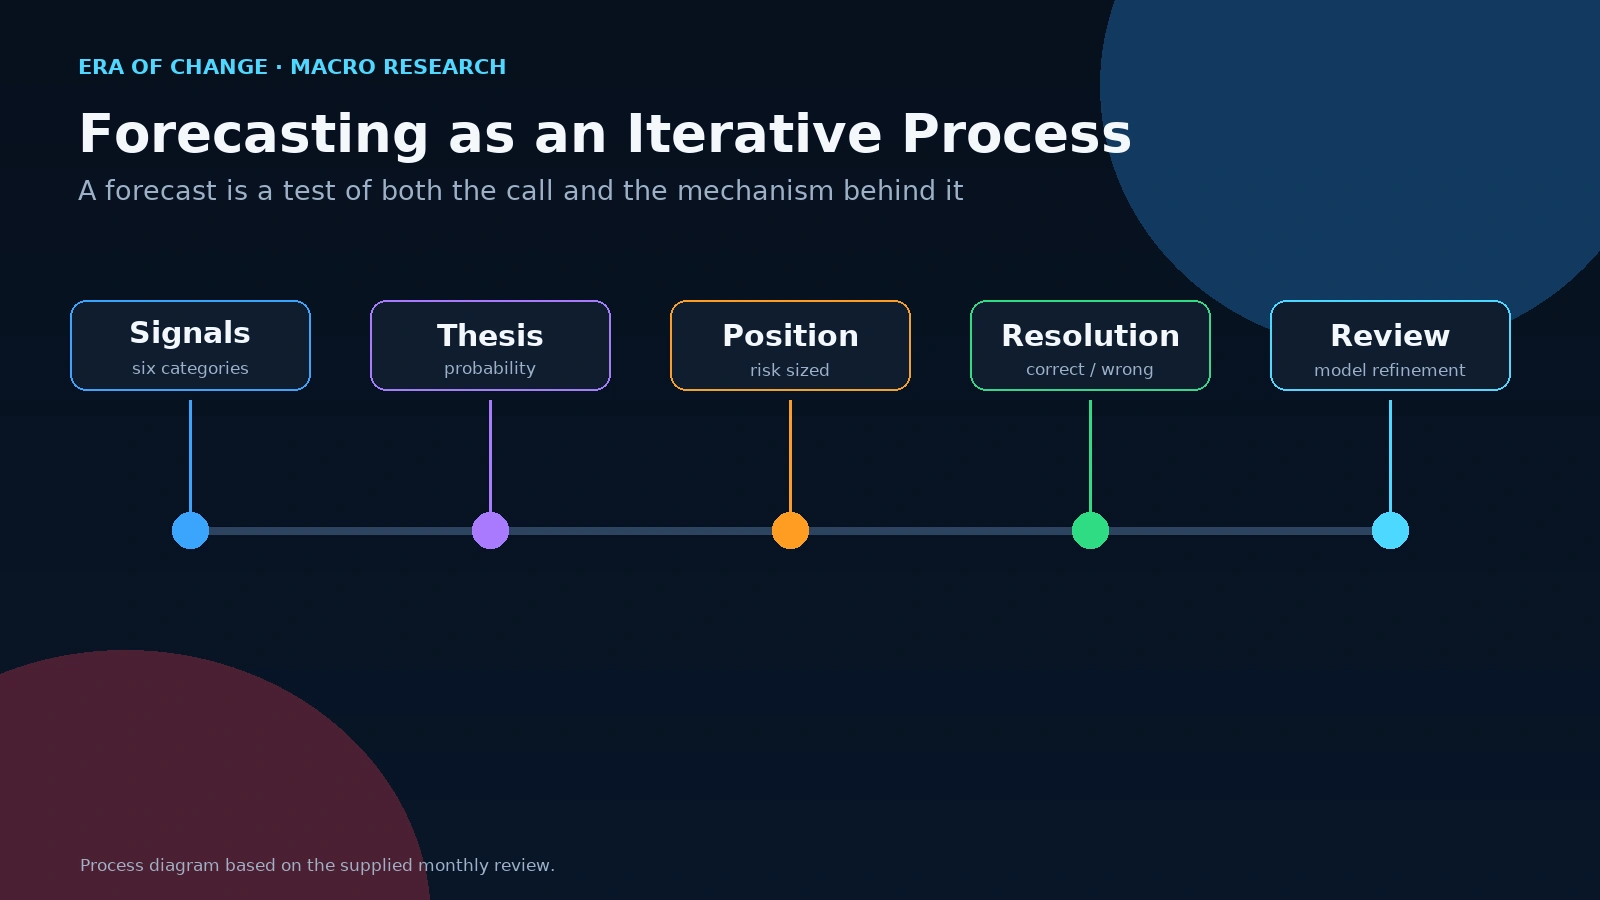
The forecasts reviewed in this scoreboard are not produced by intuition or pattern recognition. They are outputs of a structured analytical framework built around six structural categories: monetary policy conditions, credit market stress, interbank liquidity, capital flows and M2 dynamics, labor and consumption pressures, and geopolitical risk. These are the same categories that compose the Era Global Risk Index and the Era CrisisMeter.
When a forecast is correct, it means that the structural signals those categories were producing provided genuine predictive information about the direction of the market development in question. When a forecast is incorrect, it means either that the structural signals were misleading in this specific context, that an exogenous factor the framework does not adequately model was the dominant driver, or as in the S&P 500 case that the framework correctly identified the structural condition but underestimated a specific market mechanics factor that insulated the headline instrument from that condition.
Each error produces a specific model refinement. The Iran forecast succeeded because we correctly integrated geopolitical structural signals with institutional capital positioning data. The S&P 500 error exposed a gap in how our framework weights index concentration dynamics when modeling directional equity positions. That gap is now addressed. The model that enters Month 2 is different from the model that entered Month 1, in exactly the specific ways that the Month 1 errors revealed.
This iterative process is what makes forecasting a methodology rather than a series of individual guesses. The geopolitical risks we identified in our structural analysis, the Middle East escalation, the resource weaponization dynamics, the payment system fragmentation, are not independent predictions. They are structural observations from the same framework that produces the CrisisMeter reading and drives the forecast positions. When a forecast resolves, it tests not just the specific call but the entire analytical architecture that generated it.
Why No Forecasting System Is Perfect
I want to address this directly, because I think it matters for how subscribers and readers should interpret every scorecard, including this one.
No forecasting system achieves consistent accuracy across all market conditions, all time horizons, and all types of structural events. This is not a limitation unique to Era. It is a fundamental property of complex systems operating under genuine uncertainty. Markets incorporate information continuously, imperfectly, and often with feedback loops that are themselves the result of positioning decisions made in response to prior forecasts. A forecast that is correct becomes, in some measure, the cause of the price movement that confirms it. A widely held forecast that is incorrect can produce violent reversals precisely because the consensus was wrong in the same direction simultaneously.
A disciplined forecasting process aims to improve decisions and make errors visible. Whether E.R.A.'s framework delivers a statistical or investment advantage must be judged from a sufficiently large, consistently scored record. This review alone does not establish positive expected investment returns.
The aim is to evaluate E.R.A.'s forecasts transparently under consistent rules. A small set of resolved forecasts does not establish statistically superior performance, and results from differently graded forecast studies are not directly comparable. Whether we achieve it will be visible in this scoreboard, month by month, across market cycles. That is the commitment.
Cumulative Performance Dashboard
This section will grow as the forecast archive builds. Updated monthly.
| Period | Forecasts Published | Correct | Partially Correct | Incorrect | Still Developing | Accuracy Rate (Resolved) |
| Month 1 | 2 | 1 | 0 | 1 | 0 | 50% |
| Cumulative | 2 | 1 | 0 | 1 | 0 | 50% |
Accuracy rate calculated on resolved forecasts only. Partially correct forecasts are excluded from the accuracy rate numerator.
Era Analyst's Perspective
From Nikolai Fainizky, CEO & Senior Analyst, E.R.A. OF CHANGES
"Publishing the error alongside the success is the part of this work that most analysts in this industry simply will not do. The business reason is obvious if you show only winners, the marketing stays clean. But I find that approach, beyond being dishonest, strategically short-sighted. The professionals who allocate serious capital are not looking for a 100 percent accuracy rate. They know that doesn't exist. What they are looking for is the evidence that the process is real, that the errors are acknowledged and analyzed rather than buried, and that the methodology evolves in response to what the errors reveal rather than staying fixed and hoping no one noticed.
On the S&P 500 short: I was wrong about the technical ceiling and the timing. My account records the market moving beyond the level I expected to hold and advancing before the Iran escalation reversed the picture. Source.
The structural case that the index is being sustained above fair value by a handful of megacap technology companies that represent 40 percent of the benchmark while the underlying economy they are embedded in faces genuine macro deterioration has not changed. The position remains. The model has been updated to account for the duration risk that a 40 percent concentration creates in any instrument that tracks the headline index rather than the structural economy beneath it.
The Iran call was as clean as I have ever produced. But I remember it primarily as a reminder that the best forecasts come from convergence across independent data streams, not from conviction about a single thesis. When the geopolitical structural signals and the institutional positioning data simultaneously confirmed the same picture, the probability assessment crossed the threshold where the position size warranted. That is the discipline I am trying to codify and test publicly over time."
Frequently Asked Questions
How do you measure forecast accuracy?
Each forecast is evaluated at resolution against four criteria: Correct, Partially Correct, Incorrect, or Still Developing. A forecast is Correct when the primary directional call and the core logical framework both prove accurate within the stated timeframe. It is Partially Correct when the directional call is right but the timing or magnitude differs materially from the specification. It is Incorrect when the primary call does not resolve in the predicted direction within the relevant window, regardless of whether the structural logic behind it eventually proves valid on a different timeline. The cumulative accuracy rate is calculated monthly on resolved forecasts only and displayed in the Performance Dashboard above.
Can any forecasting model achieve 100 percent accuracy?
No. This is not a limitation unique to Era. It is a fundamental property of forecasting complex systems under genuine uncertainty. Published accuracy figures depend on the forecast sample, horizon and scoring rules. Our aim is to build a transparent record under consistent criteria, not to claim proven superiority from a small sample. Whether we achieve it is precisely what the Forecast Scoreboard will reveal over time.
How often do you publish forecast accuracy reviews?
Monthly. Each edition reviews all forecasts that reached resolution during the previous four weeks and evaluates them against the criteria above.
What happens when forecasts remain unresolved?
Forecasts classified as Still Developing remain in the active tracking queue and are reviewed each month until they reach resolution. The resolution window is specified at the time the forecast is published. A forecast that resolves correctly on a timeline materially longer than specified is evaluated as Partially Correct rather than Correct, because timing precision is itself a component of analytical value.
How are investment forecasts evaluated?
Era evaluates forecasts on three dimensions simultaneously: directional accuracy (did the primary call prove correct?), framework validity (did the analytical reasoning that generated the call prove sound?), and timing accuracy (did the resolution occur within the specified window?).
A forecast can be directionally correct but structurally wrong, for example, a correct call driven by an unrelated factor rather than the mechanism the analysis identified. That distinction matters for model refinement and is noted in the review where it applies.
About E.R.A. OF CHANGES
E.R.A. OF CHANGES is an independent macroeconomic research and geopolitical intelligence firm providing institutional-quality analysis to investors worldwide. Our research combines macroeconomics, financial markets, blockchain analytics, and geopolitical risk into proprietary forecasting frameworks designed to identify structural market trends before they become consensus.
The Era Global Risk Index, updated daily from 24 structural indicators, serves as the foundation of our analytical methodology, providing a forward-looking measure of systemic financial stress grounded in structural economic evidence rather than market sentiment. Our full methodology, live index reading, and forecast archive are available at eraperemen.info/en.
The content published by E.R.A. OF CHANGES is for informational and educational purposes only and does not constitute financial, investment, legal, or tax advice. All views expressed are the personal analytical perspective of the author. Past forecast accuracy does not guarantee future results. Readers should conduct their own research and consult a qualified financial professional before making any investment decisions.
Sources
- CNBC: A Timeline of How the Iran War Shook Oil Prices — and What Comes Next
- IEA: Oil Market Report — March 2026
- CSIS: The Iran Conflict Is Sending Oil Prices Soaring — What Happens Next?
- Gulf News: Brent Crude Oil Price Spikes to $109 Amid Iran-US-Israel War
- Market Minute: The Tech Tsunami — S&P 500 Hits 7,000 as Tech Concentration Reaches Historic 34%
- Market Minute: The 40% Tipping Point — Magnificent Seven's Record Grip on S&P 500
- MacroMicro: US Magnificent Seven Total Market Cap and Share of S&P 500
- Wealth Management: The (In)Accuracy of Market Forecasts
- Marketplace: How Often Are Economic Forecasts Accurate?
- Congressional Research Service: Iran Conflict and the Strait of Hormuz
- FRED: ICE BofA US High Yield Index Option-Adjusted Spread



