Executive Summary
Most explanations of inflation start and end with monetary policy. Print too much money, get inflation. Raise interest rates, reduce inflation. The mechanism is real. The problem is that it explains cyclical inflation well and structural inflation poorly.
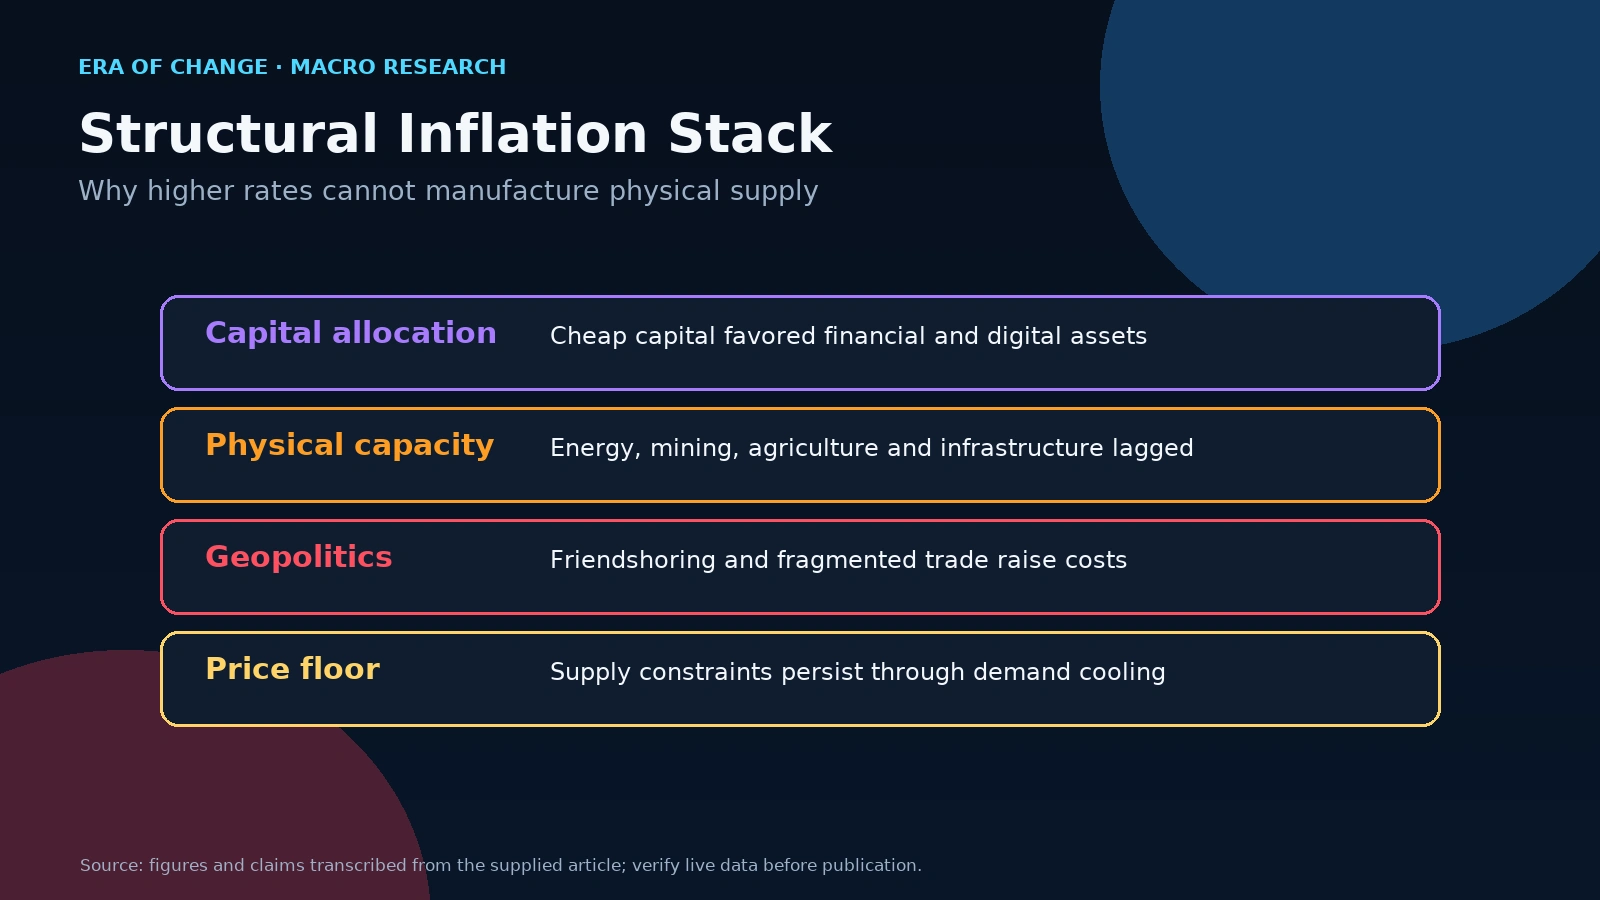
Structural inflation, the kind that refuses to fully retreat even as central banks tighten aggressively, is driven by something different: chronic underinvestment in the physical economy across a decade of cheap capital, accelerating deglobalization, and the hard physical reality that higher interest rates cannot manufacture barrels of oil, tons of copper, or megawatts of electricity. These forces interact to produce inflation with a structural floor that monetary policy alone cannot eliminate.
This article explains the traditional causes of inflation, then examines why today's inflationary environment behaves differently from previous business cycles, how consumer CPI differs from industrial-input and infrastructure investment costs, which can follow different paths and are not directly measured as such in the CPI, and what persistent inflation means for investors who need to position capital today, not wait for a textbook definition to catch up with reality. Source. Source 2.
Understanding the difference between cyclical and structural inflation is not an academic exercise. It determines which assets preserve wealth, which central bank strategies will work, and which economies are building long-term resilience versus burning through their own currency to buy time.
Key Takeaways
- Inflation has multiple causes operating at different timescales: temporary demand shocks are easier to reverse than structural supply constraints.
- Chronic underinvestment in energy, mining, agriculture, and infrastructure during the decade of cheap capital has created lasting supply constraints that interest rate policy cannot resolve.
- A 2023 paper by Tan, Wang, and Yang uses a 163-economy sample and a hybrid Phillips-curve/event-study framework to estimate the inflation effect associated with post-2020 deglobalization. The authors report that CPI inflation and core inflation rose by 1.75% and 1.69%, respectively, on average; these are the paper's model estimates, stated in the authors' terms. Source. Source 2.
- Central banks can reduce demand. They cannot create additional physical supply.
- The CPI tracks consumer price changes; it is not a direct index of industrial input, commodity, or infrastructure investment costs, which may follow different paths.
- Investors in structurally inflationary environments need a different framework than the one designed for cyclical inflation.
Most people learn about inflation the way they learn about recessions: through an announcement. A central bank raises its inflation forecast. A president addresses the country about rising food costs. A newspaper runs the headline that prices haven't climbed this fast since 1981. By the time inflation becomes a political crisis, it has typically been building for years beneath the surface in supply chain fractures, in capital allocation decisions that looked rational at near-zero rates, in geopolitical shifts that nobody wanted to classify as permanent.
The standard explanation of what causes inflation is not wrong. It is incomplete. Money supply, demand overheating, supply shocks. These are real mechanisms, and they explain cyclical inflation reasonably well. What they do not explain is why inflation becomes so difficult to eliminate once it embeds itself into the structure of an economy. That requires a different framework.
I have spent years building and running E.R.A. OF CHANGES's Era Global Risk Index, which tracks 24 structural economic indicators. What I observe there and what most mainstream commentary continues to underweight is that the inflationary episode that began around 2021 is not simply a pandemic-era demand shock that ran hot and is now correcting. It contains a structural component driven by a decade of catastrophic underinvestment in the physical economy that central bank policy alone cannot resolve.
What Is Inflation?
Inflation, at its core, is a broad increase in the price level of goods and services over time, which is another way of saying a decrease in the purchasing power of money. If you earned $100,000 in 2019 and earn $100,000 today, you can buy substantially less with it. That difference is inflation realized in your personal balance sheet.
The most commonly cited measure is the Consumer Price Index, published monthly by the Bureau of Labor Statistics, which tracks the average change in prices paid by urban consumers for a representative basket of goods and services. Core CPI strips out food and energy on the theory that these categories are volatile and obscure the underlying trend. Both measures matter. They also both have significant methodological limitations, which I will come to.
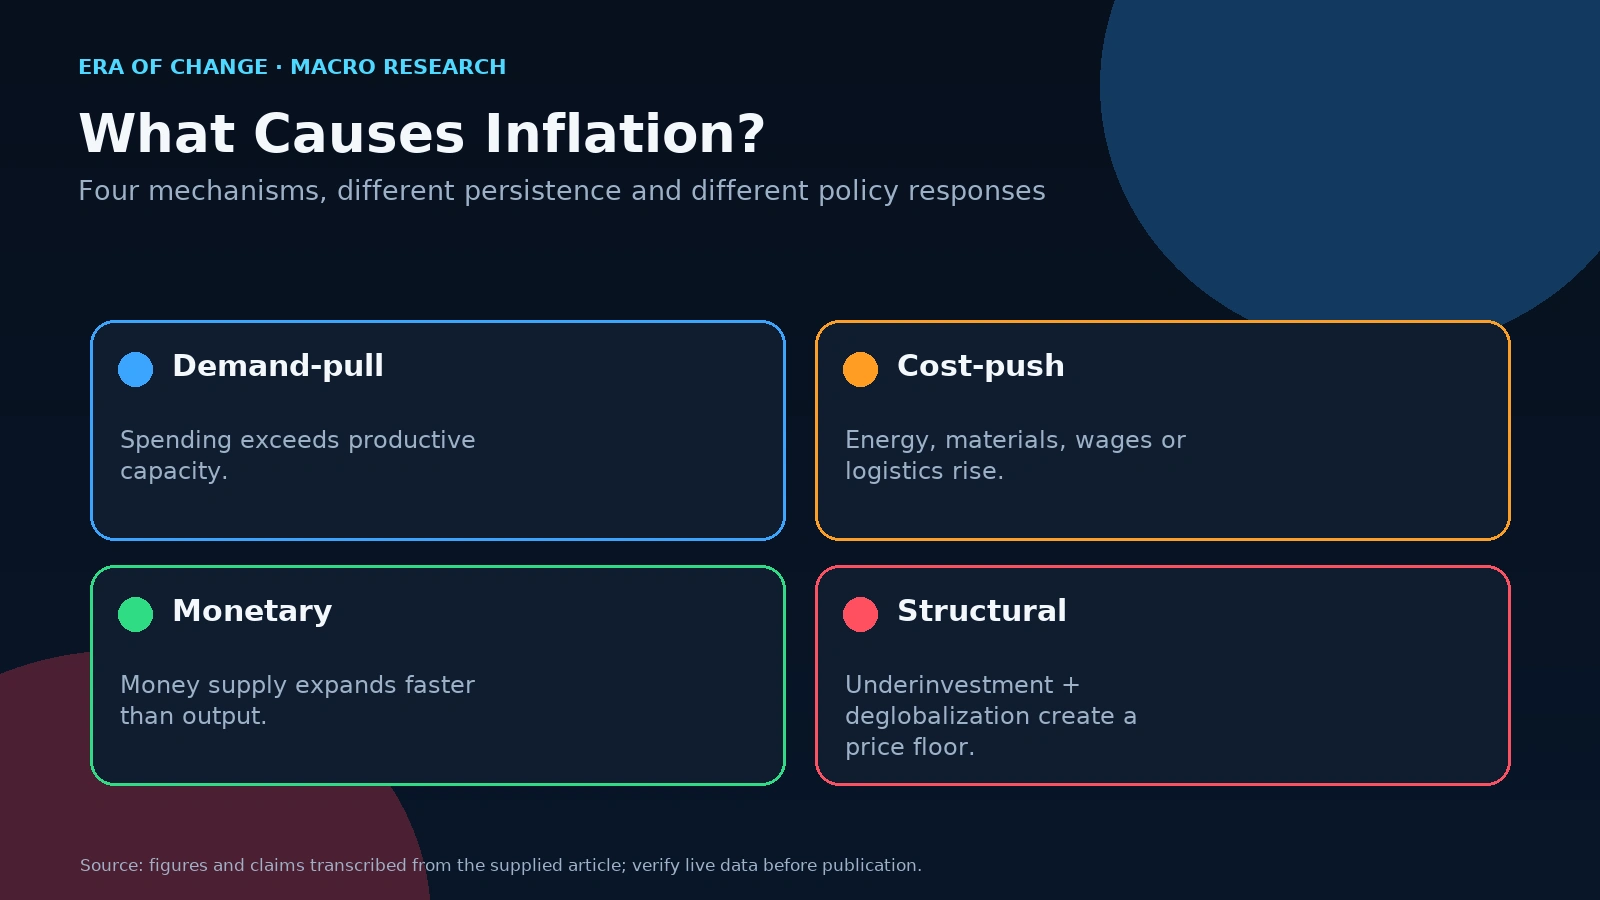
The critical thing to understand about inflation is that it is not a single phenomenon. It can arrive through demand, through supply, through monetary policy, or most durably through structural changes in the productive capacity of an economy. The appropriate policy response depends entirely on which mechanism is driving it, and identifying the wrong mechanism is how central banks find themselves late to the problem.
The Traditional Causes of Inflation
Demand-Pull Inflation
The most intuitive model of inflation is demand-pull: when consumers want more goods and services than the economy can produce, prices rise. The clearest recent example was 2021, when fiscal stimulus packages flooded household balance sheets with cash, pandemic savings were released into spending, and manufacturing capacity was simultaneously constrained by supply chain disruptions. Demand surged. Supply could not keep pace. Prices rose.
This type of inflation is, in principle, manageable. When demand cools through tighter monetary policy, the natural exhaustion of savings, or gradual supply chain normalization, prices stabilize. The Fed's rate hike cycle beginning in March 2022 was designed precisely for this mechanism.
Cost-Push Inflation
Cost-push inflation arrives from the supply side. When the cost of producing goods increases through higher energy prices, elevated raw material costs, rising wages, or disrupted logistics, businesses pass those costs forward. The 2022 energy shock following Russia's invasion of Ukraine is the textbook illustration: European natural gas prices spiked above €300 per megawatt-hour in August 2022, and the cost of manufacturing, heating, and transportation across the continent rose with them.
Cost-push inflation is more resistant to monetary tightening than demand-pull, because interest rates cannot directly reduce the cost of gas. They can reduce demand for gas, which may eventually lower prices, but the transmission mechanism is slower, more indirect, and often incomplete.
Monetary Inflation
The third mechanism, the one most cited by market monetarists, is monetary inflation: when the supply of money grows faster than the productive capacity of the economy, each unit of currency buys less. The connection between M2 money supply growth and inflation is real, though the relationship is not mechanical. Timing, velocity, and the structure of credit markets all affect how and when monetary expansion translates into price increases.
The $6 trillion in pandemic-era fiscal and monetary stimulus in the United States, combined with the Fed's near-zero rate policy held from 2020 to 2022, created a powerful monetary impulse. Understanding how that impulse interacted with structural supply constraints is critical to understanding why inflation proved so much more persistent than the Fed initially projected.
Why Inflation Has Become More Structural
Traditional economics explains cyclical inflation well. Structural inflation requires a different framework. I want to be precise about what I mean by structural because this is where mainstream analysis systematically underweights the evidence.
Chronic Underinvestment in the Real Economy
For approximately a decade following the 2008 financial crisis, the developed world lived in a regime of near-zero interest rates and abundant cheap capital. That capital did not flow evenly. It flooded into technology, financial speculation, and startups that in many cases had negative unit economics by design. It did not flow in anything close to adequate volumes into geological exploration, industrial metals mining, oil and gas development, or agricultural infrastructure.
The numbers illustrate the distortion. The world's top 20 mining companies' combined capital expenditure reached $79.4 billion in 2025, up from $73.6 billion in 2024. The growth looks significant until analysts examine what it actually represents: much of the increase reflects the inflation of capital costs themselves, higher equipment prices, elevated steel and energy inputs, rather than real expansion of productive capacity. According to reporting from Mining Technology, a substantial portion of current mining capex is maintenance-driven, sustaining existing output rather than creating new supply.
The physical world cannot be scaled the way software can. You cannot iterate a copper mine in six weeks. A deepwater oil platform takes years from discovery to first production. A fertilizer plant requires sustained investment in infrastructure, permitting, and logistics before the first ton ships. When the capital was being allocated to yet another generation of negative-margin consumer apps, nobody was building the physical capacity the global economy would later need. No interest rate hike in the world can print a barrel of oil or a ton of copper. That is the constraint the Fed has been working against.
Deglobalization and the Mathematics of Friendshoring
The second structural driver is one that gets framed as a geopolitical story and it is, but it is also a pure cost arithmetic story. Globalization's great contribution to price stability was not simply cheap labor. It was the optimization of supply chains across the lowest-cost geography for each production step: Chinese manufacturing, Southeast Asian assembly, Brazilian soy, Middle Eastern oil. That system generated continuous deflationary pressure on goods prices for three decades.
That system is now partially unwinding. Friendshoring, relocating production to politically allied countries and reshoring, bringing production back to the home market, both generate higher costs by definition. A 2023 study by Tan, Wang, and Yang in China Finance and Economic Review uses a 163-economy sample and reports that deglobalization since 2020 raised CPI inflation and core inflation by 1.75% and 1.69%, respectively, on average. The authors estimate these effects using a hybrid Phillips-curve and event-study framework. That is not a rounding error. That is a structural addition to the global price level that compounds forward, and it has nothing to do with whether the Fed moved by 25 or 50 basis points. Source.
Four structural forces relevant to this discussion are deglobalization, debt, demographics, and digital transformation. Deglobalization may be more than a temporary supply-chain disruption; it can rewire global production and raise costs.
Physical Supply Cannot Be Printed
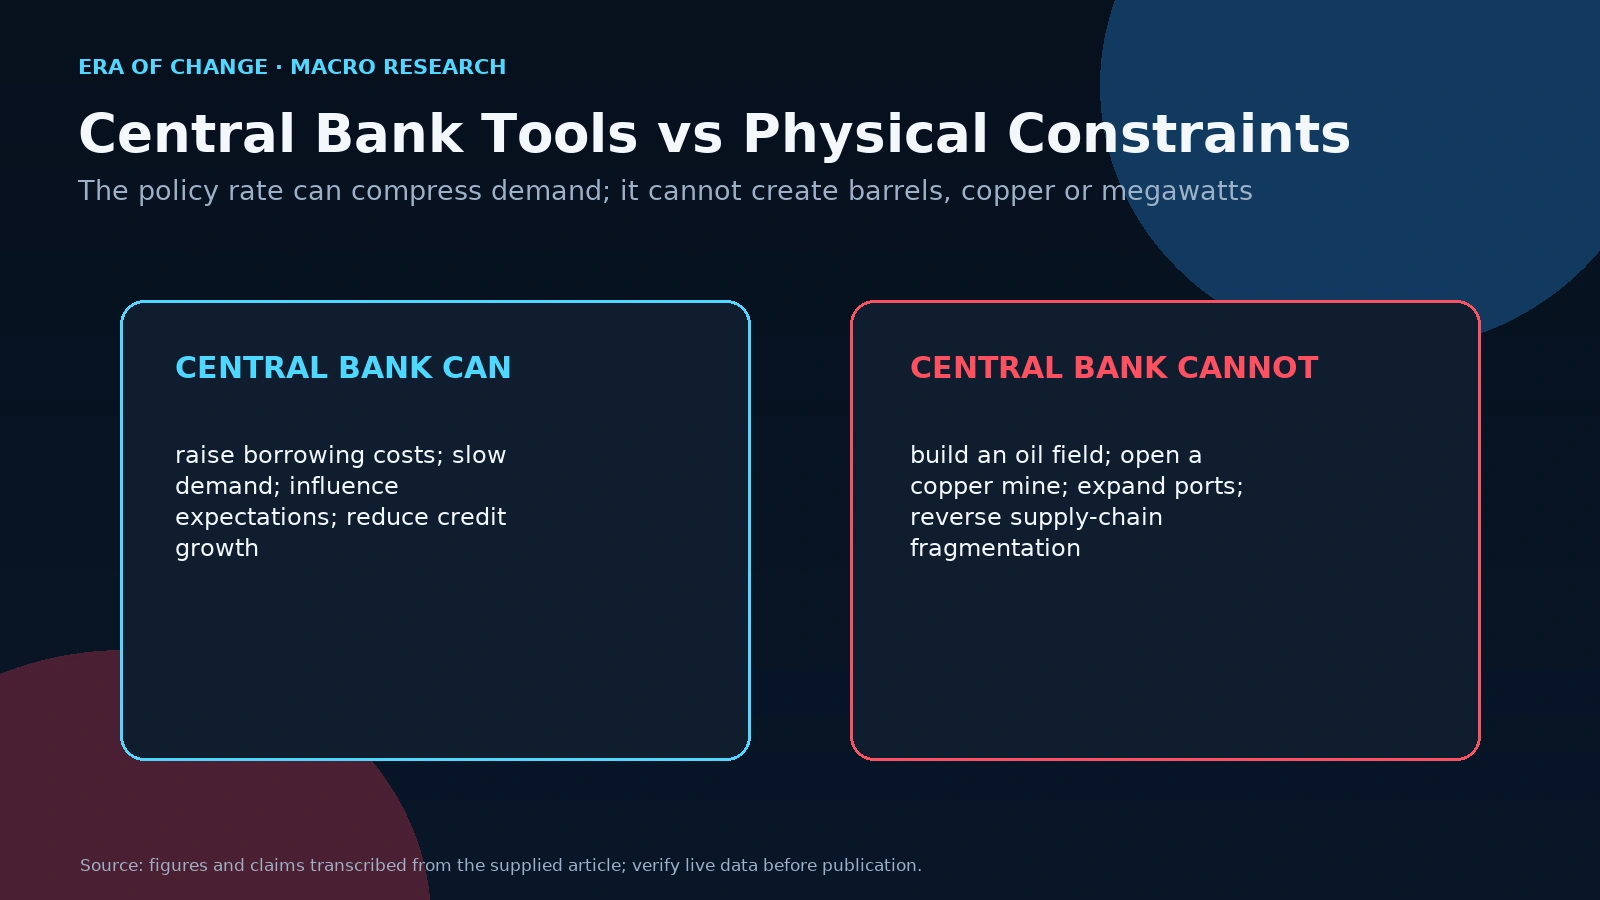
This is the idea I keep returning to, because it cuts through much of the noise around monetary policy. Central banks are powerful institutions. They can raise the cost of borrowing. They can reduce nominal demand. They can shape expectations. What they cannot do is increase the supply of energy, metals, or food by adjusting a policy rate.
The bloodstream of the economy, the credit and commodity markets that keep industrial production moving, ultimately runs on physical inputs. Monetary tightening can slow inflation by crushing demand enough that reduced consumption offsets the supply constraint. But "crushing demand" is the mechanism. It is not elegant, and it is not free. The costs show up in unemployment, slowed investment, and reduced productive capacity. When structural supply constraints are the underlying cause of inflation, the choice facing central banks is essentially: accept some structural inflation, or eliminate enough demand to offset it. That is a much harder problem than the models were designed to solve.
Why CPI Doesn't Tell the Whole Story
Official CPI data is the most widely cited measure of inflation, and it is reasonably accurate for what it measures. The problem is that what it measures is not a complete picture of the cost pressures bearing on the productive economy.
CPI is constructed using a basket of goods and services that is periodically updated to reflect typical consumer spending patterns. Two methods are worth distinguishing. Hedonic adjustment separates estimated quality change from pure price change when a sampled product is replaced. A 2025 research paper by Ehrlich and coauthors reports, based on BLS data, that hedonic methods were used for about 7.5% of goods and commodities in the CPI; this is a research estimate, not a permanent BLS target. Research paper. Separately, the CPI-U’s geometric-mean formula allows for modest substitution within many item categories, but does not assume consumers switch across categories from beef to chicken. The chained CPI (C-CPI-U) is designed to account for substitution between categories. BLS explanation of CPI substitution methods.
Both adjustments have legitimate economic rationales. The issue is that neither captures what is happening at the infrastructure and commodity level, the cost of electricity, industrial raw materials, logistics, and capital-intensive production. At that level, there is no hedonically adjusted copper. There is no cheaper substitute for the energy required to run a steel mill. The real cost inflation at the base of the productive economy in the inputs that everything else depends on is structural, sustained, and not fully reflected in the headline number that drives most policy decisions and media coverage.
This is not a conspiracy. It is a measurement gap. Investors who anchor their real return expectations to CPI as a complete measure of purchasing power erosion will systematically underestimate what they need to earn to stay ahead of it.
Era Analyst's Perspective
The debate about whether we are in a temporary or permanent inflationary regime misses what I consider the more important question: which parts of the economy face structural price floors regardless of what central banks do, and which parts are genuinely cyclical?
When I examine the Era Global Risk Index, the signals I monitor most closely are not CPI prints. They are capital expenditure trends in energy and industrial metals, the trajectory of real commodity prices adjusted for currency moves, and the spread dynamics in credit markets that indicate whether the corporate sector can absorb cost pressures without a significant default cycle.
Here is the uncomfortable reality that the Bank of Japan illustrates. The BOJ spent a decade and a half holding 10-year Japanese government bond yields artificially suppressed through Yield Curve Control. By the time they began normalizing in March 2024, Japan's gross government debt had reached approximately 260% of GDP, a level at which conventional normalization risks triggering a debt servicing crisis. What the BOJ chose instead was a managed currency devaluation. USD/JPY moved from roughly 110 in late 2021 to above 157 by mid-2024. That is not a policy success. That is a central bank that ran out of good options and is managing the least bad one available.
The lesson for investors is straightforward. When a central bank is structurally constrained from raising rates by the size of its own debt market, you do not hold that country's long-term bonds. You hold the real assets that survive the currency devaluation that replaces interest rate normalization.
Can Central Banks Really Stop Inflation?
The honest answer: they can reduce it significantly, but they cannot always eliminate it, and the cost of forcing it all the way to target is not always worth what it destroys.
Higher interest rates work by increasing the cost of borrowing, which reduces consumer spending, business investment, and credit growth. Compressed demand eventually lowers prices. The mechanism is real. The Fed's rate hike cycle from March 2022 to July 2023, which took the federal funds rate from near zero to 5.25–5.50%, did materially cool the demand-pull and monetary components of the 2021–2022 inflation surge.
What it could not do was increase the supply of housing in cities with restrictive zoning laws. It could not accelerate the permitting and construction of new energy infrastructure. It could not resolve labor market tightness driven by the demographic retirement wave of the baby boomer generation, a trend with nothing to do with the cost of borrowing. These are structural constraints. Monetary policy can work around them by suppressing demand enough to offset them. But suppressing demand means suppressing economic activity, and there is a limit to how far that can proceed before the political costs become unacceptable.
The honest assessment is that monetary policy is a powerful demand-side instrument deployed against an inflation that has significant supply-side drivers. It works. It just does not work as cleanly, or as completely, as the standard models project.
Lessons From Around the World
Japan: What Capitulation Looks Like
The Bank of Japan formally ended its Negative Interest Rate Policy on March 19, 2024, and simultaneously abandoned the Yield Curve Control framework it had maintained since 2016. The financial press covered this as the BOJ finally normalizing policy in line with global peers.
Less discussed is why normalization took so long, and what it cost. With Japan's government debt at roughly 260% of GDP, raising interest rates to conventional levels would dramatically increase debt servicing costs to a point that becomes impossible to finance. The BOJ was not running an eccentric monetary experiment. It was managing an existential arithmetic problem.
The outcome, a currency that lost roughly 40% of its value against the dollar between 2021 and 2024, is what the avoidance of rate normalization actually costs. It does not show up in a policy rate announcement. It shows up in the price of every Japanese import, in the purchasing power of Japanese households, and in the quiet destruction of savings held in yen.
This is what central bank capitulation on structural inflation looks like. Not a press conference. A currency chart.
Emerging Markets: Acting Before the Textbook Required It
The counterexample is instructive. Brazil's Comitê de Política Monetária began raising the Selic rate in March 2021, a full year before the Federal Reserve moved. By August 2022, the Selic had reached 13.75%, where it remained through much of 2023. The Bank of Russia moved similarly decisively, raising its key rate to 20% in early 2022 under extraordinary sanctions pressure, and returning to aggressive tightening cycles as structural cost pressures persisted with rates reaching 21% by late 2024.
Neither of these central banks has the luxury of the world's reserve currency as a buffer. They could not verbally intervene their way through an inflation crisis. They had to act, and act before the consensus had confirmed the problem, because the cost of being wrong was the destruction of their currency and the savings of their population. The Fed speaks; the world adjusts its dollar-denominated portfolios. An emerging market central bank speaks; if nobody believes it, the currency absorbs the signal immediately.
The lesson is not that emerging market monetary policy is inherently superior. The lesson is that the absence of reserve currency privilege forces clarity. You either defend the purchasing power of your currency with real interest rates, or you watch your currency absorb the inflation that policy refuses to address.
What Persistent Inflation Means for Investors
I want to be careful here, because this section describes structural logic, not investment recommendations. The suitability of any position depends on circumstances. I cannot know the time horizon, liquidity needs, existing exposure, leverage tolerance.
Pricing Power
In a structurally inflationary environment, the distinction that matters most in equities is not growth versus value. It is pricing power versus no pricing power. A company that can raise prices as input costs rise because its product has no close substitute, or because it controls critical infrastructure, or because its brand commands pricing premium can sustain real margins through inflation. A company that cannot raise prices because its customers have alternatives will see its real profitability eroded. When screening for equity exposure in a structural cost inflation environment, this distinction is the primary filter.
Real Assets
Gold, physical commodity exposure, energy, and agricultural assets are not inflation trades in the short-term speculative sense. They are real asset exposure: things that cannot be printed. The structural case for real assets during inflationary periods is not sentiment-driven. It is the observation that when the purchasing power of money declines, assets whose supply is physically constrained tend to maintain or appreciate in real terms. The Era CrisisMeter monitors commodity price trends as one of its structural stress inputs for exactly this reason.
Global Diversification and Capital Extraterritoriality
Currency risk is often the invisible exposure in an inflationary environment. An investor whose wealth is concentrated in a single currency has implicitly made a bet on the monetary competence and the structural freedom of the central bank that manages it. I have applied this framework personally, across years of managing capital in jurisdictions where fiat devaluation is not an abstract risk but a recurring operational reality.
The logical response is capital that does not live entirely within any single jurisdiction's reach: assets held at international custodians like Interactive Brokers, distributed across dollar-denominated instruments that generate real returns independent of any single central bank's decisions. In environments of acute local-currency devaluation, dollar-pegged stablecoins such as USDT and USDC may provide convenient, short-term nominal exposure to the U.S. dollar between transactions for people who cannot easily maintain offshore brokerage access. They are crypto assets, not bank deposits or dollar accounts; their peg, redemption and custody depend on the relevant issuer and intermediaries, and they do not guarantee purchasing power in real terms. Source. Source 2.
Geographic and currency diversification is not aggression. It is recognition that no single jurisdiction has a monopoly on sound monetary policy.
Fixed-Rate Debt in Inflationary Environments
This is the concept that surprises most people, and I will describe the economic mechanism precisely. When real inflation exceeds the interest rate on a fixed-rate loan, meaning the borrower pays less in real terms than the rate of purchasing power depreciation, the real burden of that debt is being eroded by inflation. In jurisdictions where this condition persists, fixed-rate borrowing to acquire real assets means the debt becomes structurally easier to service over time while the real asset maintains or increases its value. I have applied this logic in managing capital across high-inflation jurisdictions.
I want to be unambiguous: this mechanism also amplifies risk. Leverage works symmetrically. If the asset falls in value, or rates rise sharply, the arithmetic reverses with equal force. This is a structural observation about how inflationary environments redistribute wealth between borrowers and lenders, not advice for any individual to take on leverage.
How Era Measures Inflation Risk
At E.R.A. OF CHANGES, we do not treat CPI prints as the primary input to our inflation analysis. CPI is the rear-view mirror of macroeconomics. It tells you what happened to retail prices last month. What we want to know is where structural cost pressure is building before it appears in the headline number.
The Era Global Risk Index monitors 24 structural indicators. The inflation-related components include M2 money supply trajectory, liquidity conditions in interbank markets, commodity price trends adjusted for currency moves, capital expenditure data in energy and industrial sectors, the trajectory of credit growth relative to economic output, and geopolitical fragmentation indicators that signal supply chain restructuring. By the time CPI is printing at 8%, the investment thesis has already shifted. The opportunity was twelve to eighteen months earlier, when these structural signals were diverging from what consensus pricing implied.
You can track the live index reading and our methodology at eraperemen.info/en, and review how our structural inflation signals have performed in the Forecast Scoreboard: Month 1 Review.
What Investors Should Watch Next
Inflation rarely arrives from a single source, and it rarely departs when a single cause is removed. The 2021–2022 surge was simultaneously demand-pull from stimulus, cost-push from supply chain disruption, monetary from M2 expansion, and structural from the compounding effects of a decade of underinvestment. Treating it as any one of those things and designing policy solely for that one thing is how the Fed's "transitory" call proved so expensive.
The structural component of current inflation has not disappeared. It has been partially masked by demand compression. The underlying supply constraints in energy infrastructure, in industrial metals, in the political economy of global trade remain in place. Investors who position as though the inflation problem is definitively resolved may face a recurrence that is structurally more persistent than the first round.
The inputs I monitor for early warning of structural inflation inflection are: M2 trajectory and whether it is re-accelerating after the 2022–2023 tightening cycle; real commodity prices in energy, copper, and agricultural inputs; the capital expenditure cycle in extractive industries, specifically whether new supply is actually coming online or whether capex growth is simply inflation of existing costs; credit market conditions, particularly high-yield spreads, which reflect whether the corporate sector can absorb cost pressures without a significant default cycle; labor cost growth in sectors with significant domestic production exposure; and central bank forward guidance relative to realized inflation readings across key emerging markets.
For investors monitoring geopolitical risk drivers of inflation, the Top 5 Geopolitical Risks in 2026 article examines the specific flashpoints currently most likely to generate new supply-side disruptions. For the foundational mechanics of how recessions interact with inflationary cycles and why stagflation is the hardest combination to navigate, those articles are the natural next step from here.
Frequently Asked Questions
What causes inflation?
Inflation is caused by a combination of forces that can operate simultaneously. Demand-pull inflation occurs when consumer and business spending exceeds what the economy can produce. Cost-push inflation occurs when the cost of production increases, through higher energy, raw material, or labor costs, and those costs are passed to consumers. Monetary inflation occurs when the money supply grows faster than economic output. And structural inflation, which is the most durable and difficult to eliminate, occurs when long-term underinvestment in productive capacity creates supply constraints that persist through multiple demand cycles and cannot be resolved through monetary policy alone.
What is the biggest driver of inflation today?
The honest answer is that it depends on the specific economy and the time period under examination. For the 2021–2022 global surge, all three classical mechanisms contributed simultaneously. The element that mainstream analysis has most consistently underweighted is the structural component: a decade of underinvestment in physical productive capacity, combined with the permanent cost increase of deglobalization, that creates a price floor which monetary tightening alone cannot remove.
Does printing money always cause inflation?
Not always, and not immediately. The relationship between money supply growth and inflation depends on the velocity of money, how quickly it circulates through the economy, and the productive capacity available to absorb it. When the Federal Reserve expanded its balance sheet dramatically in 2008–2009, inflation remained subdued for years because the banking sector was deleveraging and the new liquidity was not circulating rapidly. The 2020–2021 expansion was different: fiscal stimulus put cash directly into household accounts which were spent quickly, into an economy whose supply was simultaneously constrained. The timing and mechanism of monetary transmission matters as much as the magnitude.
Why is inflation difficult to stop?
Cyclical inflation, driven by demand overheating or temporary supply shocks, is relatively manageable through monetary tightening. Structural inflation is not, because the root causes are not responsive to interest rates. You cannot raise rates to commission a new oil field. You cannot tighten monetary policy to build a copper smelter. You cannot set the overnight lending rate at a level that undoes the cost consequences of twenty years of globalization reversing. These are physical and geopolitical constraints on supply that sit outside the reach of central bank tools.
Can interest rate hikes eliminate inflation?
They can reduce demand enough to compress price growth significantly. Whether they can eliminate inflation entirely depends on whether the underlying cause is demand-side or supply-side. The Fed's 2022–2023 rate hike cycle was effective at cooling the demand-pull and monetary components of the 2021–2022 inflation. What it could not do was increase the supply of housing, energy infrastructure, or industrial metals. The inflation that proved most persistent in services, in shelter, in structurally tight labor markets was precisely the inflation most resistant to demand compression.
What is structural inflation?
Structural inflation is price pressure embedded in the long-term supply capacity of an economy, rather than driven by short-term fluctuations in demand or monetary conditions. It arises when productive investment in key sectors (energy, mining, agriculture, infrastructure) has been systematically insufficient for a prolonged period, creating supply constraints that outlast any individual demand cycle. It also arises when geopolitical forces (deglobalization, reshoring, supply chain fragmentation) permanently raise the cost of production across multiple industries. Structural inflation does not respond to standard monetary tightening because the problem is not excess demand. The problem is insufficient supply.
How does deglobalization affect inflation?
Globalization was, at its core, a continuous supply-side deflation machine. By sourcing each component of production from the lowest-cost geography available, the global economy generated decades of falling goods prices. Deglobalization reverses that logic. Bringing production closer to home, or to politically aligned countries rather than cost-optimal ones, raises the cost of goods structurally. Tan, Wang, and Yang's 2023 study of 163 economies reports an average 1.75% rise in CPI inflation associated with deglobalization since 2020; this is the paper's model-based estimate, expressed in its reported notation. That addition does not reverse when the Fed raises rates. Source.
Which types of assets typically perform better during structural inflation?
In broad structural terms, assets with fixed or constrained supply, real assets like energy, metals, and agricultural land, tend to maintain real value when purchasing power declines. Companies with strong pricing power, the ability to raise prices without losing customers, tend to preserve real profit margins through cost inflation cycles. Geographic and currency diversification reduces the concentration risk of relying on a single central bank's monetary decisions. Fixed-rate debt, in environments where real rates are negative, can function as a structurally advantageous instrument because the real burden of the debt declines with inflation. None of these observations constitute financial advice. The suitability of any position depends entirely on individual circumstances, time horizon, and risk tolerance.
About E.R.A. OF CHANGES
E.R.A. OF CHANGES is an independent macroeconomic research and geopolitical intelligence firm providing institutional-quality analysis to investors worldwide. Our research combines macroeconomics, financial markets, blockchain analytics, and geopolitical risk into proprietary forecasting frameworks designed to identify structural market trends before they become consensus.
The Era Global Risk Index, updated daily from 24 structural indicators, serves as the foundation of our analytical methodology, providing a forward-looking measure of systemic financial stress grounded in structural economic evidence rather than market sentiment. Our full methodology, live index reading, and forecast archive are available at eraperemen.info/en.
The content published by E.R.A. OF CHANGES is for informational and educational purposes only and does not constitute financial, investment, legal, or tax advice. All views expressed are the personal analytical perspective of the author. Past forecast accuracy does not guarantee future results. Readers should conduct their own research and consult a qualified financial professional before making any investment decisions.
Sources
- Top 20 Miners' CapEx to Grow by 3.8% in 2026 — Mining Technology
- Oil and Gas Industry Shows Discipline on Capex, But Risks Remain — Federal Reserve Bank of Dallas
- Bank of Japan Ends Negative Rates, Abandons Yield Curve Control — CNBC
- Bank of Japan Monetary Policy Decision, March 19, 2024 — Bank of Japan
- Bank of Japan Policy Shift Ushers in a New Era for Investors — PIMCO
- Consumer Price Index Data Quality: How Accurate Is the U.S. CPI? — Bureau of Labor Statistics
- Frequently Asked Questions about Hedonic Quality Adjustment in the CPI — Bureau of Labor Statistics
- Assessing and Improving the Accuracy of the CPI — BLS Monthly Labor Review, 2024
- Reshoring to Survive? The Other Side of De-Globalization — Journal of Industrial and Business Economics, Springer
- World Economic Outlook, April 2025: A Critical Juncture amid Policy Shifts, International Monetary Fund
- World Economic Outlook Update, January 2024 — IMF
- Correcting for Quality Change When Measuring Inflation — NBER Digest



