Executive Summary
Most investors watch inflation. They track the monthly CPI release, study the Fed's preferred PCE measure, and try to read what consumer prices are telling them about the economy's direction. Professional macro investors watch something else: liquidity. Specifically, they watch M2, the broadest widely-used measure of money circulating through the US economy.
The distinction matters because M2 and CPI measure fundamentally different things at fundamentally different points in time. CPI measures what prices did last month. M2 measures how much fuel is in the engine right now and whether there is too much, too little, or just enough to sustain the current trajectory of growth, asset prices, and inflation.
The 26.9 percent year-over-year M2 growth recorded in February 2021 was the highest rate in the published series since 1959, and it preceded the 2022 inflation surge. In our reading, it was an important early warning of rising inflation risk. The sharp M2 contraction that followed in 2022 and 2023 also gave us a useful signal of disinflationary pressure and tightening financial conditions; it did not, by itself, identify the specific vulnerabilities that led to SVB’s failure. St. Louis Fed analysis of M2.
In the Federal Reserve's June 23, 2026 H.6 release, seasonally adjusted M2 stood at $23.05 trillion in May 2026, a new series high. The same release reports February M2 at $22.6269 trillion and February 2025 at $21.6134 trillion, a year-over-year increase of approximately 4.7%. The Federal Reserve distinguishes its reserve-management purchases from quantitative easing. Understanding M2 is not optional for anyone who wants to understand where markets are heading. Source. Source 2. Source 3.
Introduction
Most investors watch inflation. They wait for the monthly CPI release. They track shelter costs and core services. They watch the Fed commentary. They try to read the present through the data the present generates.
Professional macro investors watch something different. They watch liquidity, specifically M2, because liquidity is what inflation is made of before inflation exists. By the time the CPI confirms a price trend, the monetary conditions that created it have been in place for a year or more. Watching CPI as your primary indicator is like watching the fire after the gas has already been spread. Technically accurate. Operationally late.
In our macro models, M2 functions as the primary liquidity filter. If the economy is an engine, M2 is the fuel. We do not analyze risk markets (equities, crypto, credit) in isolation from the dynamics of money supply. Shrinking liquidity can create a headwind for risk assets, but it does not mathematically rule out a rising market. And inflationary explosions, in the modern monetary system, almost always trace back to a prior period of excessive money creation that the CPI data picks up only after the fact.
This article explains what M2 is, why it matters, what the 2020 to 2023 cycle demonstrated about its predictive power, and what the current M2 dynamics are warning about in the environment we are in today.
What Is M2 Money Supply?
M2 is a measure of the total money supply in an economy, a count of all the money that is held in currency and relatively liquid deposit and retail money-market balances. The Federal Reserve publishes M2 data through its monthly H.6 Money Stock Measures release, generally on the fourth Tuesday of the month. Source. Source.
To understand M2, it helps to understand what it includes and how it is built up from narrower money supply definitions.
M0 is the most basic measure: physical currency in circulation, banknotes and coins. Nobody walks around with enough cash to run an economy on, so this number is useful as a baseline but limited as an economic indicator.
Since May 2020, the Federal Reserve's M1 definition includes currency, demand deposits and other liquid deposits, including savings deposits. It is not limited to checking accounts and cash. Source.
M2 adds small-denomination time deposits (under $100,000) and retail money-market fund balances to M1, with adjustments to exclude IRA and Keogh balances. Savings deposits are already part of M1 in the Federal Reserve's post-2020 definition. Source.
The FRED M2 series tracks this aggregate back to 1959 and is the primary data source for monetary analysis in the United States.
What M2 actually measures, in aggregate, is the fuel available to the economy. It answers a fundamental question: how much money can households and businesses put to work spending, investing, borrowing against, and moving within a short timeframe?
Why Does M2 Matter?
Money moves things. When there is abundant liquidity in the system, when M2 is expanding, households spend more, businesses invest more, banks lend more readily, and asset prices rise as capital chases opportunity. When liquidity tightens, when M2 growth stalls or contracts, the reverse happens across all of those dimensions simultaneously, though not instantaneously and not evenly.
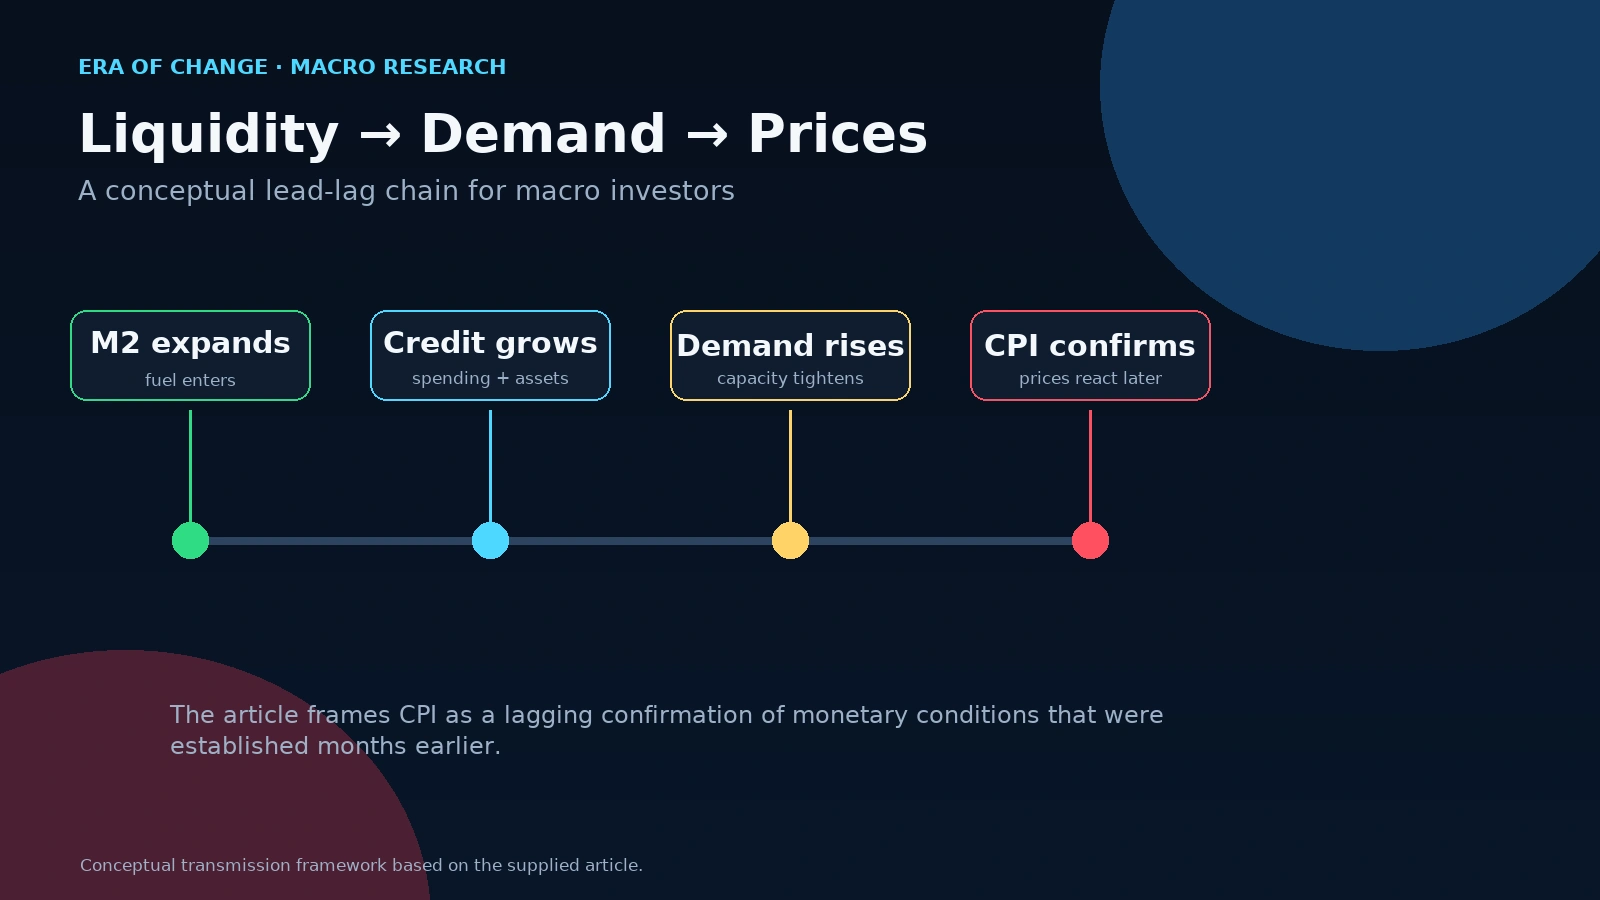
The critical insight is that M2 changes tend to precede the economic and market outcomes they eventually produce. Credit creation feeds spending, which feeds corporate revenue, which feeds employment, which feeds further spending. Money supply changes at the front of this chain. Economic data captures the chain only after it has run.
This is why institutional macro investors, the kind who manage sovereign wealth funds, global macro hedge funds, and large pension portfolios, monitor M2 as a structural input rather than a reactive indicator. They are not asking what the CPI print was last month. They are asking: given the current trajectory of money supply, what does the inflation and growth environment look like in 9 to 18 months? That forward-looking question is what M2 actually answers.
How M2 Affects Inflation: The Threshold That Matters
The relationship between M2 and inflation is real and historically durable, but it is not mechanical. Simply growing the money supply does not automatically produce inflation, the money also has to circulate, and it has to run up against constrained supply. When both conditions are present, the combination produces price acceleration.
The signal I watch is not whether M2 is growing. It is whether M2 is growing faster than the economy it is supposed to serve. Inflation risk builds when M2 expansion rates systematically exceed the sum of real GDP growth plus the central bank's target inflation rate. Think of it as a speed limit for money creation: if the economy is growing at 2 percent and the inflation target is 2 percent, M2 can expand at roughly 4 percent annually without creating excess liquidity.
Beyond that level, the money starts outpacing the goods and services it can buy.
Historically, sustained M2 growth above roughly 7 to 8 percent annually begins to create the kind of liquidity overhang that eventually forces prices higher. It does not happen immediately, the transmission runs through credit conditions, consumer demand, and supply capacity, but the mathematical relationship is consistent enough to treat as a structural warning threshold.
When M2 grows very rapidly, as it did during the pandemic, inflation risk can rise, particularly when spending accelerates and supply is constrained. In our view, the 26.9 percent year-over-year peak in February 2021 was a powerful warning signal. It was not a guarantee: the timing and magnitude of inflation also depend on money velocity, spending, supply capacity, and policy.
Why M2 Matters More Than CPI for Investors
Here is the most important conceptual distinction in monetary economics for practical investors.
CPI is the receipt the economy has already handed you. It confirms the price you paid. The damage is done. What you are reading in a CPI report is the consequence of monetary and supply conditions that were established months or years earlier. Useful for confirming what you already believed. Not useful for positioning ahead of what is coming.
M2 is the money before it becomes the purchase. It can show monetary conditions before they work through consumer prices, corporate revenues, and labor markets. In our interpretation, rapid expansion can signal rising inflationary pressure, while contraction can signal disinflationary pressure even when current inflation remains elevated. These are signals, not automatic outcomes; credit, spending, supply conditions, and velocity affect how they pass through.
This forward-looking property is why macro investors often treat M2 as a leading indicator and CPI as a lagging one. In the 2020 to 2021 episode, investors watching M2’s rapid expansion had an earlier warning of inflation risk than those waiting for CPI confirmation. M2 offered a signal, not a precise forecast of the timing or size of the subsequent rise.
The fuel is visible before the fire.
What the 2020–2023 M2 Cycle Taught Investors
This is an instructive monetary episode because it shows how M2 can offer an earlier signal than CPI in some cycles, while also illustrating why money-supply data should be interpreted alongside spending, money velocity, supply conditions, and policy.
Between early 2020 and early 2022, the US money supply expanded unusually rapidly. Year-over-year M2 growth peaked at 26.9 percent in February 2021, the highest rate in the published series since 1959. This sharp expansion raised inflation risk, although its effects depended on spending, money velocity, and supply conditions. St. Louis Fed.
The PCE inflation measure began rising in February 2021, at precisely the peak of M2 growth. For anyone watching the liquidity data rather than waiting for the CPI confirmation, the inflation surge was visible twelve to eighteen months before it became the dominant narrative in financial media.
Then came the reversal. As the Federal Reserve raised rates and began quantitative tightening, M2 growth decelerated and later turned negative. The year-over-year M2 growth rate reached negative territory in late 2022, the first such reading in the published series since 1959. This is distinct from the monetary base, whose growth fell to negative levels during the first half of 2022. St. Louis Fed analysis of M2.
This contraction did two things that most analysts missed in real time.
First, it made a disinflationary impulse increasingly likely. While CPI readings remained elevated in late 2022, M2 growth had weakened and turned negative. In our analysis, falling M2 can weigh on inflation with a lag, but it does not mechanically guarantee falling prices. Historical M2-to-CPI lead times, including the roughly nine-to-eighteen-month range discussed here, are a reference rather than a fixed schedule.
Second, and more specifically, the M2 contraction offered a macro signal of tightening conditions across a banking system built around abundant liquidity. SVB’s failure also reflected its own vulnerabilities: concentrated, largely uninsured deposits, significant interest-rate exposure, and weaknesses in liquidity and risk management. The Federal Reserve’s review documents these bank-specific factors. Federal Reserve review of SVB.
When the Fed raised rates rapidly, SVB’s long-term bond portfolio lost market value. At the same time, technology-sector clients withdrew deposits as funding became harder to obtain. The Federal Reserve’s post-mortem documents how interest-rate sensitivity and depositor concentration made the bank vulnerable to the tightening environment that M2 contraction was also reflecting at the macro level. Federal Reserve post-mortem.
The banking system was suffocating from lack of oxygen. The M2 data showed the oxygen leaving the room before any alarm was publicly triggered.
M2 and Financial Markets
The relationship between M2 and asset prices is not a theory. It is a statistical reality consistent enough to structure investment decisions around.
Equity Markets
The relationship between M2 and US equity prices is an important one to watch across cycles. When M2 bottomed near $15.2 trillion in February 2020, the S&P 500 reached its pandemic closing low of 2,237.40 on March 23. During the later tightening cycle, M2 reached a trough near $21 trillion in October 2023, while the S&P 500 hit a local low near 4,117 shortly thereafter, as reported at the time. The US Total Market Capitalization divided by M2 is one way to track this relationship across cycles. These observations do not show that M2 alone drives equity valuations; earnings, interest rates, risk appetite, and expectations also matter. FactSet, April 9, 2020.
Sustained bull markets in equities are structurally difficult to maintain without M2 expansion. The capital that bids up equity multiples has to come from somewhere. When liquidity is shrinking, the buyers of last resort disappear first and equity prices follow.
Bond Markets
In bond markets, M2 dynamics work through their effect on interest rates and credit conditions. Rapidly expanding money supply puts upward pressure on inflation expectations and long-term yields. Contracting money supply reduces those pressures, creating disinflationary conditions that benefit bond prices. More directly: when M2 contracts and bank deposits fall, the appetite for credit creation tightens, spreads widen, and the cost of capital rises for borrowers across the spectrum from investment-grade corporates to high-yield issuers.
Cryptocurrency
Crypto assets have historically shown an even stronger correlation with global liquidity cycles than equities. Bitcoin's major rallies (2020 to 2021, and the 2023 to 2024 cycle) both coincided with periods of M2 expansion. The 2022 bear market, which saw Bitcoin fall from approximately $68,000 to below $16,000, unfolded precisely as M2 contracted at its most severe pace. This is not coincidental. Crypto markets have fewer fundamental earnings anchors than equities; they are almost entirely a function of the risk appetite that liquidity conditions create and destroy.
Housing Markets
Mortgage availability and credit growth are direct functions of bank liquidity. When M2 is expanding and bank deposits are abundant, lending standards loosen and mortgage origination accelerates, the precise conditions that drove housing prices to their pandemic-era peaks.
When M2 contracts and deposits shrink, the reverse applies. The housing market's response to the 2022 to 2023 tightening (sharp volume declines, regional price contractions) was the predictable output of a monetary environment that the M2 data had been describing for months before housing prices confirmed the shift.
Era Analyst's Perspective
"The mistake most investors make is treating M2 as a macroeconomic curiosity rather than an operational input. They look at it occasionally, note that it's up or down, and move on to the CPI release or the Fed press conference. What they are missing is the analytical sequence that actually governs markets.
The 26.9 percent year-over-year M2 expansion in February 2021 was not background noise. In our interpretation, it signaled elevated inflation risk and made a policy response more likely, with potential consequences for financial plumbing. The timing and severity were not guaranteed, but the risk warranted attention.
What the 2022 and 2023 contraction showed us beyond the inflation thesis was that liquidity was tightening across the financial system. In our view, the regional banking stress that became visible in March 2023 was consistent with fractures that monetary tightening can expose. SVB’s specific vulnerabilities included concentrated uninsured deposits, interest-rate exposure, and weaknesses in liquidity and risk management, as the Federal Reserve’s review explains. M2 helps frame the macro environment; the CPI alone does not show these bank-level risks. Federal Reserve review of SVB.
In its June 23, 2026 H.6 release, the Federal Reserve reported that M2 reached a new high of $23.05 trillion in May 2026. The Fed's reserve-management purchases are intended to maintain ample reserves and are distinct from quantitative easing or a change in the policy stance. E.R.A.'s concern about monetary accommodation before balance-sheet strains are resolved remains a risk scenario; these purchases alone do not establish that the Fed has shifted to easing. A second inflation wave remains a risk, not a confirmed outcome." Source. Source 2.
What Does M2 Tell Us Today?
The current M2 picture is more urgent than most investors recognize and more clearly aligned with the second inflation wave scenario than the consensus acknowledges.
The Federal Reserve's June 23, 2026 H.6 release reported seasonally adjusted M2 at $23.0523 trillion in May 2026, a new high. From July 2025 ($22.0204 trillion) to May 2026, M2 rose by approximately $1.032 trillion. February 2026 M2 was $22.6269 trillion, about 4.7% above February 2025 ($21.6134 trillion). Source. Source 2.
The Mises Institute's May 2026 analysis discusses recent money-supply growth. Separately, the Federal Reserve says it began reserve-management purchases in December 2025 to maintain ample reserves; these operations are not quantitative easing and are distinct from the Fed's policy-rate decisions. The dated H.6 table shows continued growth through May 2026. Source. Source 2. Source 3. Source.
E.R.A.'s risk thesis concerns monetary accommodation before the financial system has fully worked through the bad debts and structural distortions created by the 2020–21 liquidity surge and 2022–23 tightening. However, the Federal Reserve says its reserve-management purchases, begun in December 2025, are intended to maintain ample reserves and are not QE or a change in the monetary-policy stance. Separately, the June 23, 2026 H.6 release shows M2 at a new high of $23.05 trillion in May 2026, up about $1.032 trillion from July 2025. Source.
Our base case for the next 6 to 12 months is that current liquidity conditions are sufficient to avoid a deflationary collapse, but not sufficient to support the elevated multiples of growth-dependent technology equities without a return to cheaper capital. We also see a risk of a second inflationary impulse if global demand picks up or energy prices spike. This is a forecast, not a guarantee; the outcome will depend on demand, supply, and policy.
Core CPI has remained persistently above 3 percent. The monetary conditions now in place are structurally consistent with that stickiness remaining or worsening. The question for investors is not whether this pattern is visible in the data. It is clearly visible. The question is whether they are watching the liquidity data or waiting for the consumer price data to confirm what the money supply is already describing.
How Era Uses M2
M2 sits within the capital flows and money supply category of the Era Global Risk Index, one of six structural categories that the index aggregates daily into a single systemic risk score. We do not treat M2 as a standalone signal that drives decisions in isolation. No single indicator can or should do that.
What M2 contributes to the Era framework is a structural reading of whether the monetary fuel available to the economy is expanding, stable, or contracting and at what rate relative to the thresholds that historically separate benign from inflationary or deflationary conditions. A 1.67 percent quarterly M2 growth rate reads differently in a context of contained credit spreads and stable interbank liquidity than it does in a context of widening high-yield spreads, post-inversion yield curve normalization, and a corporate refinancing wall of $2.5 trillion. The same number carries different structural weight depending on what surrounds it.
Our current reading of 69 out of 100 on the Era Global Risk Index reflects that wider context. The M2 data feeds into it along with monetary policy conditions, credit market stress, interbank liquidity, labor market dynamics, and geopolitical risk. The index exists precisely because no single indicator, including M2, is sufficient to assess systemic risk with the specificity that investment decisions require.
What Investors Should Watch Next
The indicators that matter for understanding where M2 is leading over the next twelve months are these, monitored not as independent signals but as a connected system.
M2 growth on a year-over-year basis, tracked through the FRED M2SL series, is the primary number. At the current growth rate, watch for whether the expansion accelerates above 4 to 5 percent annualized, which would begin to create conditions for renewed inflationary pressure, or whether QE is reversed and growth stalls.
The Federal Reserve balance sheet trajectory tells you whether the QE that is currently expanding M2 is set to continue, decelerate, or reverse. The Fed's H.4.1 release publishes this weekly. When the balance sheet is growing, M2 follows with a short lag. When the Fed returns to QT, M2 growth will compress.
Bank lending standards, published quarterly through the Federal Reserve's Senior Loan Officer Opinion Survey, tell you how the liquidity the Fed is creating is transmitting into the real economy. Banks sitting on reserves without extending credit keeps M2 expansion sequestered and reduces its inflationary impact. Banks lending aggressively amplifies every dollar of QE-created money.
Core PCE and core CPI confirm whether M2 expansion is already transmitting into prices. The 12 to 18 month lag between M2 changes and CPI movements means that current M2 expansion will show up in price data through 2026 and into 2027 and the fact that core services inflation is already running above 3 percent means the second inflation wave I described does not require extraordinary monetary acceleration to materialize. It requires only the continuation of conditions that already exist.
And the China Credit Impulse, tracked on MacroMicro, remains the single most important leading indicator of global demand at a 9 to 12 month forward horizon. When Chinese credit creation accelerates, global demand follows, commodity prices move, and US inflation is pressured from the supply side simultaneously. Monitoring M2 without monitoring the global liquidity context it operates within is like watching one instrument in an orchestra and ignoring the rest of the ensemble.
No single number answers the full question. The analytical discipline is reading them together.
Frequently Asked Questions
What is M2 money supply?
M2 is the Federal Reserve's broadest widely-used measure of the total money supply in circulation in the US economy. It includes physical currency, checking and demand deposits, savings accounts, money market accounts, and small certificates of deposit, essentially every form of money that can be accessed quickly and converted into spending. The Federal Reserve publishes M2 data monthly through its H.6 release. Source.
Why is M2 important?
M2 measures the total fuel available to the economy, the capital that drives spending, investment, lending, and asset purchases. Because changes in M2 precede their effects on inflation, economic growth, and asset prices by months or years, it functions as a leading indicator of future economic conditions. Professional macro investors monitor M2 to understand where the economy is heading before the outcome is visible in standard economic data.
Does M2 cause inflation?
Rapidly expanding M2, when it runs up against constrained supply, produces inflationary pressure, but the relationship has a lag and depends on conditions including the velocity of money, supply chain capacity, and whether expanded monetary supply is being spent or held as reserves. Historically, sustained M2 growth above roughly 7 to 8 percent annually creates excess liquidity that eventually forces prices higher. Growth above 12 to 15 percent, as occurred in 2020 to 2021, can increase inflation risk when money circulates faster and supply cannot meet demand.
What is included in M2?
M2 includes physical currency in circulation, checking and demand deposit accounts (M1), plus savings accounts, money market deposit accounts, and certificates of deposit under $100,000. It captures all money that is either immediately liquid or can be accessed and converted into spending within a short timeframe.
Why did M2 decline in 2022?
M2 contracted in 2022 and 2023 as the Federal Reserve tightened policy and shrank its balance sheet. The contraction was the sharpest in the published year-over-year M2 series since 1959. It contributed to the disinflationary impulse in 2023 and 2024 and formed part of the tightening environment in which banking stress, including SVB’s failure, emerged. These developments also reflected other forces, including policy rates, supply normalization, and SVB’s bank-specific risks. St. Louis Fed on M2; Federal Reserve review of SVB.
How does M2 affect the stock market?
Equity markets are closely tied to liquidity conditions. When M2 is expanding, more capital is available to bid for financial assets, and valuations tend to rise. When M2 contracts, the capital available for equity purchases shrinks and multiples compress. The S&P 500 and M2 have moved closely together over recent cycles: both bottomed in early 2020 and rose together through 2021; both peaked near the same period in early 2022; both found a trough in late 2023. Sustained equity bull markets are structurally dependent on an expanding liquidity backdrop.
Is M2 still a reliable economic indicator?
Yes, M2 can be a useful real-time tool when its transmission lags and interaction with other monetary variables are understood. In the 2020 to 2023 cycle, the 26.9 percent peak expansion preceded the inflation surge, and the later contraction signaled a disinflationary impulse and financial stress. Our view is that the indicator remained useful; the challenge is to read it alongside other conditions rather than wait for CPI confirmation.
How does the Federal Reserve influence M2?
The Fed influences M2 primarily through three mechanisms: setting the federal funds rate (which affects the cost of credit and the willingness of banks to lend), quantitative easing (directly purchasing assets with newly created reserves, which expand bank deposits and thus M2), and quantitative tightening (selling assets or allowing holdings to mature, which drains reserves and contracts M2). The Fed's H.6 release reports M2 monthly; its H.4.1 release tracks the balance sheet that drives M2 creation. Source.
About E.R.A. OF CHANGES
E.R.A. OF CHANGES is an independent macroeconomic research and geopolitical intelligence firm providing institutional-quality analysis to investors worldwide. Our research combines macroeconomics, financial markets, blockchain analytics, and geopolitical risk into proprietary forecasting frameworks designed to identify structural market trends before they become consensus.
The Era Global Risk Index, updated daily from 24 structural indicators, serves as the foundation of our analytical methodology, providing a forward-looking measure of systemic financial stress grounded in structural economic evidence rather than market sentiment. Our full methodology, live index reading, and forecast archive are available at eraperemen.info/en.
The content published by E.R.A. OF CHANGES is for informational and educational purposes only and does not constitute financial, investment, legal, or tax advice. All views expressed are the personal analytical perspective of the author. Past forecast accuracy does not guarantee future results. Readers should conduct their own research and consult a qualified financial professional before making any investment decisions.
Sources
- Federal Reserve: H.6 Money Stock Measures — Current Release
- FRED: M2 Money Stock (M2SL)
- FRED: Real M2 Money Stock (M2REAL)
- St. Louis Fed: The Rise and Fall of M2
- Federal Reserve: Evolution of Silicon Valley Bank — April 2023
- Mises Institute: Money-Supply Growth in 2026 Rises to Multi-Year High
- MacroMicro: US Total Market Cap Divided by M2 Money Supply
- MacroMicro: China Credit Impulse Index
- CoinDesk: US M2 Money Supply Approaches New Highs as Financial Assets Reach Record Levels
- USAFacts: What Is the Money Supply, and How Does It Relate to Inflation?



