Executive Summary
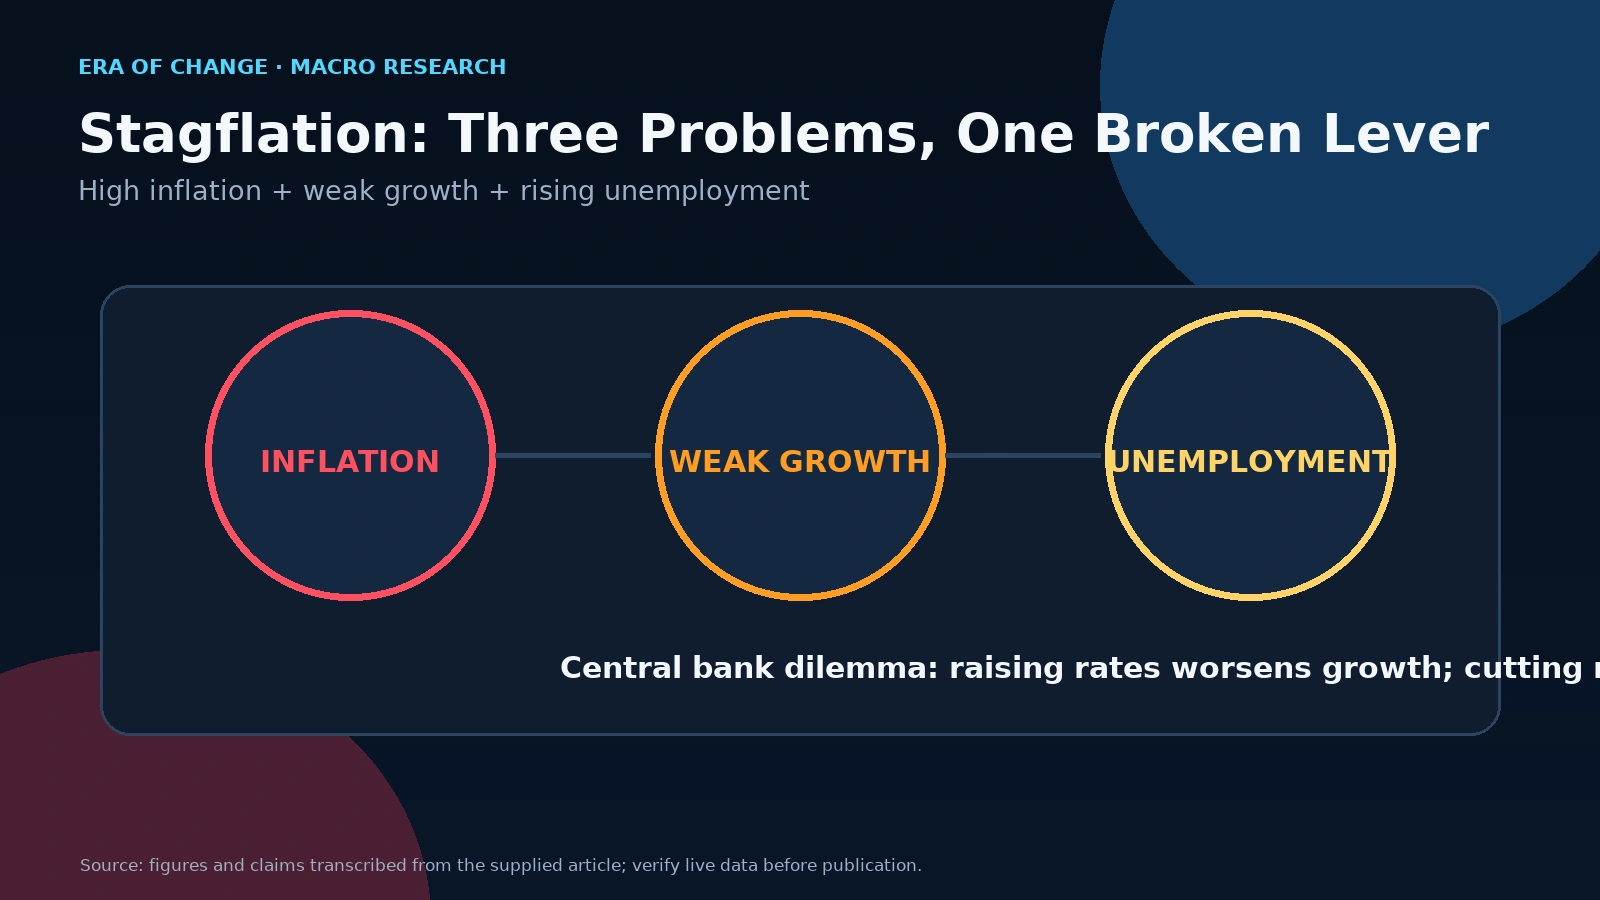
Stagflation, the simultaneous combination of high inflation, weak economic growth, and rising unemployment, sits at the most difficult intersection in macroeconomics. It is dangerous not because of any single dimension, but because the standard tools break down. A central bank can raise rates to fight inflation, but doing so into a stagnating economy deepens the pain for consumers and businesses already struggling. It can cut rates to stimulate growth, but doing so while prices are still rising guarantees the inflation problem compounds. The lever that works in any other environment stops working here.
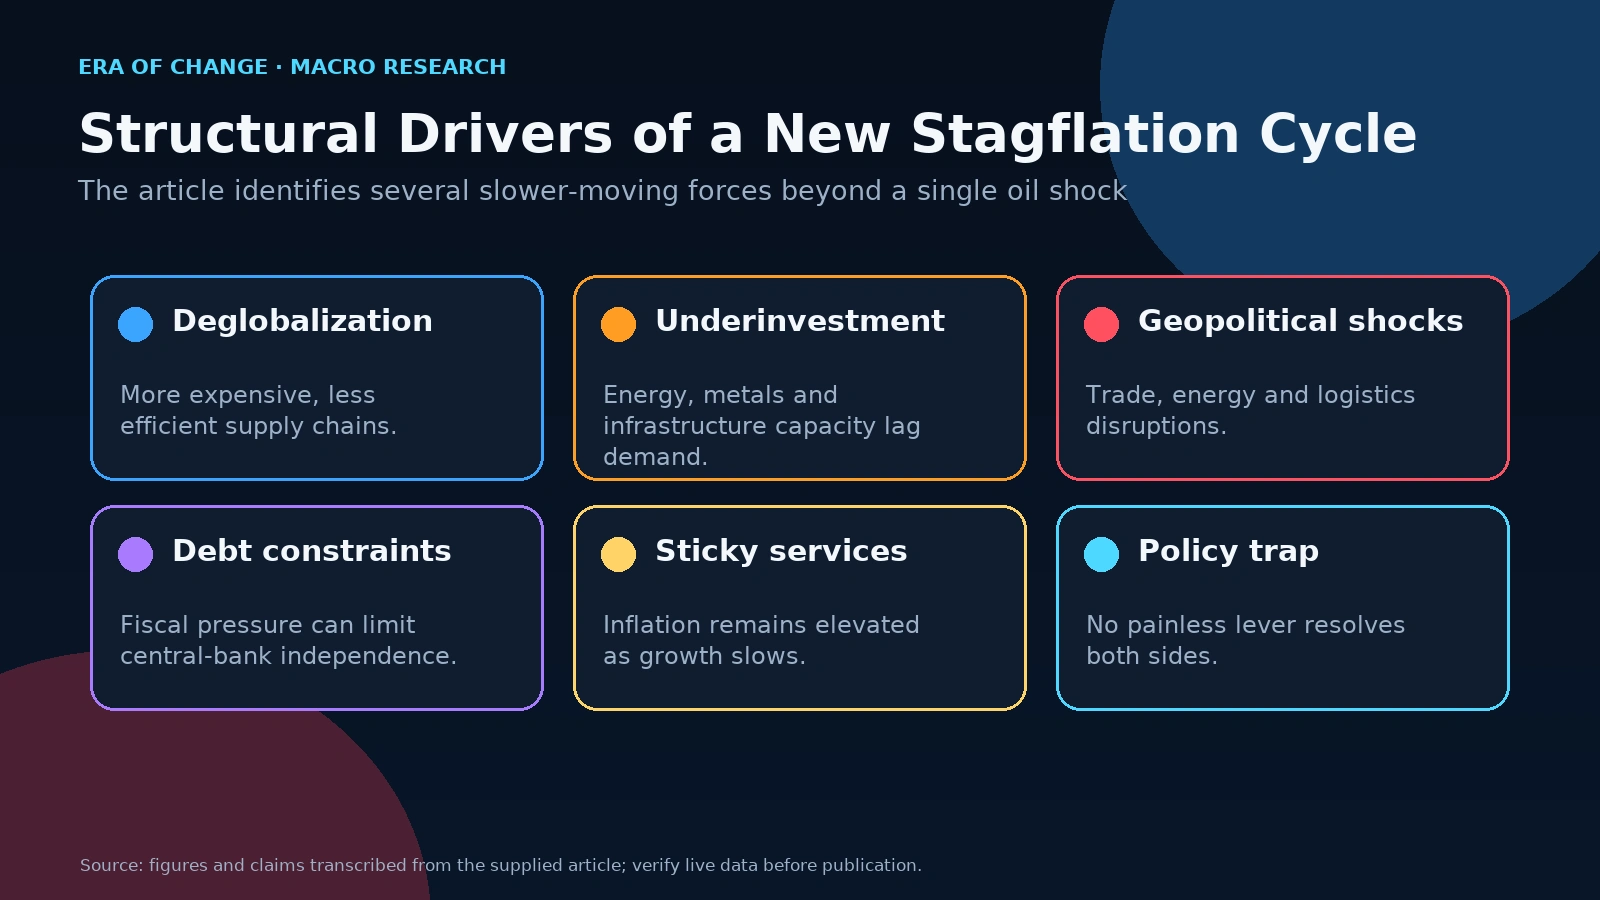
Most investors still treat stagflation as something that belonged to the 1970s and hasn't been seriously relevant since Paul Volcker broke it with 20 percent interest rates. That is a dangerous misreading of the current structural environment. The forces building today (systemic deglobalization, a decade of chronic underinvestment in energy and commodities, geopolitical fragmentation, and debt levels that constrain central bank independence) are creating conditions that are not identical to the 1970s in every particular, but are structurally more embedded in several respects.
Understanding what stagflation is, why it's so difficult to navigate, and how to think about portfolio positioning in that environment is no longer an academic exercise. It is an operational necessity.
Introduction
Most investors treat stagflation as a historical curiosity, a 1970s problem solved by Paul Volcker that has not been seriously relevant since. It gets discussed in macroeconomics textbooks between the chapters on the Phillips Curve and the oil shocks. It rarely shows up in contemporary portfolio construction conversations. That is a mistake, and I think it is one of the most consequential analytical blind spots in the current investment environment.
We are, in my assessment, half a step away from a full-blown stagflation scenario. Not there yet. But closer than markets are pricing, closer than central bank communications acknowledge, and close enough that any investor who hasn't updated their mental model for what that environment requires is operating on assumptions that may not survive the next twelve to eighteen months.
This article is the foundational guide. What is stagflation, precisely? Why is it so much more destructive than a standard recession? What caused the 1970s episode, and why are today's structural drivers fundamentally different and in some ways more stubborn? And most practically: what does it mean for how you think about protecting capital in an environment where the textbook playbook has a track record of failure?
What Is Stagflation?
The formal definition is simple. Stagflation occurs when an economy simultaneously experiences high inflation, stagnant or declining economic growth, and elevated unemployment. The term is a portmanteau of "stagnation" and "inflation," coined by British politician Iain Macleod in a 1965 parliamentary speech to describe exactly this combination.
The definition is simple. The reason economists consider it dangerous is less so.
Under normal macroeconomic conditions, inflation and unemployment move in opposite directions, a relationship the economist A.W. Phillips documented in 1958 and which became the conceptual foundation for monetary policy for several decades. When the economy is growing and unemployment falls, wage pressure rises, businesses pass those costs to consumers, and inflation increases. When the economy slows and unemployment rises, the reverse happens: wage pressure falls, businesses compete on price, and inflation moderates.
The Phillips Curve gave central banks a workable lever: raise interest rates to slow the economy and cool inflation; cut rates to stimulate growth and reduce unemployment. The two objectives were in productive tension, not mutual contradiction.
Stagflation breaks this model entirely. When you have high inflation and high unemployment simultaneously, when prices are rising rapidly in an economy that is not growing and whose workers are losing jobs, the lever that addresses one problem actively worsens the other.
There is no clean solution. That is what makes it so structurally different from any other economic environment, and so dangerous for investors accustomed to reaching for the same tools every cycle.
Why Stagflation Is So Dangerous
In a normal recession, the deflationary dynamics that accompany weak economic activity actually help the people most affected by it. Prices fall or stabilize as businesses compete for shrinking consumer spending. Real purchasing power partially offsets the income hit. Central banks cut rates, which reduces financing costs for households and corporations. Bond prices rise. The standard playbook: cut rates, buy long bonds, accumulate growth equities near the bottom has worked with reasonable consistency across the post-war business cycle.
Stagflation inverts almost all of it. Prices continue rising even as economic activity contracts and jobs disappear. Real wages fall not just because employment deteriorates, but because inflation is simultaneously eroding the purchasing power of whatever income remains. The consumer is being squeezed from two directions at once. The Fed cannot rescue markets with rate cuts, because cutting into elevated inflation would make the price problem worse. It cannot raise rates aggressively, because doing so into a contracting economy would accelerate employment deterioration.
The policy dilemma this creates is not just uncomfortable. It is structural. The central bank loses its most powerful transmission mechanism precisely when the economy needs intervention most. That asymmetry is why stagflation episodes tend to be prolonged, and why their resolution typically requires either a dramatic external event, a supply shock reversing itself, an energy price collapse or measures so severe, like the Volcker rate hikes of 1980 to 1981, that they cure the inflation by deliberately engineering a deep recession. The medicine becomes more painful than the disease.
Stagflation vs. Recession: Why the Distinction Matters
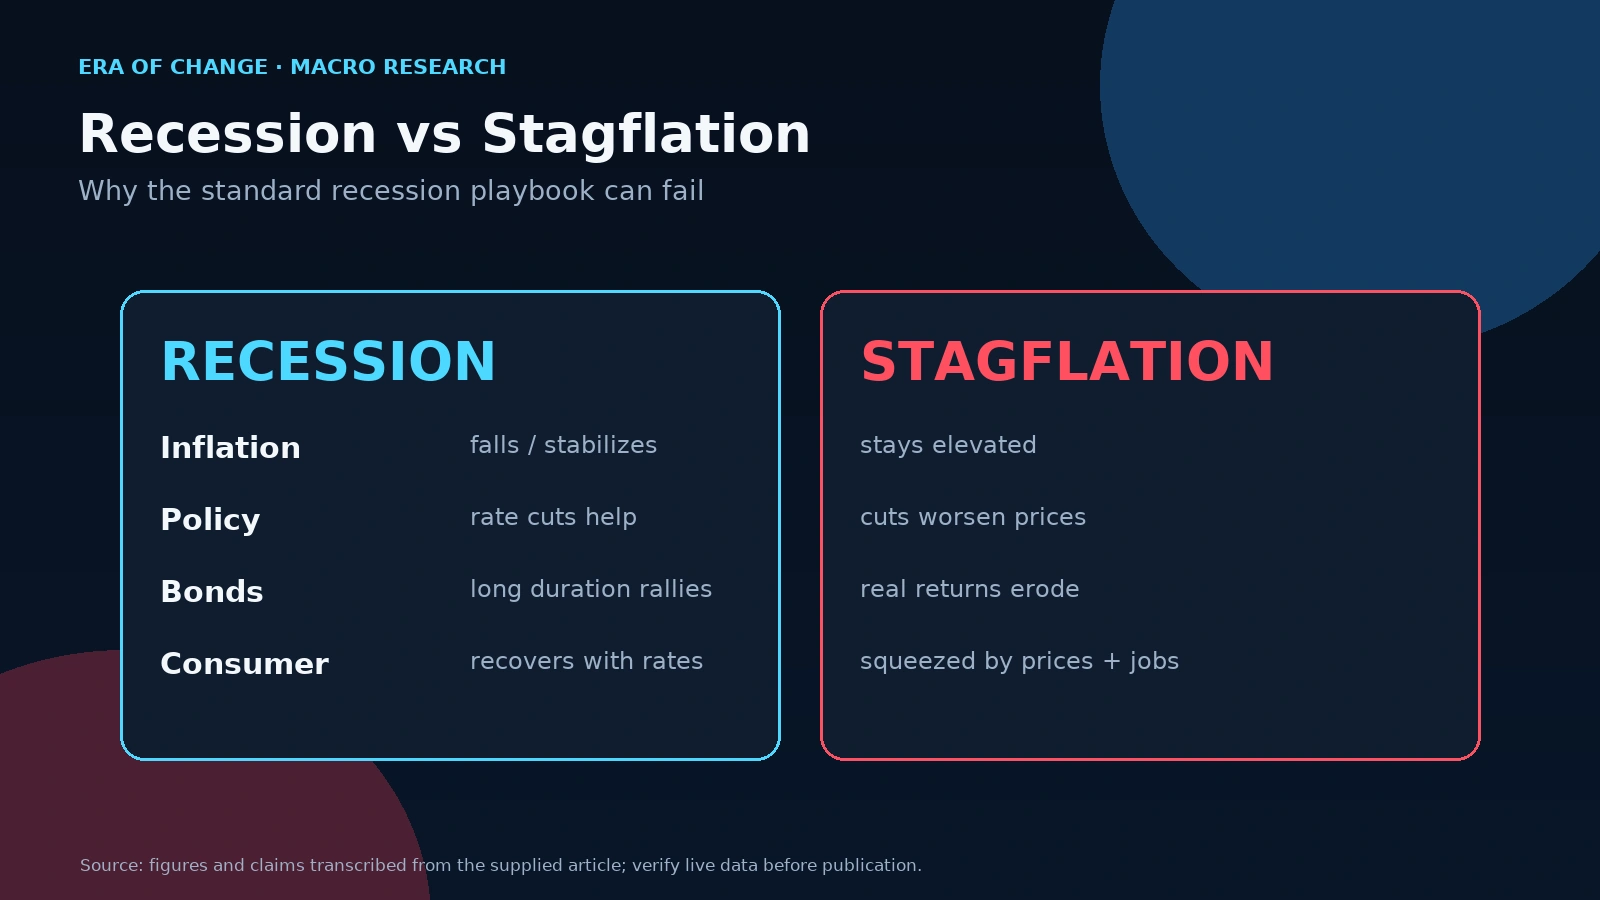
Understanding why stagflation requires a different analytical response than a standard recession starts with seeing exactly where the two environments diverge.
| Characteristic | Recession | Stagflation |
| GDP Growth | Negative | Flat to slightly negative |
| Inflation | Falls or stabilizes | Remains elevated or rises |
| Unemployment | Rises | Rises |
| Central bank response | Rate cuts — stimulative | Constrained cutting worsens inflation |
| Long-duration bonds | Rally as rates fall | Underperform real yields go deeply negative |
| Consumer discretionary | Falls, then recovers | Falls and stays depressed |
| Cash purchasing power | Stable or improving | Erodes continuously |
The critical row in this table is not GDP. It is inflation and what it implies for every other category. In a recession, falling inflation means bond prices rise as rates fall, cash preserves real purchasing power, and consumer-facing businesses eventually recover as real wages stabilize. In stagflation, none of those things happen. The investor who applies a recession playbook to a stagflationary environment is not just being conservative. They are being systematically wrong in a direction that compounds with time.
The 1970s Stagflation Crisis: What Actually Happened
The textbook version focuses on the 1973 Arab oil embargo and treats it as the primary cause. That is partly right and partly misleading and the distinction matters for understanding today's environment.
In October 1973, Arab members of OPEC imposed an embargo against the United States in response to American support for Israel during the Yom Kippur War. Crude oil prices roughly quadrupled. A second energy shock followed in 1979 with the Iranian revolution, which tripled prices again. The supply shock was genuine and severe.
But the structural vulnerability that allowed those shocks to produce a decade of stagflation, rather than a sharp but temporary disruption, was present before the embargo arrived. US monetary policy had been loose throughout the late 1960s, financing the Vietnam War and the Great Society programs without corresponding fiscal discipline.
By the time the oil shock struck, inflation expectations were already elevated and partially unanchored. The Federal Reserve, under political pressure to maintain growth, allowed the price spiral to run rather than confront it directly. The Federal Reserve History's essay on the Great Inflation documents how repeated decisions to accommodate rather than confront rising prices, from the early 1960s through 1979, transformed what might have been a manageable supply shock into a structural breakdown.
By 1964, US inflation stood at 1 percent with unemployment at 5 percent. Ten years later, inflation had crossed 12 percent and unemployment exceeded 7 percent. By the summer of 1980, inflation was running at 14.5 percent and unemployment above 7.5 percent. Volcker broke the spiral by doing what previous chairs would not: raising the federal funds rate to approximately 20 percent, engineering deep recessions in 1980 and 1981 to 1982, and accepting unemployment near 11 percent as the cost of permanently re-anchoring inflation expectations.
The cure was severe. It worked. And the lesson that central bank credibility must be defended aggressively and early, before expectations become self-reinforcing is precisely the lesson that is relevant again today.
Why Today's Stagflation Could Be More Structural Than the 1970s
This is where I want to be specific about what I actually think is happening, and why the standard historical analogy underestimates the current risk.
The 1970s episode had two primary causes: an exogenous supply shock and monetary policy that accommodated it rather than confronting it. Remove the oil shock, or run a credibly hawkish policy from the start, and the episode is materially shorter and less severe. Today's structural drivers are different. They are slower-moving, more deeply embedded, and significantly harder to reverse with any single policy lever.
Deglobalization and the End of the Deflationary Tailwind
The thirty-year period of falling goods inflation that ran from roughly 1990 to 2020 was not an accident of monetary policy. It was the product of an increasingly integrated global supply chain that continuously found cheaper ways to produce and deliver manufactured goods. That deflationary tailwind is structurally reversing.
Geopolitical fragmentation (US-China decoupling, sanctions regimes fragmenting trade in energy and semiconductors, strategic reshoring mandates in defense-critical manufacturing) means supply chains are becoming shorter, more redundant, and more expensive. The S&P Global analysis on the evolution of deglobalization frames this as the emergence of competing economic blocs that trade less with each other over time, each maintaining its own higher-cost productive capacity. The result is a permanent structural increase in the cost of manufactured goods. No monetary policy response accelerates this adjustment. It is a cost that embeds itself over years.
Chronic Underinvestment in Real Supply
A decade of ESG-driven capital withdrawal from energy, metals, and basic materials production, combined with the policy-induced uncertainty that made long-cycle commodity investment unattractive, has left the real economy with acute supply deficits in exactly the categories where inflation pressure originates. Global upstream oil and gas capital expenditure peaked in 2014 and remained approximately 40 percent below that peak level as recently as 2023, even as demand returned fully to pre-pandemic levels.
You cannot rebuild that supply capacity in a quarter or a year. Commodity production infrastructure is measured in decades. The IMF's April 2026 World Economic Outlook explicitly flags energy prices as the dominant near-term upside inflation risk. That is the consequence of structural underinvestment revealing itself as demand normalizes.
Geopolitical Fragmentation as a Permanent Cost Driver
Trade barriers impose costs. Sanctions redirect supply flows through less efficient routes. Strategic reshoring decisions (manufacturing semiconductors domestically rather than in Taiwan, producing fertilizers regionally rather than importing from sanctioned suppliers) are made on security grounds rather than efficiency grounds. The cost of security is structurally higher prices. This is not a cycle. It is a shift in the global cost structure that persists as long as geopolitical competition between major powers intensifies. And it is intensifying.
Debt and the Limits of Central Bank Independence
The most underappreciated dimension of today's stagflation risk is what I call central bank capitulation. This is the specific mechanism I watch most closely, because it is the event that transforms elevated stagflation risk into an actual stagflation spiral.
Here is the sequence. Government debt levels in the major economies have reached the point where interest payments themselves are becoming a fiscal pressure. When the debt stock is large enough and the maturity structure short enough, rising interest rates translate directly into rapidly rising sovereign debt service costs, which in turn pressure governments toward refinancing at lower rates.
The risk is that this fiscal pressure, combined with stress in sovereign bond markets, forces central banks to begin cutting rates and expanding balance sheets before inflation is genuinely defeated. When markets recognize that dynamic, when they understand that fiscal solvency is effectively prioritized over price stability, inflation expectations de-anchor. Households and businesses stop believing the 2 percent target will be defended.
They price accordingly. The spiral becomes self-reinforcing.
The Annual Reviews paper on Fiscal Dominance documents this as a well-established historical phenomenon, not a theoretical curiosity. The IMF Global Financial Stability Report for April 2026 has explicitly warned that "easing in the presence of fragile disinflation can undermine credibility and lead to a de-anchoring of inflation expectations." The structural preconditions for this scenario are more present in the developed world today than at any point since the late 1970s.
Could We Enter a New Stagflation Cycle?
We are not in stagflation by any formal definition. But the trajectory is concerning in specific, measurable ways.
As of mid-2026, US core services inflation is running at approximately 3.5 percent year-over-year. The IMF's April 2026 Article IV consultation on the United States projects core PCE inflation returning to the 2 percent target during the first half of 2027, but that projection is conditional on no further energy price escalation and no significant deterioration in trade conditions. Federal Reserve policymakers have openly acknowledged they face greater simultaneous upside risk to both inflation and unemployment than at any point in the current cycle. The European Commission's Spring 2026 Economic Forecast is titled explicitly around an "energy shock driving up inflation," not as a hypothetical risk, but as the current operating environment.
Stagflation is not inevitable. But the preconditions like supply-side cost pressure that monetary policy cannot directly reach, debt-constrained central banks, geopolitical disruption to trade, and commodity supply deficits that worsen with each year of underinvestment are more fully assembled today than at any point since the early 1980s.
Era Analyst's Perspective
"What I find important to understand is that today's stagflation risk is not a replay of the 1970s. It is structurally more embedded and in some ways harder to solve. In 1973, you could point to a single trigger: the oil embargo. Remove that supply shock, and the macro environment looks materially different. Today, the cost pressures come from five directions simultaneously.
Deglobalization is permanent, not reversible with a policy change. A decade of underinvestment in energy and metals cannot be undone in a quarter. Geopolitical fragmentation is accelerating, not moderating. And debt loads in major economies have made central banks structurally less free to act than they were when Volcker held the line.
The tipping point I watch for is what I call central bank capitulation, the moment when Treasury market stress and sovereign debt financing pressures become so acute that regulators begin cutting rates and expanding balance sheets before inflation is genuinely defeated. Once markets internalize that financial system rescue is being prioritized over price stability, inflation expectations de-anchor. That is the mechanism that transforms a manageable elevated-inflation environment into a genuine stagflation spiral.
We are not there yet. But the Era Global Risk Index, currently reading 69 out of 100, already reflects broad-based simultaneous deterioration across the structural categories (credit conditions, monetary policy tightness, capital flows, geopolitical risk) that historically precede this kind of environment. Investors who wait for the official announcement are, as always, receiving the information last."
How Investors Often Get Stagflation Wrong
The most dangerous mistake is not pessimism. It is applying a recession playbook to a stagflationary environment. These are not the same conditions, and the strategies that worked in 2001, 2008, and 2020 carry substantially different outcomes in a world where inflation persists through the slowdown.
The first and most common error is rotating into long-duration bonds at the first sign of economic deterioration. In a standard deflationary recession, this works precisely: the Fed cuts rates, bond prices rise, and the investor benefits from both price appreciation and relative safety relative to equities. In stagflation, the dynamic inverts. Bond prices struggle because the central bank cannot credibly cut rates while inflation remains elevated. Real yields on long bonds go deeply negative as nominal yields stay high while inflation erodes the purchasing power of fixed payments. The investor holding a 10-year Treasury in a 6 percent inflation environment is not playing defense. They are systematically destroying real wealth.
The second error is waiting for the V-shaped recovery and the Fed pivot. Every recession since 1990 has, within six to eighteen months, seen the Federal Reserve cut rates aggressively and the equity market recover sharply. That pattern has trained a generation of investors to treat market drawdowns as buying opportunities to wait for peak pessimism and buy the dip. In a stagflation environment, that pivot does not arrive on the same timeline. The Fed cannot cut into persistent 5 percent inflation without risking a re-acceleration of the price spiral. The equity market cannot recover sharply when multiples compress under sustained cost pressure and when the consumer has less real purchasing power every quarter. The V becomes a U, or something that takes years longer than the historical template suggests.
The third error and this one is subtle is holding excessive cash as a defensive measure. It feels conservative. It feels like discipline. But cash earns a fixed nominal return in an environment where the real return is negative whenever inflation exceeds that nominal yield. Sitting in pure cash during a stagflation episode means you are guaranteed to pay the inflation tax every single month. Fiat money loses purchasing power rapidly in this environment, not in a market crash sense, but in a slow, compounding erosion that is less dramatic and no less destructive. The question is not whether you lose real wealth holding cash. You do. The question is what you hold instead.
How to Think About Capital Protection During Stagflation
What I can offer here is the structural logic that drives certain asset classes to perform differently in stagflationary environments. The analytical case is not advice, but it is worth understanding clearly.
Companies with Pricing Power
The first principle of stagflation positioning is finding businesses that can pass rising costs to their customers without losing them. In economic language: pricing power. What this looks like in practice is businesses with genuinely inelastic demand: products or services that customers cannot easily substitute away from even as prices rise. Agricultural inputs, essential consumer goods brands with decades of established loyalty, energy transmission infrastructure, and businesses with near-monopoly positions in critical supply chains tend to sit in this category. The business model that struggles most in stagflation is one whose costs are rising faster than its ability to raise prices. The business that holds value is one where pricing is a lever, not a constraint.
Protective Positioning and Downside Management
In an environment of elevated volatility and uncertain central bank trajectory, active hedging of downside exposure becomes a structural part of portfolio management rather than a tactical afterthought. Long-dated put options on broad equity indices. I specifically use put structures on SPY with extended expiration windows that provide asymmetric downside protection in the scenario where volatility spikes suddenly after extended periods of apparent calm. The premium cost of that protection, correctly sized relative to portfolio risk, is worth paying in environments where the distribution of outcomes is wide and negatively skewed.
Real Cash Flows Over Future Growth Expectations
In the zero-rate environment that defined much of 2010 to 2022, equity valuation was disproportionately driven by the discounted present value of future earnings, which, at near-zero discount rates, inflated the valuation of businesses that were not earning significant cash flows today but were expected to do so eventually.
In a sustained high-inflation environment, discount rates rise, and those future earnings streams are worth meaningfully less in present value terms. The multiple compression this produces is not just a market pricing event. It reflects a genuine structural re-rating. The businesses that hold their value are the ones generating real, tangible cash flows from established operations today, not the ones priced on a 2027 earnings projection that assumes a return to cheap capital.
Real Assets and the Commodity Supercycle
This is where my macro model has the clearest directional view. The structural deficit across energy, metals, food production, and water infrastructure is not a short-cycle imbalance. It is the product of a decade of chronic underinvestment, and the consequences are only beginning to manifest in supply conditions. Our model points to a commodity supercycle as the dominant structural force in real asset markets over the medium term.
Gold occupies a specific position in this framework that is distinct from its role as a simple inflation hedge. It is the only monetary asset that is nobody's obligation. In an environment where central bank credibility is under structural pressure, where sovereign debt is being expanded to finance fiscal deficits, and where the long-term purchasing power of fiat currencies is genuinely in question, gold functions as the monetary reserve of last resort. Goldman Sachs currently forecasts gold reaching $4,900 by December 2026, with sustained central bank buying from China, India, and Poland anchoring structurally higher price levels regardless of short-term volatility.
Energy producers and industrial metals miners represent the production side of the supply deficit. Copper, aluminum, and nickel are structurally short supply in a world simultaneously requiring electrification infrastructure and constraining the exploration and development capital that would normally address that deficit.
Agricultural companies, fertilizer producers, and water infrastructure operators share the same structural characteristic: in a fragmented world where food security has become a matter of national strategy rather than global trade optimization, the businesses controlling critical food production inputs carry a strategic value that extends well beyond their cyclical earnings power.
Which Asset Classes Could Perform Best and Worst?
On the winner's side, the common thread is tangible productive capacity in supply-constrained categories. Precious metals sit here for monetary reasons, gold specifically as a reserve asset carrying no counterparty risk. Energy producers benefit from the supply deficits created by the underinvestment of the past decade combined with ongoing demand that has returned to pre-pandemic levels.
Industrial commodity miners, agricultural companies, fertilizer producers, and water infrastructure operators share the same structural characteristic: physical productive capacity in categories where geopolitical fragmentation has made supply reliability strategic. Companies with genuine pricing power: essential consumer staples, infrastructure operators, businesses with near-monopoly positions in critical supply chains belong in the same category for operational reasons rather than monetary ones.
On the loser's side, the common thread is sensitivity to the combination of rising real rates and compressing multiples. Long-duration sovereign bonds are the most structurally exposed: their nominal payments are fixed, their principal is eroded by inflation, and their market price is depressed by the central bank's inability to credibly cut rates. The equity most at risk is what I call zombie technology companies, businesses whose entire valuation case was built on the assumption of near-zero discount rates and essentially unlimited access to cheap refinancing.
That assumption is not returning in a stagflation environment. These companies lose access to capital; the market repricing of their equity to reflect real discount rates rather than 2021-era ones does the rest. Consumer discretionary gets hit from both ends simultaneously: consumers have less real income to spend on non-essential goods, and the companies serving them face cost pressure they cannot fully pass on to a consumer who is already being squeezed on purchasing power.
How Era Monitors Stagflation Risk
No single indicator identifies stagflation, because stagflation is not a single-dimensional phenomenon. It emerges from the convergence of multiple structural forces: inflation that does not respond to slowing growth, credit conditions that tighten independently of central bank policy, supply-side cost pressures that monetary tools cannot directly reach, and geopolitical developments that continuously reprice the structural cost of global trade.
The Era Global Risk Index monitors all of these simultaneously.
Its six structural categories ( monetary policy conditions, interbank liquidity, credit market stress, capital flows and money supply, labor and consumption dynamics, and geopolitical risk) are precisely the dimensions across which stagflation risk manifests before it becomes visible in any single published indicator. The current reading of 69 out of 100 reflects simultaneous deterioration across monetary, credit, and geopolitical categories in combination. Not one flashing signal. A pattern of concurrent structural stress that historically precedes the kind of environment described throughout this article.
The index is a structural diagnostic, not a calendar. It does not say stagflation will begin in Q3. It measures whether the conditions under which stagflation becomes probable are assembling or dissipating and right now, they are assembling.
What Investors Should Monitor Next
The indicators I watch most closely for evidence that the stagflation scenario is becoming more or less probable are the following. I monitor them not as independent data points but as a connected system, the same structural logic that underlies recession probability assessment.
Inflation expectations embedded in the 5-year/5-year forward breakeven rate matter more than headline CPI, because expectations determine whether price dynamics are self-reinforcing.
Treasury market volatility, specifically MOVE index dynamics and bid-to-cover ratios at auction is the early signal of the sovereign debt stress that would eventually trigger central bank capitulation. Energy price trajectories and commodity supply conditions in copper and agricultural inputs tell you whether supply-side cost pressure is intensifying or beginning to ease.
High-yield credit spreads remain the credit market's real-time verdict on whether financial conditions are tightening in a way that eventually constrains corporate activity. M2 growth and the China Credit Impulse tell you about monetary creation and global demand impulse with a 9-to-12-month forward lead. And real wage growth measured against the CPI tells you whether household purchasing power is deteriorating at a pace that turns demand weakness from cyclical to structural.
No single indicator is sufficient. What you are looking for is simultaneous deterioration across multiple dimensions, the same pattern recognition that distinguishes signal from noise in any complex system, and the same analytical discipline that the Era Global Risk Index was designed to operationalize.
Frequently Asked Questions
What is stagflation?
Stagflation is the simultaneous occurrence of high inflation, weak or stagnant economic growth, and elevated unemployment. It is considered one of the most difficult economic environments to navigate because the standard monetary policy tools that address one problem, raising rates to fight inflation, cutting rates to stimulate growth, actively work against each other when both problems are present at once.
What causes stagflation?
Stagflation typically results from supply-side cost shocks that raise prices regardless of demand conditions, combined with monetary policy that fails to respond credibly enough to prevent inflation expectations from de-anchoring. The 1970s version was triggered primarily by oil supply shocks. Today's structural drivers include deglobalization, chronic underinvestment in energy and commodity production capacity, geopolitical fragmentation, and government debt levels that create implicit pressure on central banks to prioritize financial system solvency over price stability.
Why is stagflation dangerous?
Because it strips central banks of their most effective tools. Raising rates to fight inflation deepens an already contracting economy and accelerates unemployment. Cutting rates to support growth risks making the inflation problem worse. The standard recession playbook (buy long bonds, wait for the Fed pivot, buy the dip in growth equities) fails systematically. Meanwhile, consumer purchasing power erodes continuously as inflation compounds against stagnant or falling real incomes.
What happened during the 1970s stagflation?
An Arab oil embargo beginning in October 1973 quadrupled crude oil prices. A second shock followed the Iranian revolution in 1979 and tripled them again. These supply shocks hit an economy already running loose monetary policy, causing inflation to accelerate to 14.5 percent by 1980 while unemployment exceeded 7.5 percent. The Federal Reserve, under Paul Volcker, ultimately broke the spiral by raising the federal funds rate to approximately 20 percent, engineering deliberate deep recessions in 1980 and 1981 to 1982 that permanently re-anchored inflation expectations at the cost of unemployment near 11 percent.
Can stagflation happen again?
The structural preconditions are more fully assembled today than at any point since the late 1970s: deglobalized supply chains adding structural cost to goods production, chronic underinvestment in commodity supply, geopolitical fragmentation driving trade inefficiency, and government debt levels that create implicit pressure on central banks to prioritize fiscal solvency over price stability. Stagflation is not inevitable. But the probability of a stagflationary episode is meaningfully higher than markets are currently pricing.
What is the difference between stagflation and recession?
A recession is a contraction in economic activity, typically involving GDP decline, rising unemployment, and falling or stabilizing inflation. Stagflation involves rising unemployment and weak growth combined with persistent high inflation rather than deflationary pressure. The critical practical distinction is that recessions are eventually resolved by rate cuts that support both employment and asset prices; stagflation cannot be resolved with rate cuts alone because the inflation component remains elevated.
Which investments perform best during stagflation?
Real assets in structurally supply-constrained categories have historically provided the best inflation protection during stagflationary periods: gold and precious metals, energy producers, industrial commodity miners, agricultural companies, fertilizer producers, and businesses with genuine pricing power. Companies with real, tangible current cash flows outperform those priced on future earnings expectations, as elevated discount rates compress the present value of earnings that are far in the future. Long-duration bonds and consumer discretionary equities tend to underperform most severely.
How do economists measure stagflation?
There is no single official stagflation index. Economists typically assess it by looking at the simultaneous reading of three indicators: a consumer price index for inflation, a GDP growth rate for economic activity, and an unemployment rate for labor market conditions. Structural analysis goes further, examining inflation expectations, real wages, monetary policy constraints, and supply-side cost dynamics to distinguish between a temporary supply shock and a genuinely structural stagflationary environment.
About E.R.A. OF CHANGES
E.R.A. OF CHANGES is an independent macroeconomic research and geopolitical intelligence firm providing institutional-quality analysis to investors worldwide. Our research combines macroeconomics, financial markets, blockchain analytics, and geopolitical risk into proprietary forecasting frameworks designed to identify structural market trends before they become consensus. The Era Global Risk Index, updated daily from 24 structural indicators, serves as the foundation of our analytical methodology, providing a forward-looking measure of systemic financial stress grounded in structural economic evidence rather than market sentiment. Our full methodology, live index reading, and forecast archive are available at eraperemen.info/en.
The content published by E.R.A. OF CHANGES is for informational and educational purposes only and does not constitute financial, investment, legal, or tax advice. All views expressed are the personal analytical perspective of the author. Past forecast accuracy does not guarantee future results. Readers should conduct their own research and consult a qualified financial professional before making any investment decisions.
Sources
- Federal Reserve History: The Great Inflation
- IMF World Economic Outlook, April 2026: Global Economy in the Shadow of War
- IMF Article IV Consultation with the United States, April 2026
- IMF Global Financial Stability Report, April 2026
- Annual Reviews: Fiscal Dominance — Implications for Bond Markets and Central Banking
- S&P Global: The Evolution of Deglobalization
- Sprott: Top 10 Themes for 2026
- Goldman Sachs: 2026 Commodities Outlook
- European Commission: Spring 2026 Economic Forecast
- NBER: The Supply-Shock Explanation of the Great Stagflation Revisited
- Dallas Fed: Lessons from the Destabilization of Inflation in the 1970s
- FRED: Consumer Price Index for All Urban Consumers



