Executive Summary
Blockchain adoption in the corporate world has stopped being a question of belief and become a question of measurement. The honest measurement is unflattering. Excluding stablecoins, tokenised real-world assets total roughly $34 billion — close to double where they stood at the start of 2026, and still around 0.01% of an addressable base exceeding $300 trillion.
Our position is specific. The fastest transition from pilot to production over the last twelve months has been in settlement and collateral — tokenised money market funds and government bonds posted as collateral, plus stablecoin payments. These sit inside live treasury operations, not pilots. Tokenised government bonds and cash funds alone account for $18.3 billion of the $34 billion total, and stablecoin capitalisation has passed $300 billion, with issuers holding over $200 billion of U.S. government debt in reserve.
The clearest remaining hype is building-by-building tokenisation of physical real estate and “blockchain for traceability” in retail supply chains. Real estate grew just 17.9% across 2026 — the weakest performance of any major class on our readiness ranking, in the segment most frequently described as the obvious candidate.
The underrated industry outside finance is cross-border trade and commodity logistics — trade finance, title and shipping documents, letters of credit. The pain there is denominated in days of working capital rather than in ideology, which is the only currency in which enterprise technology purchases are actually settled.
And the dominant structural barrier is neither regulation nor cost. It is systems interoperability compounded by organisational resistance. Blockchain removes intermediaries, and many of those intermediaries are reconciliation teams and middle managers inside the adopting company itself. Projects rarely die in the legal review; they die at the hands of the people whose function the project eliminates.
Key Takeaways
- Settlement and collateral won the production race. Tokenised money market funds and government bonds posted as collateral, plus stablecoin payments, are in live operation. Everything else trails by a wide margin.
- Depth, not breadth, is the binding constraint. Penetration is approximately 0.01% of the addressable base, and roughly $12 of every $100 of tokenised capital is actually working in on-chain applications. A hypothetical $10 billion of parked tokenised assets can generate less economic value than $2 billion that trades continuously, is pledged as collateral and produces fees.
- Real estate is the most overrated candidate for tokenisation, not the most obvious one. Growth of 17.9% in 2026 against 390% for tokenised equities settles the argument. The realistic first stage is REITs and funds, not individual buildings on a ledger.
- Tokenised equities are the main source of long-term expansion — $4.4 billion, up 390% year-to-date, with monthly trading volume rising from $237 million in January to $8 billion in August 2026 — but they face more structural obstacles than the cash-and-bond tier.
- The underrated non-financial sector is cross-border trade and commodity logistics, where the prize is days of working capital released from documentary processes rather than a narrative about transparency.
- Interoperability plus internal resistance outranks regulation and cost. Regulatory uncertainty delays projects; interoperability makes them expensive to finish; organisational resistance kills them silently.
- Confidentiality is the missing layer, not a later feature. Privacy-oriented capacity grew from roughly $6 billion to around $30 billion in a year. Institutional capital has always migrated to where it cannot be observed: dark pools and off-exchange trading crossed 50% of U.S. equity volume by 2025.
Introduction: Where Adoption Actually Stands
Every year since 2017 has been described as the year enterprise blockchain finally arrived. The claim has been wrong often enough that the sensible response is to stop asking whether adoption is happening and start asking which function, in which industry, with which profit-and-loss line attached. Start with the aggregate. Tokenised real-world assets excluding stablecoins stand at roughly $34 billion, having nearly doubled since the beginning of 2026. Against an addressable base above $300 trillion, that is a penetration rate of approximately 0.01%.
What the aggregate tells you is that the technology has not changed how the financial system works. It has changed how a handful of specific processes work, and those processes are concentrated in a narrow band: cash management, collateral, and payment settlement. Outside that band, the picture is dominated by announcements rather than throughput.
There is a second, more interesting observation buried in the data. Even within the $34 billion already tokenised, only a minority is doing anything. On our estimate, approximately 12% of tokenised capital is active inside on-chain applications — traded, pledged, lent against or otherwise used. The remaining 88% is a digital wrapper sitting still. That is the state of adoption as of October 2026: a small base, growing fast, mostly inert.
Measuring Adoption Without Fooling Yourself
Before ranking anything, the measurement problem needs solving, because the standard metric — total value tokenised — is close to useless for investment purposes. It is a stock measure of wrapping activity, and says nothing about whether the wrapped assets do anything once wrapped.
We use two ratios instead. They are deliberately simple, because complicated proprietary indices in this sector are usually marketing.
PAR — the depth of tokenisation
PAR measures tokenised value against the addressable base of the asset class. At aggregate level it sits at roughly 0.01%. Its main use is as a check on enthusiasm: when somebody describes tokenisation as having transformed capital markets, PAR ends the conversation.
CAR — the share of tokenised capital that works
CAR measures how much of the tokenised stock is genuinely employed: traded, used as collateral, deployed in lending, or generating fee income. Our current estimate is approximately 12% — about $12 of every $100.
CAR is the more important of the two, and it is almost never published. The reason is uncomfortable: a high headline figure combined with a low CAR means the industry has built a parking garage and is describing it as a motorway.
Why $2 billion working beats $10 billion parked
This is the central analytical point of the report, so it is worth stating without hedging. A hypothetical $10 billion of tokenised assets sitting in wallets can generate less economic value than $2 billion that trades continuously, is pledged as collateral, is rehypothecated within sensible limits, and produces fees at every step. Value in financial infrastructure is a function of velocity and reusability, not of stock.
That is why the next stage of tokenisation is not about moving more value on-chain. It is about making the value already there liquid, programmable and repeatedly usable. Growth in the headline number without a corresponding rise in CAR is growth in reporting, not in utility.
Hence the filter we apply to every blockchain story, in strict order: is capital actually flowing — total value locked, volume, fees; is the use of that capital growing; and only then, can the project monetise the flow. Growth in users and volumes does not establish investment merit. The sequencing is set out in the E.R.A. forecasting methodology.
What Moved From Pilot to Production in the Last Twelve Months
The fastest transition from pilot to industrial deployment over the past twelve months has been in settlement and collateral. Not supply chains, not identity, not traceability — the plumbing that moves cash and posts margin.
Tokenised money market funds and government bonds as collateral
Tokenised government bonds and cash funds now account for $18.3 billion of the $34 billion total. That concentration is not an accident of fashion. These instruments are standardised, their legal treatment is settled, their valuation is uncontroversial, and their holders already run the custody and compliance machinery required.
The function that drove the shift is collateral. A tokenised money market fund can be posted as margin and transferred in minutes while continuing to accrue yield, so the holder no longer chooses between yield and mobility. In effect the instrument becomes on-chain money that pays interest.
There is also a structural reason this tier moved first. Institutions had already spent years building the operational muscle for holding a market exposure inside a standardised, transferable wrapper rather than holding the underlying — the same muscle described in our analysis of ETF flows and their price impact. Adoption is always fastest where the behaviour already exists and only the plumbing changes.
Collateral mobility is also one of the few inefficiencies in institutional finance where the cost is precisely quantifiable: a treasurer can calculate what it costs to hold idle cash against intraday margin obligations. When the saving is calculable, the decision moves out of the innovation budget and into the operations budget — and that transition is what distinguishes production from pilot.
Stablecoin payments and corporate treasury operations
Stablecoin capitalisation has passed $300 billion, and issuers hold more than $200 billion of U.S. government debt as reserve assets. The second figure is the more significant one: it makes stablecoins a non-trivial source of demand for Treasury securities, which converts them from a crypto-market phenomenon into a component of sovereign funding.
On the corporate side, the use case that shipped is cross-border payment and intraday liquidity movement. The appeal is mundane: settlement finality in minutes rather than days, operation outside banking hours, and removal of correspondent-banking hops that each add cost and failure points.
We would add the caveat the sector systematically understates. A stablecoin is a credit instrument with an issuer, a reserve portfolio and a redemption mechanism, and all three can fail. The risks are specific and documented, and we examine them in stablecoin risks explained. Treasurers using these instruments for operational float are taking a counterparty exposure that does not appear in the pitch deck.
Delivery-versus-payment settlement
The settlement layer advanced measurably in 2026. In October an open delivery-versus-payment standard with atomic execution was presented on Solana. Atomic execution means the asset leg and the cash leg either both complete or neither does, removing settlement risk from the transaction rather than managing it.
One point requires precision, because it has been widely misreported. J.P. Morgan participated as an expert contributor to the development of that standard. It did not commit to using it. Expert participation signals that a large institution considers the design worth influencing, which is meaningful, but it is not a commitment of volume. Treating participation as adoption is exactly the error that produced a decade of overstated enterprise blockchain forecasts.
The precedent that does represent real throughput is earlier and smaller. In December 2025 a $50 million commercial paper issuance was arranged with delivery-versus-payment settlement in USDC. Fifty million dollars is not a systemic event. It is a completed transaction in a real instrument with real counterparties, which is worth more analytically than a consortium announcement with ten logos on it.
What Is Still Hype
The hype category is not defined by technological impossibility. Most of it is technically feasible. It is defined by the absence of a buyer with a quantified problem.
Building-by-building tokenisation of physical real estate
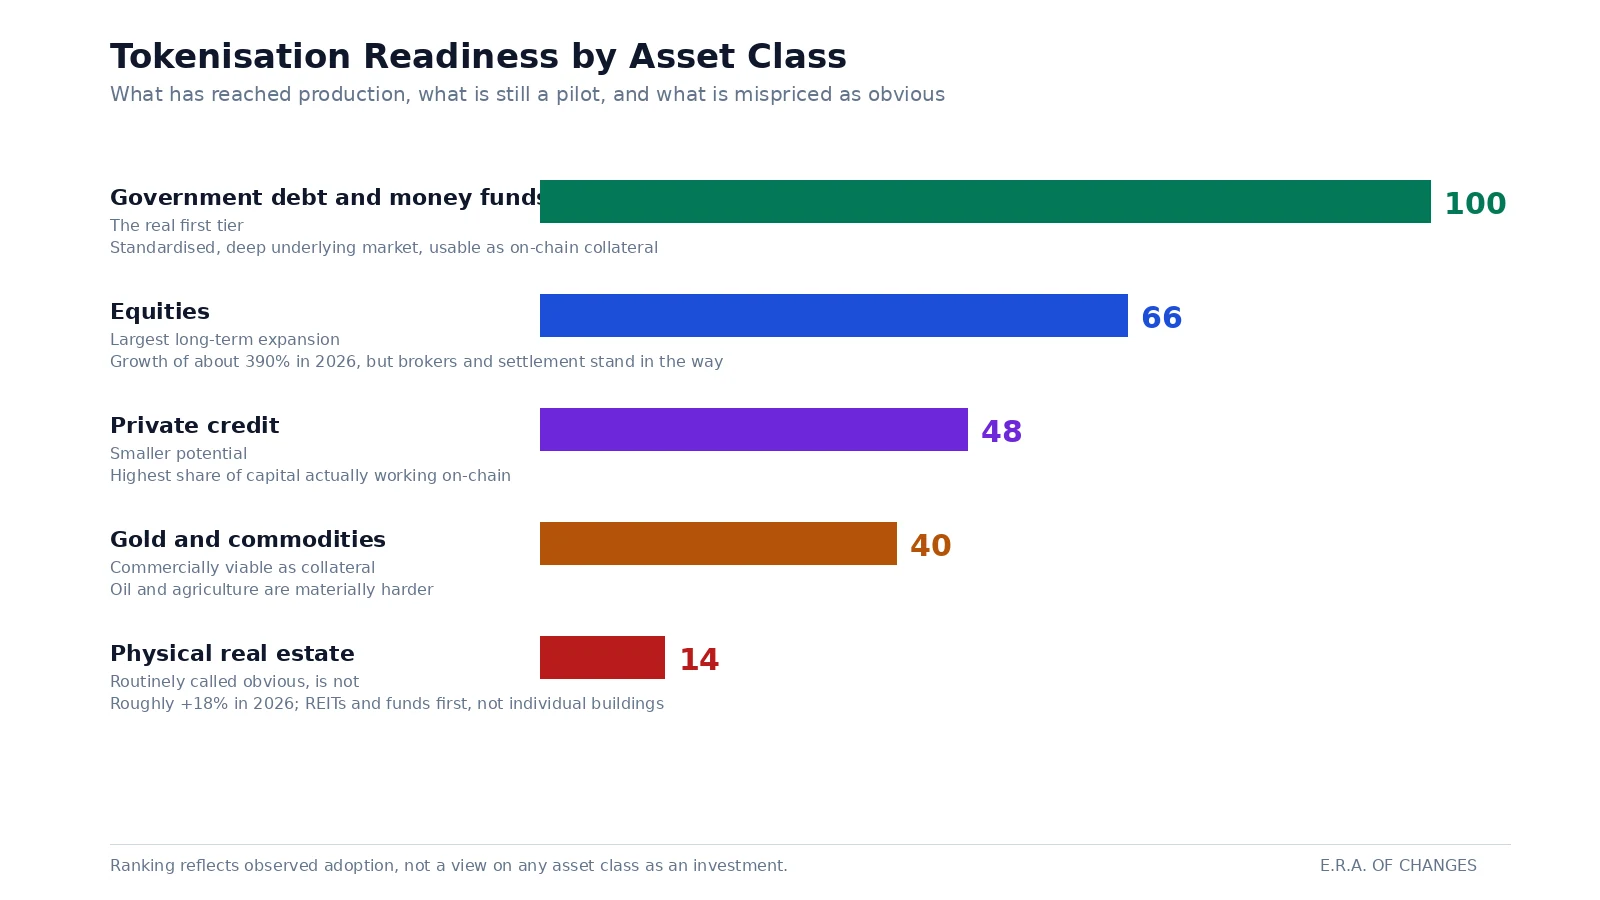
Real estate is described more often than any other class as the obvious candidate: large illiquid assets, high minimum investment sizes, slow transfers, opaque pricing. Put the building on a ledger and fractionalise it. In practice it is one of the hardest segments in the field, and the data says so. Tokenised real estate grew 17.9% across 2026 — against 390% for tokenised equities and 46.6% for commodities. That is not a slow start. That is a segment with sustained attention, substantial capital and favourable press producing the weakest growth on the board.
The reasons are structural rather than technical. Title to real property is a creature of local law and local registries; a token is not the asset but a claim on a vehicle that holds it, enforceable only in a jurisdiction with no obligation to recognise the ledger. Valuation is appraisal-based and infrequent, so there is no continuous price to trade against. Each building is idiosyncratic, so there is no fungibility and therefore no depth. Management obligations do not tokenise at all. And the investor who wanted fractional property exposure already had a listed instrument available.
The realistic first stage is tokenising REITs and property funds — already standardised, already valued, already fungible claims — rather than converting individual buildings into tokens. That is a smaller and less exciting proposition, which is precisely why it is more likely to work.
Blockchain for retail supply-chain traceability
The second durable hype category is traceability in consumer supply chains: provenance of food, luxury goods, retail pharmaceuticals. These projects have been announced continuously since 2017, and continue to be announced, extended and quietly discontinued.
The failure mode is economic, not technical. A blockchain guarantees that a record has not been altered after it was written. It guarantees nothing about whether the record was true when written. The expensive part of verification is the physical attestation at the point of origin, and that cost is unchanged by the ledger underneath it.
The beneficiary is also diffuse. If a retailer spends to prove provenance, the benefit accrues partly to consumers, partly to regulators and partly to competitors who free-ride on the standard. Projects with concentrated costs and diffuse benefits do not survive the second budget cycle.
The tell: who pays, and in what currency of pain
There is a reliable diagnostic for separating production from hype, and it has nothing to do with the technology stack. Ask who writes the cheque, and what that person’s pain is denominated in. If the answer is “days of working capital”, “basis points of financing cost” or “headcount in reconciliation”, the project has a chance. If the answer is “transparency”, “trust” or “innovation positioning”, it is a pilot with a press release attached, and it will be defunded in the first cost-cutting cycle.
Asset-Class Readiness: A Ranking
Ranking is the analytical work. Lists of asset classes with equal weight are how research avoids being wrong in public. Here is ours, in order of genuine readiness rather than potential market size.
Tier one: government bonds and money market funds
$18.3 billion, and the only tier that has genuinely arrived. Standardised instruments, settled legal treatment, uncontroversial valuation, and a clear function: on-chain money that pays a yield.
Tier two: equities
$4.4 billion, up 390% since the start of 2026, with monthly trading volume rising from $237 million in January to $8 billion in August 2026. On growth and turnover this is the most dynamic segment on the board, and in our view the principal source of long-term expansion.
The volume figure matters more than the stock figure. A thirty-fold increase in monthly turnover against a much smaller increase in outstanding value means CAR for this segment is rising — the tokenised equity base is being used, not parked. That is the behaviour that distinguishes an emerging market structure from a wrapper.
The obstacles, though, are more numerous than in tier one. Equity carries voting rights, dividend entitlements, corporate-action handling and jurisdiction-specific securities law. Each requires an answer, and in several large jurisdictions the answer remains provisional. The regulatory dimension here is substantive rather than cosmetic, and we treat it in our survey of cryptocurrency regulation.
Tier three: private credit
Smaller potential than the tiers above, but with a notably high degree of actual capital utilisation. Private credit is already illiquid by design, bilaterally negotiated, and administered through expensive manual processes. Tokenisation does not need to create liquidity to add value; it only needs to cut administration and improve the pledgeability of the position.
The segment therefore punches above its weight on CAR while remaining modest on PAR — more interesting than its size suggests.
Tier four: gold and commodities
The commodity segment grew 46.6% in 2026, second only to equities. Tokenised gold is viable specifically as on-chain collateral: fungible, continuously priced, globally recognised and already held in custodial structures built for the purpose.
The use case is narrower than the enthusiasm around it. Tokenised gold is unlikely to change how gold is owned. It is quite likely to change what gold can be pledged against, and in a stress environment the ability to post a hard asset against an obligation without selling it has evident appeal. Readers following the metal itself will find our view in the gold price 2026 forecast.
The overrated candidate: real estate
Last, and deliberately so: growth of 17.9% in 2026, in the asset class most often named as the obvious application. This is the clearest case of perceived readiness exceeding actual readiness.
We would change this assessment on specific evidence: statutory recognition of token-based title in at least two major jurisdictions, plus the emergence of continuous secondary pricing for tokenised property claims. Neither exists at scale today.
The Underrated Industry: Cross-Border Trade and Commodity Logistics
Set aside financial services, where the adoption story is well covered, and the most underrated sector for genuine deployment is cross-border trade and commodity logistics — trade finance, title and shipping documentation, letters of credit, and the documentary chain governing the movement of bulk goods.
Why the pain here is measurable
Trade documentation is the rare enterprise process where the cost of inefficiency is both large and precisely quantified, in a unit finance directors already track: days.
A cargo cannot be released without documents. Documents move through banks, insurers, inspectors, customs agents and shipping lines, largely as paper or scanned paper, with manual verification at each handoff. Every day of delay is a day of financing cost, a day of demurrage exposure, and a day of working capital tied up in goods that are neither sold nor usable.
That is an invoice, not an ideology. A commodity trader can tell you what a five-day documentary delay costs on a given cargo to two decimal places, and when the saving is that legible the procurement conversation changes character entirely.
What the technology actually replaces
The function being replaced is not record-keeping. It is trusted simultaneity: assurance that transfer of title and transfer of payment happen together, across parties who do not trust each other, in jurisdictions with different legal systems, without a single central operator all of them accept.
This is the same primitive that made delivery-versus-payment work in securities, applied to physical goods. It is the one thing distributed ledgers do that existing systems genuinely struggle with, because the alternative — a trusted central intermediary — is exactly what cross-border trade lacks. No single bank, port authority or insurer has the standing to arbitrate a global commodity flow.
The sector also sits at the intersection of two forces we track separately: fragmentation of settlement arrangements as currency blocs diverge, and the operational burden of compliance screening. Both are examined in our work on de-dollarisation and on economic sanctions and global trade. A trading house operating across divergent settlement arrangements has a stronger incentive to adopt neutral infrastructure than one sitting comfortably inside a single bloc.
Why it has stayed quiet
If the case is this clear, why so few headlines? Three reasons, all of which argue for the sector rather than against it. Trading houses do not publicise operational improvements that constitute competitive advantage. Adoption is bilateral and incremental rather than consortium-wide, so it produces throughput without a launch event. And the legal groundwork arrived late and quietly: electronic trade document legislation has only recently made digital bills of lading enforceable rather than merely convenient — a precondition for everything else that received almost no coverage.
What would confirm or refute this call
We are putting a specific test on it. By the end of 2027 we would expect at least one of the following: a major commodity trading house disclosing a quantified reduction in documentary cycle time attributable to digital title transfer; a tier-one trade finance bank reporting a material share of letters of credit issued on shared infrastructure; or a significant insurer pricing digital documentation differently from paper. If none appears, this call is wrong and we will record it as wrong rather than extend the deadline.
Ranking the Structural Barriers
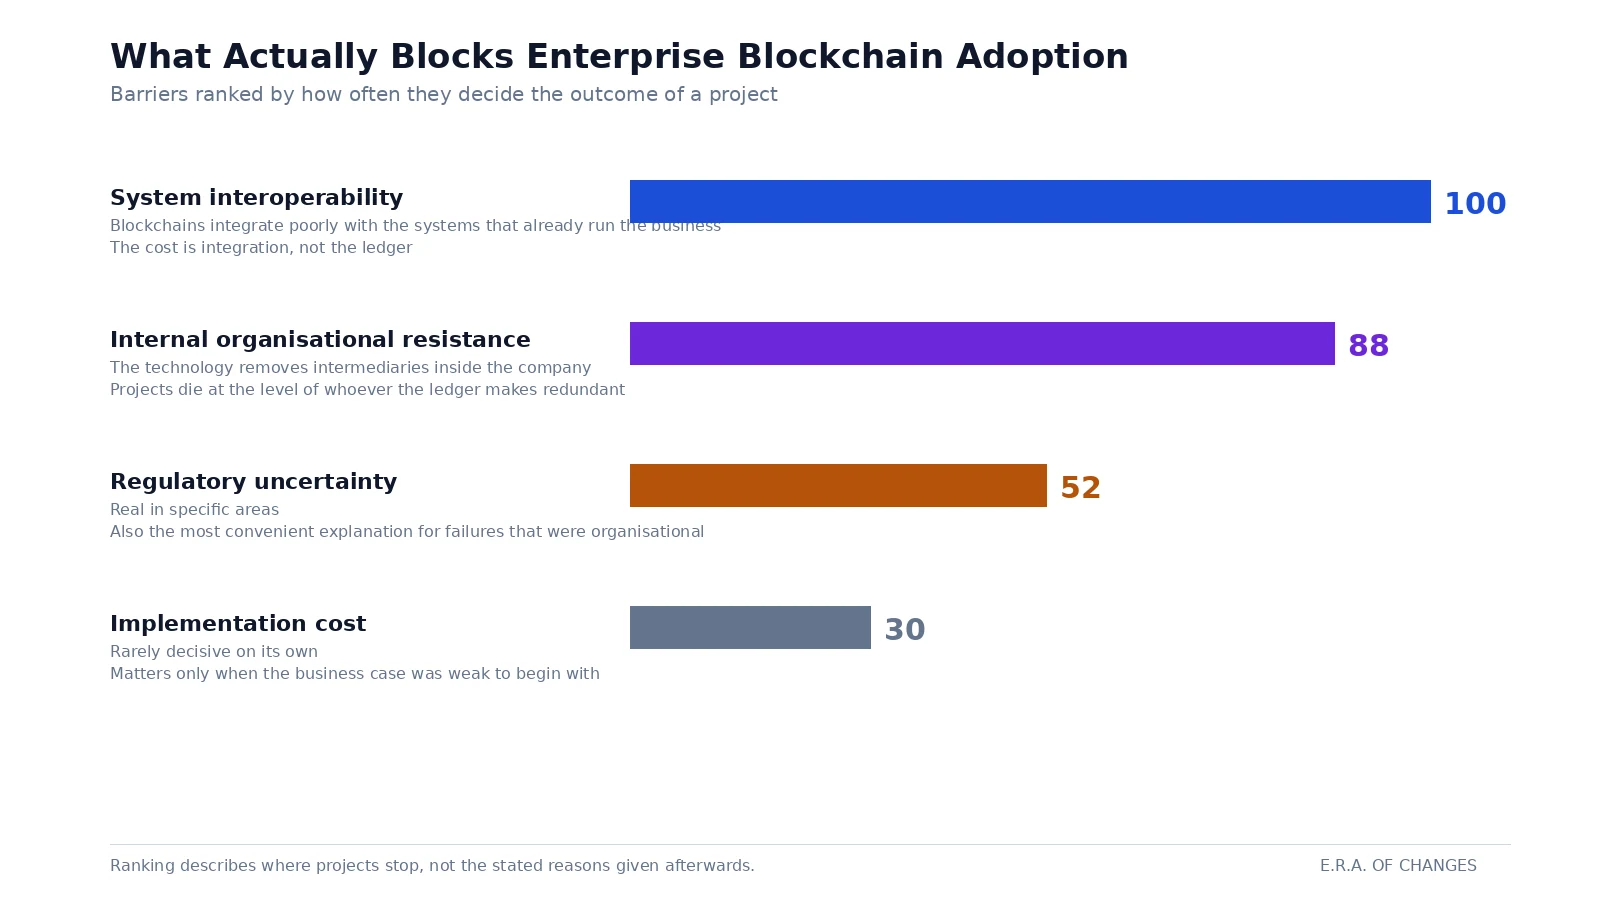
Four candidates are routinely offered for what holds back corporate adoption: regulatory uncertainty, systems interoperability, implementation cost, and internal organisational resistance. They are almost always presented as a list of equals. Ranking them is the entire point, because the remedy differs completely depending on which one binds.
Fourth: implementation cost
Cost is the barrier most often cited by vendors, because it is the one they can offer to solve. It is also the weakest.
Large institutions spend enormous sums annually on technology, and a ledger integration is not expensive relative to a core banking migration or an enterprise resource planning programme. Where cost is the stated reason for abandoning a project, it is usually a proxy for something else: the business case was never quantified, so any cost looked excessive.
Third: regulatory uncertainty
Regulatory uncertainty is real, and it is the barrier most frequently placed first in industry commentary. We rank it third, for empirical rather than contrarian reasons.
Uncertainty changes the timing and the structure of adoption without preventing it. Institutions facing an unsettled rulebook respond by using permissioned infrastructure, by confining activity to jurisdictions that have published a framework, and by choosing instruments whose legal character is not in doubt — which is precisely why the government bond and money fund tier led the production race. The regulation problem routed adoption rather than blocking it.
The direction of travel matters more than the current state of the rulebook, and it moved considerably during 2026. We track those changes in our review of crypto regulation updates for 2026, because the sequence in which jurisdictions settle their frameworks determines which instruments can be tokenised first.
There is also a confounding factor worth naming. Regulatory uncertainty is the most convenient available excuse for a project that failed for internal reasons. “We are waiting for regulatory clarity” is a statement no executive committee will challenge, which makes it the preferred epitaph for initiatives that actually died of organisational resistance. Analysts who take stated reasons at face value will systematically overweight this barrier.
Regulation still determines which assets can be tokenised at all. How institutions have responded to the rulebook as it stands is covered in institutional crypto adoption and, for regulated product wrappers, in Bitcoin ETF adoption.
Second: systems interoperability
Now we reach the barriers that actually bind.
Interoperability is the problem of making a distributed ledger communicate with everything a large organisation already runs: the core banking system, the general ledger, the risk engine, the regulatory reporting stack, and the messaging standards connecting the firm to its counterparties. None of these was designed for an environment where the authoritative record sits outside the institution.
The consequence is that a blockchain deployment in a large firm is rarely a replacement. It is an addition — which means the organisation now maintains two sources of truth and a reconciliation process between them. That is the opposite of the promised benefit, and it is the most common reason production deployments fail to scale beyond their initial scope.
There is a second-order version across firms. A ledger delivers value proportional to the number of counterparties on it, so early adopters pay full integration cost for partial benefit. That is a textbook coordination failure, and it explains why the use cases that shipped were ones where participants already shared standards and a regulatory perimeter.
First: organisational resistance
Blockchain devalues the role of intermediaries. That is the entire proposition. What the proposition omits is that a large share of those intermediaries are not external parties. They are departments and managers inside the adopting organisation: reconciliation functions, settlement operations, documentary checking units, and the managers whose authority derives from controlling a handoff between systems.
Consider who is handed the task of implementing a technology whose deployment eliminates their own function, and what a rational person in that position does. They do not sabotage the project; sabotage is visible and career-limiting. They do something far more effective: they raise legitimate concerns.
Each concern is individually reasonable. The control framework needs review. The audit trail requires a formal opinion. The disaster recovery scenario is untested. The scope should be narrowed for the first phase to manage risk. None of these is obstruction; all are defensible. Collectively they extend the timeline past the patience of the sponsor and the life of the budget line, and the project ends as a “successful pilot” that is never scaled.
This is why adoption statistics look the way they do. The projects that succeeded were ones where the eliminated intermediary was external — a correspondent bank, a settlement agent, a counterparty’s back office — and the internal team was a beneficiary rather than a casualty. Collateral mobility made the treasury function more powerful; stablecoin payments made the payments team faster. Neither threatened the people implementing it.
Why the combination is worse than either part
These two operate as one mechanism. Interoperability problems provide an inexhaustible supply of technically legitimate objections; organisational resistance supplies the motive to raise them. A project blocked purely by integration difficulty gets more engineers. A project blocked purely by politics gets escalated to a sponsor. A project where the politics expresses itself as valid technical concerns is almost unkillable, because every individual objection has a correct answer and answering all of them takes longer than the budget lasts.
The practical implication: look at the organisational chart before the architecture diagram. If the function being automated away reports into the sponsoring executive, the project has a chance. If it reports elsewhere, or if the implementation team is the function, discount the timeline heavily however good the technology is.
Confidentiality Is the Missing Layer, Not a Later Feature
There is a fifth constraint that does not belong in the barrier ranking because it is not a barrier in the same sense. It is a missing component, and it explains the gap between where several asset classes stand today and where the capital that would use them actually sits.
Public blockchains are transparent by design. Every position, counterparty relationship and transaction size is visible to anyone who looks. For a retail user this is a feature. For an institution it is disqualifying.
Why transparency is a hard stop for institutional capital
Consider what a large asset manager would reveal by operating on a transparent ledger: the size and direction of its positions, the timing of its rebalancing, its counterparty concentrations, and — by inference — its strategy. Competitors would observe it; counterparties would price against it.
No fiduciary can accept that. This is not a preference to be educated away; it is a structural requirement of managing other people’s money in a competitive market. Which is why we state it plainly: confidentiality is not a feature that can be added later. It is the missing layer between where an asset class sits today and where the capital that would use it actually is. Any forecast treating privacy as an optional enhancement has mislocated the bottleneck.
The dark pool parallel
The historical evidence is unambiguous, and it comes from equities rather than crypto. Institutional capital has consistently migrated towards venues where its activity is not observable. Dark pools and off-exchange trading grew from a marginal share of U.S. equity volume to more than 50% by 2025.
More than half of trading in the most transparency-oriented equity market in the world now happens away from the visible order book, purely because institutions preferred not to be seen. Anyone forecasting that institutional capital will accept full transparency in exchange for faster settlement is forecasting against half a century of observed behaviour by the same participants.
What the data suggests is already happening
The market appears to be reaching the same conclusion. Capacity in privacy-oriented infrastructure grew from roughly $6 billion to around $30 billion over the past year — a fivefold increase, against a doubling in the broader tokenised asset base.
We will not over-read a single growth rate: an increase from a small base can reflect speculative positioning as much as institutional deployment. But the ordering is suggestive — privacy capacity is growing faster than the assets that would need it, as one would expect if the constraint were being addressed ahead of demand.
The investment implication follows from our standard filter. Privacy infrastructure is a candidate for capital flow before it is a candidate for monetisation, and anyone buying the third stage at the first stage’s valuation is buying a narrative. On the relationship between capital flow and asset pricing, see global liquidity explained.
This is also where a correct adoption thesis most often becomes a poor position. Infrastructure tokens are how most investors try to express a view on adoption, and a thesis that plays out over five years, expressed in an instrument that can lose two-thirds of its value in a quarter, requires sizing that assumes being early — the discipline set out in our work on crypto portfolio management. Being right about the trend and wrong about the size of the bet is the standard way this sector takes money from correct analysts.
Three Adoption Scenarios to 2030
We publish scenarios with probabilities rather than a single projection, because a single projection hides the mechanism by which it could fail. All three are framed over the 2026–2030 horizon and assume no systemic crisis severe enough to freeze institutional technology budgets; the monitoring framework for that tail is in financial stress indicators explained.
Scenario A: Collateral-led institutionalisation (base case, ~50%)
Adoption continues to be driven by the settlement and collateral tier. Tokenised cash funds and government bonds become routine collateral across major clearing and margin arrangements, stablecoin payments become standard for corporate cross-border flows, and privacy infrastructure matures enough to allow institutional participation at scale.
The headline figure grows substantially but remains a small fraction of the addressable base — PAR improves by an order of magnitude and is still measured in tenths of a percent. The important change is CAR: the share of tokenised capital actually working rises materially above the current 12%, because the assets being added exist to be used rather than held.
Implication: value accrues to infrastructure that captures fees on velocity — settlement, collateral mobility, confidentiality — rather than to platforms measuring success in assets wrapped.
Scenario B: Fragmented private rails (~35%)
Interoperability and organisational resistance prove more binding than in the base case. Large institutions build permissioned infrastructure that works well internally and interoperates poorly across firms. Each major bank, exchange and trading house operates its own rail.
Adoption is real but captures only a fraction of the available benefit, because the network effects never arrive. Settlement improves within institutions and remains slow between them, and CAR stagnates or falls, because assets on a rail with few counterparties cannot be reused. We assign this a substantial probability rather than treating it as a pessimistic tail: the default outcome of a coordination problem is failure to coordinate.
Implication: the winners are integration and reconciliation providers — the firms that make incompatible systems talk to each other — not the ledgers. This is the scenario least favourable to public-chain valuations and most favourable to unglamorous middleware.
Scenario C: Broad programmable finance (~15%)
The optimistic case. Regulatory frameworks converge sufficiently across major jurisdictions, confidentiality is solved convincingly, and interoperability standards achieve genuine cross-firm adoption. Tokenised assets become programmable at scale: collateral that rebalances automatically, instruments that settle conditionally, financing priced against live asset state.
Here the second-order effects dominate the first-order ones. The value is not in the assets being tokenised but in what becomes possible once a large pool of value is simultaneously liquid, programmable and reusable — financial structures that cannot currently exist because the operational cost of maintaining them is prohibitive.
Implication: returns skew heavily towards whoever owns the standard. It is also the scenario in which most current valuations would be retrospectively justified, which is precisely why the industry forecasts it as its base case.
What distinguishes the scenarios in practice
Not the headline tokenisation figure — all three produce growth in that number, which is why it is a useless discriminator. The discriminator is CAR. In scenario A it rises moderately. In B it stalls. In C it rises sharply. Anyone wanting to know which path the market is on should track the share of tokenised capital in active use, and treat total value tokenised as the vanity metric it is.
Common Mistakes in Reading Blockchain Adoption
Confusing participation with commitment. An institution contributing expertise to a standard is not an institution committed to using it. The October 2026 delivery-versus-payment standard is the live example: expert participation by a major bank was widely reported as adoption. It was not, and the distinction is the difference between a signal and a transaction.
Treating total value tokenised as the measure of success. Stock without velocity is a parking garage. Ask what share is being traded, pledged or lent against before drawing any conclusion from the headline figure.
Assuming the obvious candidate is the ready candidate. The assets that moved first were the standardised, already-digital ones, because standardisation — not illiquidity — determines readiness.
Mistaking a pilot for a deployment. A pilot is funded by an innovation budget and measured in learnings. A deployment is funded by an operations budget and measured in cost reduction. The budget line, not the technology, tells you which one you are looking at. Related: “awaiting regulatory clarity” is the most frequently given reason for failure and rarely the operative one, because it is the only explanation that embarrasses nobody.
What This Framework Cannot Tell You
Three honest limitations, because a framework presented without them is a sales document.
It cannot measure private deployment. Our PAR and CAR estimates are built on observable on-chain activity and disclosed institutional programmes. Permissioned infrastructure operated inside institutions is largely invisible to us. If scenario B is unfolding, we are understating adoption while correctly identifying its limits — and we would not detect that error quickly.
It cannot time regulatory or coordination events. Our ranking says interoperability and internal resistance bind harder than regulation. It does not say when a sufficiently large participant will force a standard, and that kind of event is discontinuous. One decision by one systemically important institution could compress a five-year timeline into eighteen months.
It cannot convert adoption analysis into asset selection. Identifying that settlement and collateral won the production race says nothing about which instrument captures the economics of that win. Technology investing is full of correctly identified transitions that enriched nobody who was early. Our filter — flow, then usage, then monetisation — manages this gap rather than closing it.
E.R.A. OF CHANGES Analyst’s Perspective
I am asked regularly why our tokenisation work reads as more sceptical than the rest of the sector while our conclusions are, in substance, constructive. The answer is that I am sceptical about the metric, not about the technology.
The industry has spent a decade reporting the wrong number. Total value tokenised measures how much paperwork has been converted into a different format, and it is reported precisely because it grows reliably whether or not anything useful is happening. I have sat through a great many presentations in which that figure rose impressively and nobody could tell me what share of it was doing anything at all.
When you do ask, the answer is roughly 12%. Twelve dollars in every hundred are working; the other eighty-eight are wrapped and parked. That is the single most important fact about this sector in 2026, and the one nobody puts on the first slide.
On the barrier question I will be blunter. Everyone talks about regulation. Regulation is a real constraint and also the universally accepted excuse, which is why it dominates the conversation. The projects I have watched die did not die in the legal review. They died in the control framework review, the audit opinion, the key management assessment and the phase-one scope reduction — a sequence of entirely legitimate concerns raised by competent people whose jobs the project was designed to eliminate.
Nobody in that chain acted badly — that is what makes it so effective. You cannot escalate a problem consisting entirely of valid objections, and you cannot name the real issue out loud without accusing colleagues of self-interest. So the project becomes a successful pilot and the production rollout quietly never happens.
Where is my own record weakest? Timing. I have been directionally right about collateral mobility and consistently early on when it would scale. I also expected trade documentation to move faster than it has, and the reason it did not is instructive: the legal precondition — enforceability of electronic trade documents — arrived years after the technology was ready, and I underweighted it. That is a correction I am stating rather than quietly dropping, and readers should apply the same discount to the dates here that I apply to my own.
How E.R.A. OF CHANGES Uses This in Its Research Process
Blockchain adoption is not analysed as a technology sector in our process. It enters as one expression of a broader view on liquidity, settlement infrastructure and the fragmentation of the international payment system. If our technology conclusions imply a different regime from our macro conclusions, we treat that as an error in the framework rather than as a balanced set of opinions.
Ranked, not listed. We state which barrier binds and which asset class leads. A list of four equally weighted barriers cannot be wrong, which is exactly what makes it worthless.
Measured on utilisation, not on stock. We track CAR alongside PAR for every segment. A segment whose outstanding value grows while utilisation falls is deteriorating.
Falsification conditions with review dates. Every claim here that could be wrong has a stated test. The trade finance call is tested by the end of 2027. The real estate assessment changes on statutory title recognition in two major jurisdictions plus continuous secondary pricing. The barrier ranking changes if projects with strong internal sponsorship fail on regulatory grounds specifically. Interim review date: 30 April 2027.
A structural view that depends on a coordination outcome carries a different error profile from one that depends on a price level, and we model those separately; the mechanics are in our risk modelling methodology and our forecasting methodology. The market context for this analysis is in the Bitcoin market outlook for H2 2026.
Frequently Asked Questions
Which blockchain use case moved fastest from pilot to production in 2026?
Settlement and collateral. Tokenised money market funds and government bonds used as posted collateral, together with stablecoin payments, are the only corporate use cases operating at genuine production scale. Tokenised government bonds and cash funds account for $18.3 billion of the roughly $34 billion in tokenised real-world assets excluding stablecoins.
Which blockchain use case is still mostly hype?
Tokenisation of individual physical properties and blockchain-based traceability in retail supply chains. Real estate grew only 17.9% in 2026 despite being the most frequently named candidate, and traceability projects fail economically because a ledger secures the record without verifying the physical attestation behind it.
How large is the tokenised real-world asset market?
Approximately $34 billion excluding stablecoins, close to double its level at the start of 2026. Against an addressable base above $300 trillion, that is a penetration rate of about 0.01%.
Which asset class will drive the next phase of tokenisation growth?
Equities. The segment stands at $4.4 billion, up 390% since the start of 2026, with monthly trading volume rising from $237 million to $8 billion over January–August 2026. Volume growth outpacing stock growth is the significant part: the base is being used rather than parked.
What percentage of tokenised assets is actually being used?
Roughly 12% — about $12 of every $100 — is active in on-chain applications through trading, collateral, lending or fee generation. The remaining 88% is wrapped and held. This ratio matters more than the headline tokenisation figure.
Why is real estate tokenisation harder than it looks?
Title is governed by local law and local registries, so the token is a claim on a holding vehicle rather than the asset itself. Valuation is appraisal-based and infrequent, each property is idiosyncratic so there is no fungibility or depth, and management obligations do not tokenise. The realistic first stage is tokenising REITs and property funds, not individual buildings.
Which industry outside finance is most underrated for blockchain adoption?
Cross-border trade and commodity logistics — trade finance, title and shipping documents, letters of credit. The inefficiency there is measured in days of working capital rather than in abstractions, and the function the technology replaces is trusted simultaneity between parties with no common central intermediary.
What is the biggest barrier to corporate blockchain adoption?
Systems interoperability combined with organisational resistance, not regulation or cost. Blockchain devalues intermediaries, and many of those intermediaries are departments inside the adopting company. Implementation fails at the level of the people whose function disappears, usually expressed as a sequence of legitimate technical and control objections.
Is regulatory uncertainty really holding blockchain back?
It changes the timing and structure of adoption rather than preventing it. Institutions responded to an unsettled rulebook by using permissioned infrastructure and instruments whose legal character is not in doubt, which is why the government bond tier led. Regulation is also the most convenient stated reason for projects that failed internally, which causes analysts to overweight it.
How much are stablecoins used in corporate payments?
Capitalisation has passed $300 billion, with issuers holding over $200 billion of U.S. government debt as reserves. The production use case is cross-border payment and intraday liquidity movement. The trade-off is counterparty exposure to the issuer and its reserve portfolio.
Did J.P. Morgan commit to using the new on-chain settlement standard?
No. J.P. Morgan participated as an expert contributor to the development of the open delivery-versus-payment standard presented on Solana in October 2026, but made no commitment to use it. Expert participation and volume commitment are different things, and conflating them is a recurring source of overstated adoption claims.
Why does privacy matter for institutional blockchain adoption?
Because public ledgers expose position sizes, timing, counterparty relationships and strategy, which no fiduciary can accept. Confidentiality is the missing layer between where an asset class sits and where the capital that would use it actually is. Privacy-oriented capacity grew from roughly $6 billion to around $30 billion over the past year, and dark pools exceeding 50% of U.S. equity volume by 2025 show where institutional capital goes when given the choice.
What would prove this adoption framework wrong?
Four tests. No disclosed quantified gain in commodity trade documentation by the end of 2027 would refute the underrated-sector call. Statutory recognition of token-based title in two major jurisdictions plus continuous secondary pricing would overturn the real estate assessment. A cohort of internally well-sponsored projects failing specifically on regulatory grounds would move regulation above interoperability in the barrier ranking. And a rising headline tokenisation figure with falling utilisation would confirm the fragmented-rails scenario over the base case. Interim review date: 30 April 2027.
About E.R.A. OF CHANGES
E.R.A. OF CHANGES is an investment and analytical agency producing macro research, market forecasts and risk analysis for private investors and institutions. Our published work includes dated forecasts with explicit falsification conditions, periodic forecast scoreboards documenting both accurate and failed calls, and a documented methodology describing how our models are built, calibrated and rebuilt.
This report reflects the analytical opinion of its authors. It is not investment advice and not a recommendation to buy or sell any asset or to adopt any technology. Digital assets are volatile and may lose a substantial portion of their value. Statements about institutional participation describe publicly disclosed activity and should not be read as representations about the future conduct of any named organisation.
Sources
Official and Multilateral Institutions - Bank for International Settlements: Fintech and Digital Assets - International Monetary Fund: Fintech and Digital Money - World Bank: Financial Inclusion and Payment Systems - OECD: Digital Finance and Tokenisation
Securities and Derivatives Regulation - U.S. Securities and Exchange Commission - U.S. Commodity Futures Trading Commission
Internal E.R.A. OF CHANGES Research - Stablecoin Risks Explained - Cryptocurrency Regulation Explained - Institutional Crypto Adoption Trends - Bitcoin ETF Adoption Report - Global Liquidity Explained - Era Forecasting Methodology - De-Dollarisation Report - Economic Sanctions and Global Trade - Financial Stress Indicators Explained - Bitcoin Market Outlook H2 2026 - Gold Price 2026 Forecast - Crypto Regulation 2026 Updates - Crypto Portfolio Management - Bitcoin ETF Flows and Price Impact - E.R.A. Risk Modelling Methodology