Executive Summary
Aluminium is the only major industrial metal whose price is set primarily by something other than its own supply and demand balance. It is set by the cost and availability of electricity, and every other driver — Chinese policy, tariffs, electric-vehicle demand, construction cycles — operates on top of that constraint rather than independently of it.
As of 22 October 2026 the metal trades near 3,017 USD/t, down roughly 7% over the past month and still around 5% above its level a year earlier, with LME inventories in the region of 240,000 tonnes. Where that price sits matters more than the number itself: it is below the regime line at 3,175 USD/t and below the stops of both long setups we published in August and September 2026. Those setups were taken out. We say so plainly, because a research note that quietly folds its own stopped-out positions into a continuing bullish view is worth nothing to the reader.
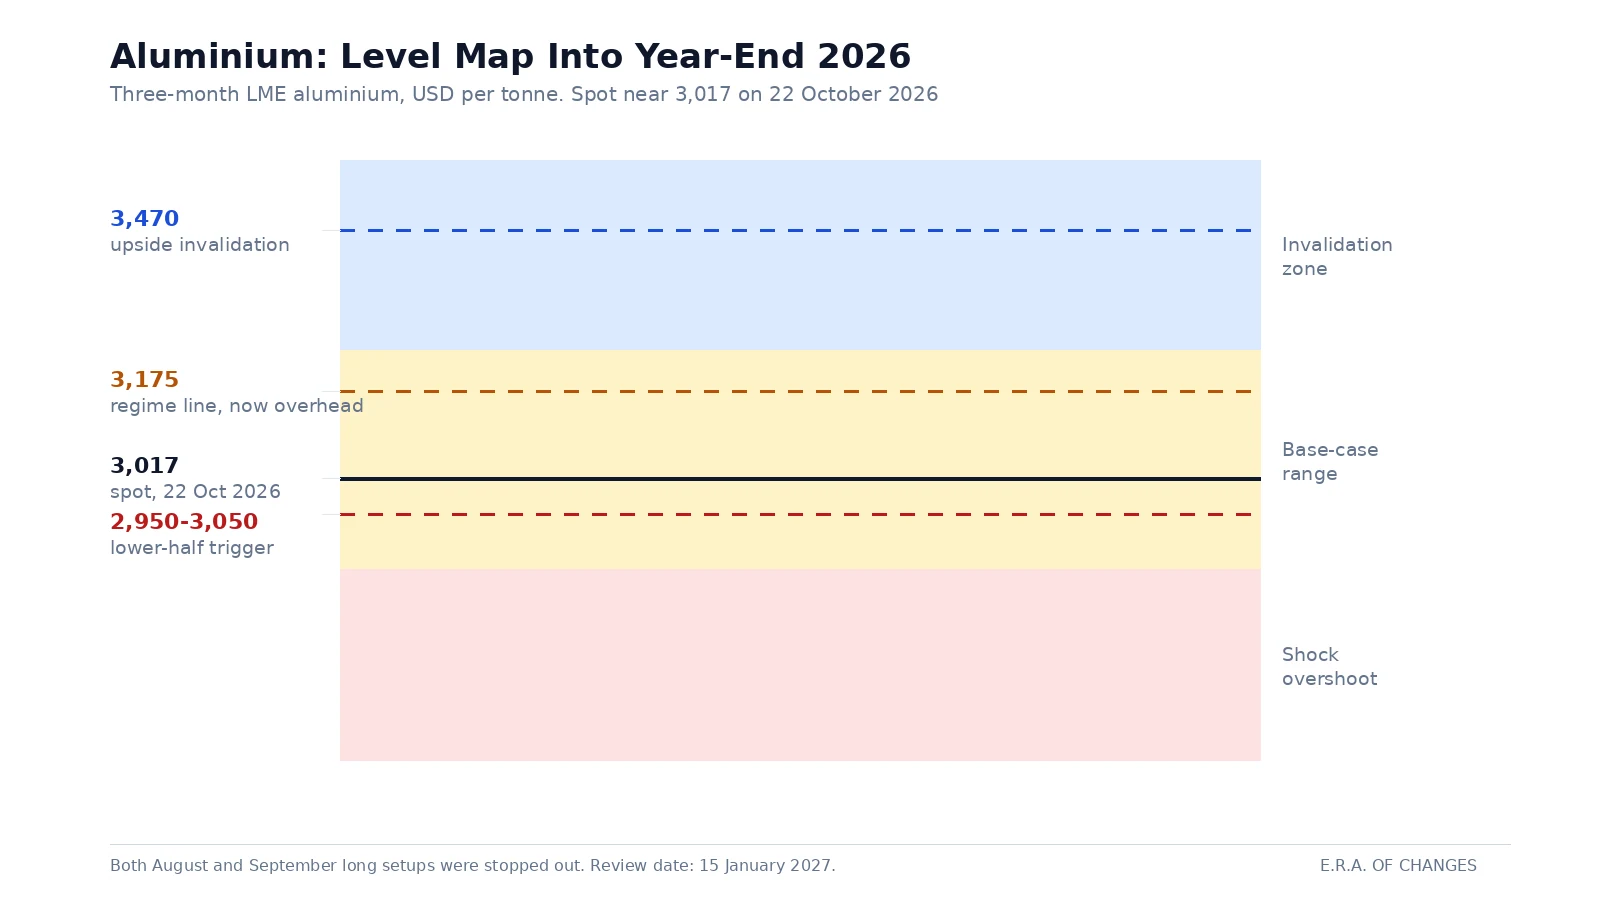
Our working view into the end of 2026 is therefore a range of 2,850–3,250 USD/t on three-month LME aluminium, with the burden of proof now on the recovery rather than on the decline. The regime line at 3,175 USD/t has flipped from support to overhead resistance, and reclaiming it on a weekly close would restore the constructive structure. A weekly close above 3,470 USD/t would invalidate the corrective reading outright. Failure to hold 2,950–3,050 USD/t opens the lower half of the range, and in a liquidity shock an overshoot beneath it, because capitulation lows are set by forced sellers who do not respect cost curves.
The significant point is not that the level map moved. It is that it moved in the direction our macro framework specified. The October break came alongside a firming dollar, which is precisely what the first leg of our sequence requires, and it is why we moved to a short position on a major producer on 13 October rather than defending the physical long.
The single factor capable of breaking that forecast is not aluminium-specific. It is a dollar liquidity shock — the dollar index clearing the 106–109 band and advancing toward 120. In that environment the metal’s genuinely tight physical balance becomes irrelevant for two to three quarters, because the first leg of a liquidity crisis sells everything that can be sold regardless of its cost curve. We state this explicitly because our published long setups sit uncomfortably alongside our macro scenario, and that tension deserves an answer rather than a silence. The answer is sequencing.
On the third question — whether aluminium still functions as a macro indicator of global industrial demand — our conclusion is blunt. It does not, not in raw form. Roughly half of world primary output sits inside one jurisdiction operating under an administrative capacity ceiling, which means the price now carries more information about Chinese industrial policy and about power markets than about global demand. The signal can be partially repaired, and we explain how, but anyone reading the exchange price as a clean demand proxy is reading the wrong instrument.
Key Takeaways
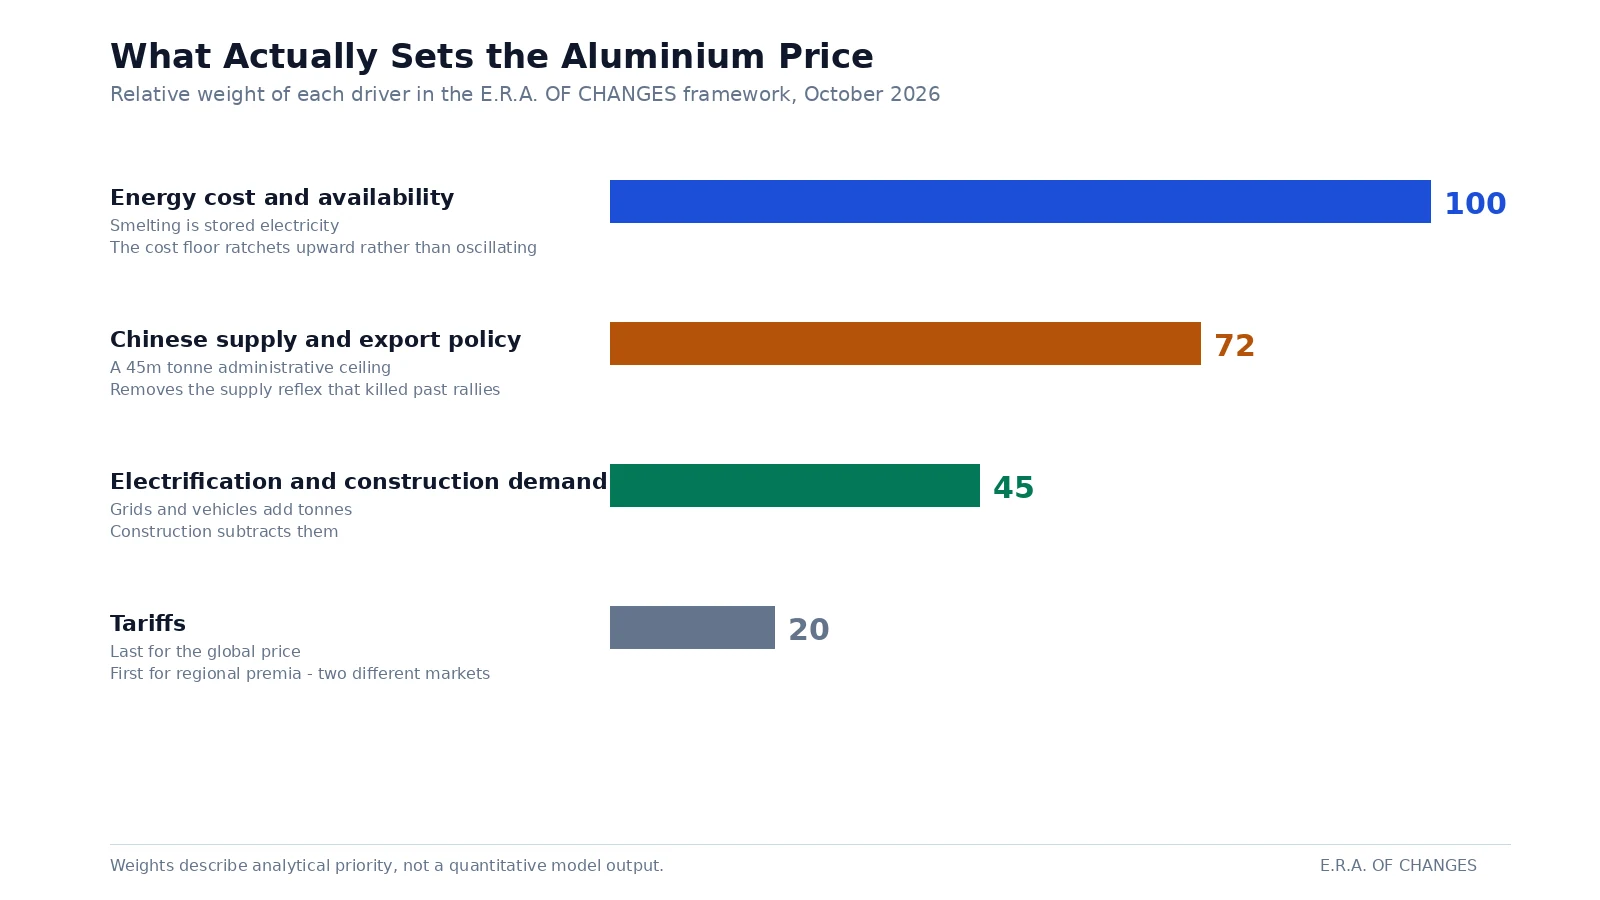
- Driver ranking, in order of influence on the current price: (1) energy cost and availability, (2) Chinese supply and export policy, (3) demand from electrification and construction, (4) tariffs. Tariffs rank last for the global price and first for regional premia — two different things that are routinely confused.
- Base case to end-2026: 2,850–3,250 USD/t. The metal traded near 3,017 USD/t on 22 October 2026, below the 3,175 regime line, which now acts as overhead resistance. Both of our August and September long setups were stopped out, and we say so rather than quietly revising the record. Upside invalidation: a weekly close above 3,470. Review date: 15 January 2027, with an interim checkpoint on 5 December 2026.
- Europe is not in a demand recession in this metal; it is in a supply retreat. Industrial electricity in Germany costs roughly three times what American competitors pay, and the gap is not closed by efficiency. Energy-intensive output is relocating to Asia and the Gulf, as we set out in our analysis of structural industrial inflation.
- China’s capacity ceiling of 45 million tonnes a year has removed the supply reflex that killed every previous aluminium rally, and our long setups and bearish macro view are a sequence rather than a contradiction: commodities fall with all risk assets as the dollar rises, then real assets lead, because they cannot be printed.
- The single factor that breaks our forecast is the dollar, not Chinese policy and not demand. A move in the dollar index toward 120 would overwhelm the cost-curve argument for the duration of the shock. Mechanics in our note on global liquidity.
- Aluminium’s signal value is contaminated but recoverable. Deflate the price by a regional power-cost index and the residual is a usable demand proxy. Read the raw price as a demand indicator and you will mistake a Yunnan drought for a global recovery. Our wider indicator set is in leading economic indicators to watch.
Introduction: What the Aluminium Price Is Actually Measuring
Producing one tonne of primary aluminium requires passing an electric current through molten alumina dissolved in cryolite for hours. The process cannot be paused. A smelter that loses power for more than a few hours risks the metal freezing in the pots, converting a temporary outage into a capital event measured in hundreds of millions of dollars and a restart measured in months. There is no efficient way to run a smelter intermittently, and half a century of technological progress has not changed that.
The consequence is that aluminium capacity sits where electricity is cheap, abundant and uninterrupted, and nowhere else: Iceland, Quebec, Norway, the Gulf, Siberia, Yunnan. The map of global aluminium production is a map of stranded cheap power. When the price of that power changes, the industry’s cost curve shifts and the metal reprices. This is why we treat aluminium as a derivative of the energy complex rather than as a standalone industrial metal.
The second structural fact is concentration. Roughly half of world primary output is Chinese, and Chinese output is governed by an administrative ceiling rather than by profitability. That single detail has done more to change this market’s behaviour than any demand development of the past fifteen years.
The third fact is that aluminium has two prices: the exchange benchmark, and the price a fabricator in Ohio or Rotterdam actually pays, which is the benchmark plus a regional premium. Most commentary on aluminium tariffs is in fact commentary on that premium. With those facts established, the questions this report answers become tractable. What sets the price. Where it goes into the end of 2026. And whether the resulting number tells us anything useful about the world economy.
What Actually Sets the Aluminium Price: Four Drivers, Ranked
Investors are offered four explanations for the aluminium price: energy costs, Chinese production and export policy, tariffs, and demand from electric vehicles and construction. They are usually presented as a list of equally weighted considerations. That is the single most common failure in commodity research, because an unranked list of factors is a way of avoiding accountability rather than a way of producing a view.
We rank them explicitly. The order matters more than the contents of the list, and we will defend each placement.
First: energy cost and availability
Energy is first by a wide margin, for three reasons that reinforce each other.
Arithmetic. At roughly 14–15 MWh per tonne, power is typically the largest line in a smelter’s cash cost. A doubling of industrial electricity tariffs moves marginal production cost by hundreds of dollars per tonne. No plausible change in electric-vehicle demand moves the price by a comparable amount on a comparable timescale.
Structure. Energy does not merely change the cost of production, it changes whether production is possible. Our note of 17 August 2026 identified the binding constraint as limited smelting capacity arising from electricity availability — not a shortage of bauxite, of capital, or of demand. Capacity that cannot be powered is not capacity.
Speed. Chinese capacity policy changes on a multi-year political cycle, construction demand over quarters, tariff schedules with elections. Power prices change with weather, hydrology, a pipeline outage, a cold snap. Within any given quarter, energy is the variable most likely to be responsible for the move.
The fair objection is that a cost floor only binds when the market trades near it. That is exactly why energy is first rather than exclusive, and why a policy variable sits immediately behind it.
Second: Chinese production and export policy
China is second, and the gap between first and second is narrower than the gap between second and third.
The headline item is the capacity ceiling of approximately 45 million tonnes a year, which our note of 24 September 2026 flagged as a principal driver of the setup. The significance is not the number but what the ceiling destroys. For two decades the market worked like this: price rises, Chinese smelters restart and expand, supply arrives within twelve to eighteen months, price falls. Every aluminium bull market died the same death. A price rise can no longer summon several million tonnes of Chinese supply, because the capacity is not permitted to exist however profitable it would be.
The second item is export policy on semi-finished products. China’s removal of the export tax rebate on aluminium semis at the end of 2024 was read as a technical tax adjustment. It was a supply event. Rebates on semis are the mechanism by which a producer operating under a primary-metal ceiling exports the metal anyway, in processed form.
We rank China second rather than first for a specific reason, and it is the point on which reasonable analysts disagree with us. The ceiling is a known, static, publicly stated constraint, and known constraints are priced: they set the level, not the changes. Energy costs move constantly and are not priced in advance. If the question is what explains aluminium’s level relative to its own history, China is first. If the question is what is moving the price this quarter, energy is first. The question posed here is the second one.
Third: demand from electrification and construction
Demand is third, which will read as heresy to anyone who has spent three years reading research on the metals of the energy transition.
The demand story is real. Aluminium is a direct beneficiary of electrification in a way few metals are: battery enclosures and structural castings in electric vehicles, where weight reduction offsets battery mass; overhead transmission conductors, where aluminium is the default rather than a substitute; solar module frames and mounting structures. Two things nonetheless keep it in third place.
The first is offsetting weakness. The largest single end-use of aluminium globally is construction, and the largest construction market in the world has been contracting for years. Transmission build-out is additive, Chinese property is subtractive, and the net is a slow drift rather than a step change. The credit mechanics behind that contraction are set out in our work on Chinese debt risk.
The second is magnitude and speed. Demand trends of two or three per cent a year are swamped, over six months, by a supply event removing several hundred thousand tonnes or an energy shock lifting marginal cost by several hundred dollars. Demand decides where the price is in 2030. Supply and energy decide where it is in March.
We would upgrade demand to second under one condition: evidence that grid and data-centre electrification is consuming aluminium faster than our assumptions while the Chinese ceiling is already binding. In that configuration the metal has no release valve and demand becomes the marginal driver by elimination. We do not yet see it.
Fourth: tariffs
Tariffs rank last for the global aluminium price. This is the placement we are most often challenged on, so the argument needs to be explicit.
A tariff is a wall, not a tap. It does not create or destroy a tonne of aluminium; it changes which door the tonne walks through and who pays for the walk. Tariffs become a first-order driver in one circumstance only: when imposed on a commodity that cannot be rerouted, because of shipping cost, quality specification, or a destination market large enough to absorb the world’s exportable surplus. Aluminium fails all three tests.
For an investor holding an exchange position or a diversified mining equity, tariffs belong fourth. For a United States fabricator hedging physical input costs they belong first, because the regional delivery premium is the entirety of their problem. Confusing the two is how a macro investor ends up trading a regional policy story as a global supply story.
The ranking determines which headlines to act on. If energy is first, a European power spike or a Yunnan hydrology report is market-moving information. If tariffs are fourth, another round of trade-policy headlines is noise for the exchange price however loudly it is covered. Most aluminium coverage in a given week is devoted to the two drivers we rank third and fourth, and that gap between what is covered and what matters is where the edge sits.
Energy: The Constraint That Sets the Floor
Aluminium as stored electricity
The industry’s shorthand for the metal is “solid electricity”, and the label is accurate enough to use analytically. At roughly 14–15 MWh per tonne, a smelter running one million tonnes a year is a permanent industrial load comparable to a mid-sized city. That load is the asset; the pots and the casthouse are the means of monetising a long-term power contract.
Two consequences follow. Aluminium capacity is a power-price arbitrage with a physical output: a smelter on a legacy hydro contract is profitable at almost any metal price, while one buying at a liberalised European industrial tariff is loss-making at prices that would be highly profitable elsewhere. The global cost curve is therefore unusually steep and dispersed. And recycling becomes a different business under the same price, because remelting requires on the order of five per cent of the energy of primary smelting — which structurally advantages secondary supply and caps deficit narratives, since a high enough price mobilises scrap.
The European withdrawal
The European situation is the clearest live demonstration of energy as the dominant driver, and it is routinely mislabelled as a demand problem. Industrial electricity in Germany costs roughly three times what competitors in the United States pay. For chemicals, steel, glass and aluminium that differential is not recoverable through efficiency, scale or product mix — it exceeds the entire margin of most energy-intensive processes. A country losing industrial employment at a rate measured in tens of thousands of positions a month is not experiencing a downturn in orders. It is experiencing the relocation of its industrial base to another continent.
The retreat has three effects, and the market prices only the first. It removes supply from the Western balance, which is bullish for premia. It transfers the marginal tonne to Asia and the Gulf, which lowers the global average cash cost over time and is bearish on a multi-year view. And it raises the share of world supply located where energy is allocated administratively rather than priced, which degrades the metal as a market signal. A smelter closing in Europe and reopening in Indonesia is not a net supply loss on a five-year horizon; it is a cost-curve improvement and a concentration of political risk.
Why the cost floor ratchets rather than oscillates
The most important property of energy as a driver is asymmetry. Western power costs have behaved as a ratchet rather than a cycle, for structural reasons: grid investment recovered through tariffs, capacity payments for backup generation needed precisely because it rarely runs, carbon pricing at the margin, and a load curve made less predictable by intermittent generation. None of these reverse when a recession lowers spot power prices, because none of them are spot-price phenomena. They are embedded in the delivered tariff.
We treat this alongside our work on global inflation trends and our analysis of inflation and interest rates into 2026, where energy-driven cost inflation and the policy rate response form a single mechanism. The conclusion for aluminium is that the Western floor under production cost is rising on a trend independent of the business cycle. The downside in a recession is therefore shallower than demand models imply, because production becomes uneconomic before the price reaches the level demand destruction alone would suggest.
The corollary is that the same statement is much weaker for Asian and Gulf capacity, where power is cheap and often administratively allocated. The cost floor is a Western phenomenon; the marginal tonne increasingly is not.
China: The 45-Million-Tonne Ceiling and the End of the Supply Reflex
What the ceiling is and what it is not
Chinese primary aluminium capacity operates under an administrative cap in the region of 45 million tonnes a year, adopted as part of supply-side reform and carbon-peaking commitments. Our note of 24 September 2026 cited the approach to that ceiling as one of the two principal drivers of a long position, alongside the loss of a portion of Middle Eastern output.
The cap does not limit Chinese production directly; it limits installed and permitted capacity. Output within that envelope still varies with profitability, with power availability, and particularly with hydrology in the hydro-dependent south-west, where drought-driven curtailments have repeatedly removed and restored meaningful tonnage inside a single year.
The ceiling is therefore a constraint on the medium-term supply response, not a guarantee of stable output. The first half of that sentence is why aluminium rallies can now persist. The second is why the metal remains volatile with a cap in place, and why anyone reading the price as a demand indicator will be misled by what is in fact a weather event.
Why we treat the ceiling as credible
The standard objection is that policy caps are abandoned when they become expensive, and that a high enough price will produce quiet approvals for new capacity. It is reasonable, and it is the main risk to our structural reading.
We treat the cap as credible for four reasons. It is embedded in carbon-intensity commitments rather than an industry plan, which raises the political cost of reversal. It serves a domestic purpose independent of metal prices, by rationalising an industry that was loss-making in aggregate for much of the previous decade. It coexists with a cheaper lever — relocating capacity from coal-fired provinces to hydro-rich ones — which improves the carbon profile without raising the cap. And it binds on a constrained resource: new capacity needs power allocation, which inside China competes with the electrification of transport, industry and computation. Even if the cap were raised tomorrow, the power to run the new pots must come from somewhere, and the marginal megawatt-hour has better uses than the world’s most energy-intensive bulk metal.
What would make us wrong about China
Three developments would force us to downgrade the ceiling’s significance: a formal upward revision of the cap or provincial approvals that collectively exceed it; a sustained rise in Chinese exports of primary metal or semis large enough to pull Western premia lower against a flat exchange price; or a reinstatement of export rebates on semis, which would signal a shift of priority from managing overcapacity back to supporting export volumes.
Any of the three would weaken the central pillar of the bullish physical case, and we would say so in the next quarterly review rather than waiting for the price to make the point. The standard we hold ourselves to is in our forecasting methodology.
Demand: Electrification, Grids and the Construction Hole
Where the incremental tonne goes
Demand analysis in aluminium is usually conducted at the wrong level of aggregation. “Global demand growth” is a weighted average of end-uses moving in opposite directions, and it conceals the only thing worth knowing: which component is changing fastest at the margin.
Transport is the fastest-growing component on an intensity basis, because weight is the binding constraint on electric-vehicle range and aluminium is the cheapest route to removing it. Electrical transmission is the most reliable on a volume basis: overhead conductors are aluminium by default rather than by substitution, and the global queue of grid reinforcement projects is long, politically supported and largely independent of the cycle. Packaging is the most stable and least discussed, and carries the shortest recycling loop.
The construction hole
Construction remains the largest end-use in aggregate, and it is where the demand case meets arithmetic. Chinese residential construction has been contracting for several years, and this is not a cyclical trough awaiting stimulus; it is the working-off of a capital stock built against a demographic assumption that has since reversed. Western non-residential construction has its own problem, in financing costs that have reset to levels at which a large share of pre-2022 project economics no longer close.
The honest conclusion is that global aluminium demand growth is positive, modest and slower than the headline electrification narrative implies. Anyone building a bullish case primarily on demand is relying on the weakest of the four drivers.
The data-centre wildcard
One component deserves separate treatment, because it attacks aluminium from two directions at once. Data-centre construction consumes aluminium directly, in busbars, enclosures, cooling systems and structural elements. More importantly it consumes electricity in large, inflexible, creditworthy blocks, which puts it in direct competition with smelting for the same scarce input, in the same grid queues, at a vastly higher value added per megawatt-hour.
That is the asymmetry worth understanding. A data centre can pay several hundred dollars per MWh and remain profitable. A smelter cannot pay a quarter of that. Wherever the two compete for incremental supply, the smelter loses every time. The growth of electricity-intensive computation is therefore bullish for aluminium through the cost channel even where it is neutral through the demand channel, and this is the most underpriced structural element of the case.
Tariffs and Regional Premia: Why There Are Two Aluminium Prices
The structure most investors never see
A fabricator does not buy “aluminium at the LME price”. It buys metal of a specified alloy and form, delivered to a specified location, at the exchange price plus a regional premium covering freight, financing, handling, duty and tariff. In normal conditions that premium is a few per cent of the all-in cost. In abnormal conditions it becomes the dominant variable.
The past two years have been abnormal. The United States raised its Section 232 duty on aluminium imports in steps through 2025 to a headline rate of 50 per cent. Because the country imports a very large share of the primary metal it consumes, the burden landed in the delivery premium rather than in the exchange price, and the Midwest premium reached levels without historical precedent. This was a transfer, not a shortage. American buyers paid more, producers selling into America received more, the quantity of metal in the world was unchanged, and the exchange price barely registered the event.
Why the exchange price is insulated
The insulation mechanism is reroutability, and it generalises to almost every tariff story in commodities. The global clearing price moves only to the extent that rerouting is inefficient — extra freight, extra financing, quality mismatch — and for aluminium those frictions are real but small relative to the value of the metal. Restricted Russian metal showed the same pattern: material barred from Western exchange warehouses did not disappear from the world balance but was redirected, predominantly to Asia, and the effect showed in the regional distribution of inventories, not in the global price. Our framework for this class of event is in economic sanctions and global trade.
The practical consequence is basis risk. The liquid hedging instrument prices the global benchmark; the actual exposure is benchmark plus premium. When tariff policy moves the premium by several hundred dollars a tonne while the benchmark is flat, a perfectly executed hedge produces a large loss on the physical leg with no offset. This is the most common way industrial consumers have lost money in this market since 2024.
Our Price Forecast to the End of 2026
The level map
We publish levels rather than point forecasts, because a single number conceals the structure that produced it. The levels below come from our own dated aluminium setups during 2026 and remain the architecture of the market.
3,470 USD/t — upper invalidation. The second target of our 17 August 2026 long setup. A weekly close above it would mean the autumn decline was a pause inside an uptrend rather than a corrective phase. 3,420 USD/t, the second target of the 24 September setup, is the upper boundary of what is achievable within the base case, and the 3,340–3,350 USD/t band, where the first targets of both setups cluster, is where the first serious supply sits on any recovery.
3,273–3,289 USD/t — the entry band, now overhead. Our August and September entry levels. Levels where positions were initiated and then went offside become supply, because holders sell into a return to break-even.
3,220 USD/t — the structural pivot. The stop on the September setup. Above it the market retains the character of a corrective pullback inside a constructive structure; below it on a weekly close, the burden of proof shifts to the bulls.
3,175 USD/t — the regime line. The stop on the August setup and the lower boundary of the entire 2026 structure. A weekly close below it changes the market’s character rather than its price, and opens 2,950–3,050 USD/t. The lower half of that zone would be reached only in the liquidity-shock scenario, and with an overshoot, because capitulation lows are made by forced sellers and forced sellers do not respect technical levels.
The base case
Our base case to 31 December 2026 is a range of 2,850–3,250 USD/t. With the metal near 3,017 USD/t on 22 October 2026, the market already sits inside the lower half of that band, and the regime line at 3,175 USD/t now acts as overhead resistance rather than as support. Reclaiming it on a weekly close is the first condition for any constructive reading; until then, rallies are to be treated as supply.
The reasoning is a balance of two opposing forces that are both genuinely strong, which is why the outcome is a range rather than a trend.
On the supply side, the physical case is the tightest it has been in a decade: a binding Chinese capacity ceiling, European capacity in structural retreat, the loss of a portion of Middle Eastern output flagged in our September note, and a rising cost floor driven by industrial power tariffs. That argues against a sustained break of the regime line.
On the macro side, the direction of travel for risk assets and dollar liquidity through the fourth quarter of 2026 and into 2027 is adverse in our framework. The October turn lower in world aluminium prices was the reason we moved to a short position on RUSAL on 13 October 2026 — a decision that follows from the macro overlay rather than from any change in the physical story. That argues against a sustained break of 3,470.
A range is therefore not a hedge or an absence of a view. It is the view: two strong opposing forces, neither currently able to resolve the other, with the resolution scheduled for the first leg of the macro sequence rather than for the fourth quarter.
The single factor that breaks this forecast
We were asked for one factor, not a list, and the discipline of naming one is useful. The answer is the dollar: specifically, the dollar index clearing the 106–109 band on a confirmed basis and advancing toward 120.
The mechanism has nothing to do with aluminium’s fundamentals, and that is the point. In a dollar liquidity shock the price of a commodity is set by the funding position of the people who own it, not by its cost of production. Leverage is reduced, inventory is liquidated, credit lines supporting physical trade are withdrawn, and the metal is sold by holders with no view on the cost curve at all. Tight physical balances do not prevent this; they delay it, then amplify the recovery.
We would expect 3,175 to fail, 2,950–3,050 to be reached, and an overshoot below it that would afterwards be called irrational. It would not be irrational. There would simply be nobody on the other side. The transmission mechanics are in our note on financial stress indicators. A strong dollar also compresses the local-currency revenues and costs of producers in Russia, Brazil, India and the Gulf in opposite directions, which is why we read this metal alongside our emerging-market currency forecast: a producer whose costs are local and whose revenue is in dollars gains margin in exactly the phase when the metal price is falling, and keeps supply online longer than a dollar-cost model predicts.
We should also say why we did not nominate the obvious alternative. The frequently cited single risk is a Chinese policy reversal — a raised cap or a flood of exported semis. We rank it lower because new capacity requires power allocation that has better-paying uses, and because reversing a carbon-linked commitment carries a political cost that a tax adjustment does not. It is a real risk. It is not the largest one, and it would take longer to appear in the price.
Falsification conditions and review date
A forecast that cannot be checked is advertising. Ours fails under any of the following, each independently observable.
One. A weekly close above 3,470 USD/t with stable or improving dollar liquidity. That would mean we misread the regime, not merely the timing.
Two. A weekly close below 2,950 USD/t without a dollar index move above 109. That would mean the physical tightness is not real and the demand side is considerably weaker than we assess.
Three. A formal increase in the Chinese capacity ceiling, or a sustained rise in Chinese primary and semi-finished exports against flat Western premia.
Four. Continued production at scale by Western smelters below 2,900 USD/t for more than two consecutive quarters, which would mean the cash-cost estimates underpinning our floor argument are wrong.
Review date: 15 January 2027. Interim checkpoint: 5 December 2026, after the November macro data and ahead of year-end liquidity. If any of the four conditions above is met before those dates, we revise immediately rather than waiting for the calendar.
Reconciling a long physical view with a bearish macro scenario
This needs addressing directly, because an attentive reader of our published work will have noticed the tension. We ran long aluminium setups in August and September 2026. Our macro scenario calls for a deflationary first leg in which commodities fall alongside every other risk asset as the dollar appreciates toward 120. Those look like contradictory positions. They are not contradictory; they are sequential, and the sequence is the whole of our framework.
First leg: the liquidity drain. The dollar rises. Everything priced and funded in dollars falls together — equities, credit, industrial metals, energy, precious metals, digital assets. Correlations converge toward one. Cost curves are irrelevant because the selling is not driven by a view on value. During this phase the correct position in aluminium is small or absent, and our RUSAL short of 13 October 2026 belongs to this leg.
Second leg: the policy response and devaluation. Authorities respond, as they always do, by expanding the quantity of money. At that point real assets lead the recovery, for one reason that has nothing to do with growth: they cannot be printed. A tonne of aluminium requires 14 MWh of electricity, a bauxite mine, an alumina refinery and a decade of permitting. A unit of currency requires a decision. When the quantity of the second rises faster than the quantity of the first, the exchange rate between them moves in one direction.
Aluminium is better placed in that second leg than most industrial metals, precisely because its cost structure is dominated by energy: in a devaluation, energy reprices early and the metal’s cost floor rises with it, which supports the price mechanically rather than through a demand recovery.
The contradiction therefore resolves into one instruction: be structurally constructive on aluminium, be tactically absent during the first leg, and keep the two statements attached to their own parts of the sequence. The portfolio translation is set out in our macro scenario matrix, with the position-level discipline in investment risk mitigation methods; the same sequencing governs our views on gold and on digital assets.
The obvious risk in our own reasoning is that a framework explaining both a long setup and a bearish macro view by reference to sequencing can be used to explain anything after the fact. The protection is the falsification list above: sequencing is a forecast only if the order and the levels are published in advance.
Three Scenarios to the End of 2026 and Into 2027
Scenario A: Range persistence (base case, ~50%)
The dollar index works higher but does not clear 109 on a confirmed basis before the year end. Aluminium stabilises above 2,950, trades the 2,850–3,250 band, and finishes 2026 without reclaiming the 3,175 regime line on a weekly closing basis. Physical tightness prevents a breakdown, macro pressure prevents a breakout, and regional premia stay elevated in the United States and subdued in Asia.
Portfolio implication: range discipline, no leverage, accumulation only on tests of 3,175 with invalidation below 3,050. The trade here is patience, not direction.
Scenario B: Liquidity shock (~35%)
The dollar index clears 106–109 and advances toward 120. Industrial metals are sold with everything else. Aluminium loses 3,175 with weekly confirmation, reaches 2,950–3,050 and overshoots below it on forced selling during the winter of 2026/27. Chinese and Gulf capacity keeps running because its power costs permit it; Western capacity curtails further, which seeds the recovery.
Portfolio implication: cash outperforms every commodity, and this is also the phase that produces the entry for the second leg. The error to avoid is buying the cost-curve argument too early, because the cost curve does not bind until forced selling has finished.
Scenario C: Supply event on a tight balance (~15%)
A discrete disruption lands before the macro shock: a bauxite or alumina interruption, a power curtailment in a major producing region, or a further loss of Middle Eastern or European output. On a balance already tightened by the Chinese ceiling, the price breaks 3,470 and the range forecast is invalidated to the upside. The cost-floor argument becomes a cost-spike argument.
Portfolio implication: this is our invalidation scenario and we would acknowledge it as such. Its existence is why we hold no short position in the metal itself despite a bearish macro view.
The distribution of probability matters less than the asymmetry. In scenarios A and B, being absent costs an opportunity. In scenario C, being short costs capital. That asymmetry, not the probability ranking, is what determines our positioning.
Is Aluminium Still a Macro Indicator?
The third question this report addresses is the hardest, because the honest answer costs the metal some of its reputation.
The case for the metal as an indicator is genuine. Aluminium is consumed across transport, construction, packaging, machinery and electrical infrastructure, a spread broad enough that aggregate demand should track global industrial activity, and it trades on a liquid exchange with transparent pricing. On paper it is a better demand barometer than copper, whose price is distorted by chronic mine-supply constraints.
Three distortions that break the signal
The supply side is administered, not priced. Roughly half of world primary output is governed by a capacity ceiling and by provincial power allocation. When Chinese output falls, it may reflect a drought in Yunnan, a power-rationing order, or a carbon-intensity target — none of which carry information about global demand. An investor reading the resulting price rise as a demand signal has mistaken a weather event for a recovery. This is the largest contaminant, and it is why we answer the question in the negative.
The cost side moves independently of demand. Because power is the dominant input, an energy shock moves the aluminium price with no change in demand at all. In 2022 the metal rose and then fell violently while industrial demand moved barely at all; the variable was European gas. A price that responds to the cost of an input cannot simultaneously be a clean reading of the appetite for the output. Oil has the same problem in milder form, and we treat both the same way, as set out in oil price volatility explained.
Inventories no longer mean what they appear to mean. Exchange stocks are a subset of global inventory, and the relationship between the two has been distorted for a decade by off-warrant storage, financing deals that immobilise metal for carry rather than consumption, and the redirection of restricted material into non-Western warehouses. Falling exchange stocks can mean tightening consumption or simply a change in where metal is parked.
How we repair the signal
We do not discard aluminium as an indicator. We decompose it, on the principle that a contaminated signal is still usable once the contaminant is identified.
The first step is to deflate the metal price by a weighted industrial power-cost index for the main producing regions. What remains once the energy term is removed is a considerably better demand proxy than the raw price.
The second step is to read the price against its own cost curve rather than in absolute terms. The spread between the market price and the estimated marginal cash cost of the ninetieth-percentile producer tells you whether the market is rationing demand or rationing supply. A narrow spread with rising prices is a supply story; a widening spread with rising prices is a demand story. That distinction does most of the analytical work.
The third step is corroboration: we never take a directional macro read from one commodity. Aluminium is weighed against freight rates, steel, the copper–gold ratio and credit spreads, within the framework in leading economic indicators to watch and cross-checked against our global recession probability work.
The verdict
Aluminium is not a full macro indicator of global industrial demand, and treating it as one has become actively misleading. In its raw form it is better described as a joint index of global power costs and Chinese industrial policy, with an industrial-demand component buried inside it.
Adjusted for energy and read against its cost curve, it remains one of the more useful inputs we have. Unadjusted, it is a thermometer held in direct sunlight: the instrument works, but it measures something other than what the reader intends.
Common Mistakes in the Aluminium Market
Reading Chinese output changes as demand signals. Most short-term variation in Chinese production reflects hydrology and power allocation, not consumption. The same applies to exchange inventories: metal moves off-warrant for financing reasons unrelated to consumption, and inventory location is not inventory quantity.
Using aluminium equities as a proxy for the metal. A producer carries currency exposure, power-contract structure, leverage and jurisdictional risk. Our RUSAL short of 13 October 2026 and a constructive structural view on the metal coexist for precisely that reason.
Confusing a correct direction with a survivable position. The gap between the first and second legs of the macro sequence is where correct views are liquidated. The discipline required is described in investment risk mitigation methods.
What This Framework Cannot Tell You
It cannot price the upstream. Bauxite and alumina supply is concentrated in a few jurisdictions, and a refinery outage or an export restriction upstream can move the metal several hundred dollars within weeks. We monitor it; we do not forecast it, because the events are political rather than economic.
It cannot see administrative decisions before they are published, and it cannot time the macro sequence to the month. A provincial power-rationing order or a change in export tax treatment is not forecastable from market data, and roughly half of this market’s supply is exposed to exactly that kind of decision. Our structural reads have also been considerably more reliable than our dates: the levels in this report are firmer than the calendar attached to them.
It does not substitute for position sizing. Every scenario above assumes the reader can survive being early. If that assumption fails, the quality of the analysis is irrelevant to the outcome.
E.R.A. OF CHANGES Analyst’s Perspective
I am asked regularly why we were long aluminium in August and September and short a major producer in October, as though one of the two must have been a mistake. Neither was. They belong to different legs of the same sequence, and anyone who cannot hold that distinction will be wrong-footed by this market twice: once on the way down and again on the way back.
What I will not do is pretend the metal is something it is not. Aluminium has been sold to investors for three years as a pure play on electrification. It is not. It is a play on the price of electricity and on the industrial policy of one country, with an electrification kicker attached. That is still a good trade on a five-year view, for one reason: the thing cannot be printed.
Where our record is weakest is timing. We are structurally early, our directional calls have held up considerably better than our dates, and the levels in this report deserve more confidence than the calendar attached to them. The honest limit is this: I can tell you where aluminium should trade given a set of energy and liquidity conditions. I cannot tell you when a provincial authority in China will ration power, and that single unknown moves this market more than any demand forecast I have ever read.
How E.R.A. OF CHANGES Uses This in Its Research Process
Aluminium is not analysed in isolation. It enters as one expression of a single macro scenario that also governs our views on the dollar, oil, gold, equity indices and digital assets. If those components ever imply different regimes at once, we treat it as evidence of an error in the framework rather than as a diversified set of opinions.
Three principles govern the work. Ranked drivers, because unranked factor lists are how analysis avoids accountability. Published falsification conditions with review dates. And separation of structure from timing, because our record supports higher confidence in the former than the latter.
For commodities we add a fourth: every price view is paired with a cost-curve view. A forecast that cannot say where production becomes uneconomic is a forecast about sentiment rather than about a market in a physical good.
The full description of the process is in our forecasting methodology, and the quantitative scaffolding behind the scenario probabilities in this report is documented in our risk modelling methodology.
Frequently Asked Questions
What drives the price of aluminium?
In order of influence: the cost and availability of electricity, Chinese supply and export policy, demand from electrification and construction, and tariffs. Energy dominates because smelting consumes roughly 14–15 MWh per tonne and power is usually the largest line in a producer’s cash cost.
What is the aluminium price forecast for the end of 2026?
Our base case is a range of 2,850–3,250 USD/t. The metal traded near 3,017 USD/t on 22 October 2026, below the 3,175 regime line, which now acts as overhead resistance. A weekly close above 3,470 invalidates the view to the upside; a weekly close below 3,175 opens the 2,950–3,050 zone. Review date: 15 January 2027.
Why is aluminium so sensitive to electricity prices?
Because smelting is an electrochemical process that cannot be interrupted without risking the metal freezing in the pots. Power is both the largest cost and a precondition for operating at all, which is why capacity is located only where electricity is cheap and uninterrupted.
What is China’s aluminium capacity cap and why does it matter?
Chinese primary capacity is capped at approximately 45 million tonnes a year under industrial and carbon policy. It matters because it removes the supply reflex that ended every previous aluminium rally: a higher price can no longer summon several million tonnes of new Chinese supply.
Do US aluminium tariffs raise the global aluminium price?
Barely. Tariffs redirect flows rather than change the global balance, so the burden lands in regional delivery premia rather than in the exchange price. They are first-order for an American fabricator and fourth-order for the global benchmark.
Is aluminium a reliable indicator of global industrial demand?
Not in raw form. With roughly half of world output administered under a capacity ceiling and provincial power allocation, the price carries more information about power costs and Chinese policy than about global demand. Deflated by an industrial power-cost index, the residual is a usable demand proxy.
Will electric vehicles cause an aluminium shortage?
Not on their own. Electric vehicles and grid build-out are genuinely aluminium-intensive, but the tonnage added is currently offset by contraction in global construction. Electrification matters more as a 2030 argument than as a 2026 one.
What happens to aluminium in a recession?
Less than demand models suggest, because production becomes uneconomic before the price falls to the level demand destruction alone would imply. The exception is a liquidity shock, in which forced selling drives the price below the cost floor regardless of fundamentals.
Is aluminium a good inflation hedge?
Only in the second leg of an inflationary sequence. During the initial shock it falls with every other risk asset as the dollar rises. Once monetary expansion begins it performs well, because its cost base is energy and energy reprices early.
Why did European aluminium smelters close?
Industrial electricity in Germany costs roughly three times what competitors in the United States pay, and that differential exceeds the entire margin of most energy-intensive processes. This is a supply retreat driven by input costs, not a collapse in European demand.
How does a strong dollar affect aluminium?
Two ways, in opposite directions. It lowers the dollar price, because the metal is dollar-denominated and dollar-funded. It also raises the margins of producers whose costs are in weaker local currencies, which keeps supply online longer than a dollar-cost model would predict.
What would prove this aluminium forecast wrong?
A weekly close above 3,470 USD/t with stable liquidity; a weekly close below 2,950 without the dollar index clearing 109; a formal increase in the Chinese capacity cap; or continued Western production at scale below 2,900 USD/t for two consecutive quarters.
About E.R.A. OF CHANGES
E.R.A. OF CHANGES is an investment and analytical agency producing macro research, market forecasts and risk analysis for private investors and institutions. Our published work includes dated forecasts with explicit falsification conditions, periodic scoreboards documenting both accurate and failed calls, and a documented methodology.
This report reflects the analytical opinion of its authors. It is not investment advice and not a recommendation to buy or sell any asset. Commodity prices are volatile, leveraged positions can lose more than the capital committed, and past performance is not a guide to future results.
Sources
Price and Exchange Data - London Metal Exchange: LME Aluminium - World Bank: Commodity Markets Outlook and Pink Sheet
Production, Reserves and Industry Statistics - International Aluminium Institute: Primary Aluminium Production - USGS: Aluminium Statistics and Information - USGS: Bauxite and Alumina Statistics and Information
Energy and Industrial Electricity - International Energy Agency: Aluminium - International Energy Agency: Data and Statistics
Internal E.R.A. OF CHANGES Research - Global Liquidity Explained - Financial Stress Indicators Explained - Global Inflation Trends - Inflation and Interest Rates 2026 - Oil Price Volatility Explained - China Debt Crisis Risk Analysis - Economic Sanctions and Global Trade - Leading Economic Indicators to Watch - Global Recession Probability - Emerging Market Currency Forecast 2026 - Gold Price 2026 Forecast - Bitcoin Market Outlook H2 2026 - Portfolio Scenario Planning: The Macro Matrix - Investment Risk Mitigation Methods - Era Forecasting Methodology - Era Risk Modelling Methodology