Executive Summary
Bitcoin enters the final quarter of 2026 trading near $81,800, roughly 35% below the October 2025 all-time high of approximately $126,200. The market narrative has shifted from “institutional adoption drives the next leg up” to a quieter and more uncomfortable question: what happens when the liquidity that fuelled the last cycle stops expanding?
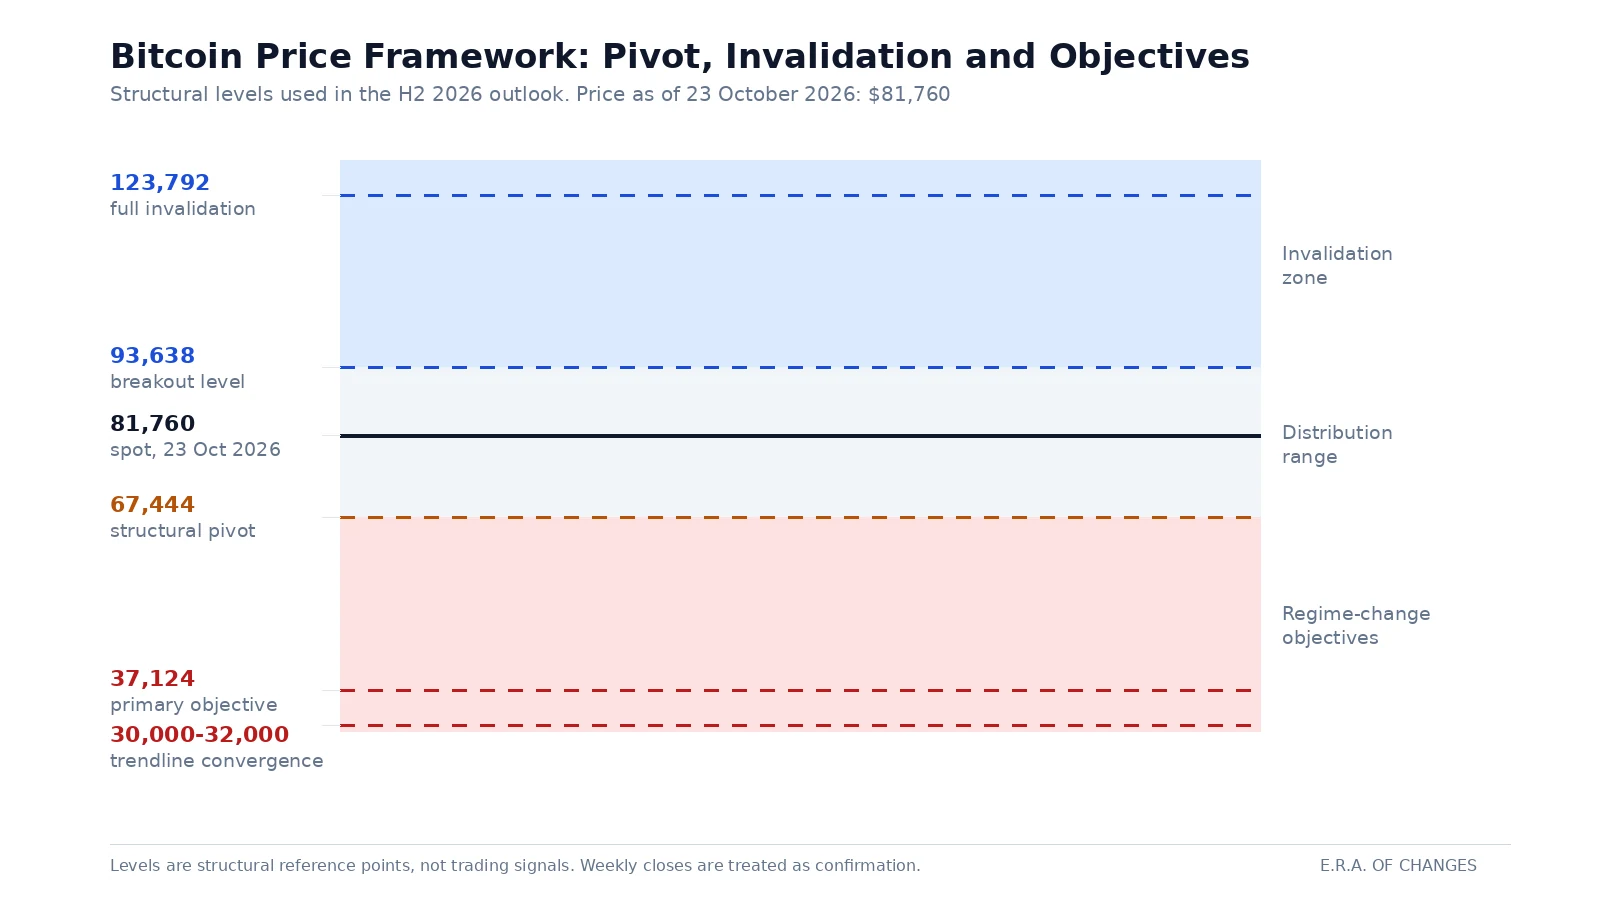
Our base case for the remainder of 2026 is a trading range of $40,000–$70,000, with the structural pivot located at $67,444. Above that level, the market remains in a distributive upward drift that can still test $90,000–$94,000. Below it, the structure changes character entirely, with a primary objective near $37,124 and long-term trendline convergence around $30,000–$32,000.
Two macro variables decide which of those paths the market takes, and neither of them is crypto-specific. The first is global dollar liquidity: the dollar index, Treasury cash balances, and net issuance. The second is the U.S. political calendar, where the November 3 midterm elections mark the point at which the incentive to keep financial conditions visibly comfortable disappears.
This report explains the framework behind that view, ranks the forces actually driving the current cycle, addresses the “digital gold” question honestly, and states the specific conditions under which we would admit the forecast was wrong.
Key Takeaways
- Base case for year-end 2026: $40,000–$70,000. Invalidation band: sustained trade above $93,638 with improving liquidity.
- $67,444 is the structural pivot. Above it, distribution. Below it, a different market regime with objectives near $37,124 and $30,000–$32,000.
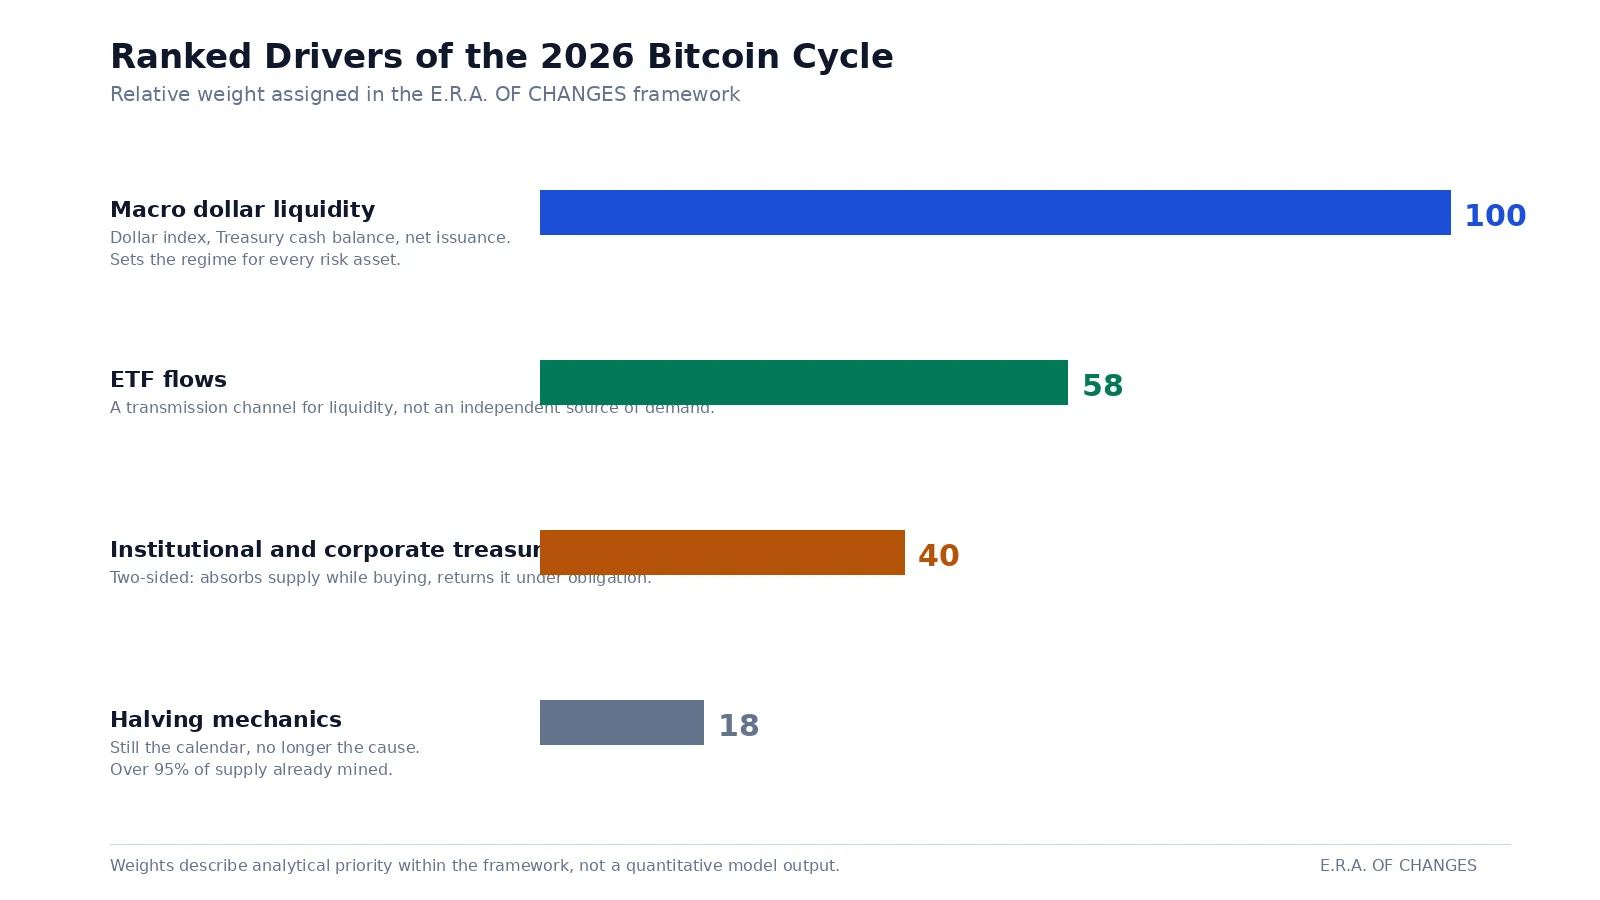
- Ranked drivers of this cycle: macro liquidity first, ETF flows second (as a transmission channel, not an independent force), institutional and corporate treasuries third, the halving fourth and fading.
- The four-year halving cycle still frames the calendar but no longer explains price. Bitcoin fell more than 50% from its high in 2026 while the issuance schedule did not change at all.
- Bitcoin is not digital gold. It is the most liquidity-sensitive large asset in the market. In a panic, correlations across all risk assets converge toward one, and Bitcoin converges with them.
- The specific risk to Bitcoin, as distinct from crypto generally, is supply concentrated in the hands of holders who are obliged to sell: corporate treasuries with covenants and funds with redemption duties.
- Expected cycle low: winter 2026/27 to spring 2027. The central window for a sustainable uptrend begins in the final ten days of April 2027.
Introduction: Where the Market Actually Stands
Let us begin with the numbers rather than the narrative, because the narrative in crypto is almost always a lagging indicator.
As of October 23, 2026, Bitcoin trades at approximately $81,760, up 0.42% over twenty-four hours. Ethereum trades near $2,407. Total crypto market capitalisation stands at roughly $2.754 trillion, down 3.88% on the day. Bitcoin dominance is 59.5%; Ethereum dominance is 10.6%. The Fear and Greed Index sits at 50 — neutral — after falling eighteen points in a single day from a reading of 68, which is greed.
That eighteen-point drop matters more than the price action around it. It describes a market whose conviction is thin enough to evaporate in one session. Markets with genuine structural demand do not swing from greed to neutral on a day when the underlying asset is flat.
The broader context is a drawdown of roughly 35% from the October 2025 peak near $126,200, with an intermediate low around $59,100 recorded in June 2026 — a decline of more than 53% from the high. For historical calibration: the 2014 cycle produced an 86% drawdown, 2018 produced 84%, and 2022 produced 77%. By that standard, the current cycle has not yet delivered a capitulation comparable to any previous one.
This is the single most important fact in the entire report, and it is the one most frequently argued away. Every cycle produces a cohort of analysts explaining why this time the drawdown will be shallower because the holder base is more mature. Every cycle, that argument holds right up until the moment it does not.
The Price Framework: Three Levels That Define the Rest of 2026
Our framework is built on three levels. They are not arbitrary round numbers; each marks a point where the structure of the market changes rather than merely the price.
$67,444 — the structural pivot
This is the level that separates two different markets. While Bitcoin holds above it, the character of trade remains an upward-drifting range, and a test of the $90,000–$93,638 zone remains legitimate. We read such a move as distribution rather than a new cycle: large holders exchanging inventory for retail liquidity at favourable prices.
Losing $67,444 with weekly confirmation changes the regime. It converts every rally into supply and opens the lower objectives discussed below.
$93,638 and $123,792 — the invalidation ladder
A decisive break above $93,638 opens a path toward $100,000 and begins to undermine the distributive reading. A recovery of $123,792 would end it outright. We treat these as falsification levels rather than targets, which is a meaningful distinction: a forecast that cannot specify what would disprove it is not a forecast.
$37,124 and the $30,000–$32,000 convergence
Below the pivot, our primary objective is $37,124, with long-term trendlines converging near $30,000–$32,000. A rapid overshoot below that convergence is possible and, in our experience, likely: capitulation lows are produced by forced sellers, and forced sellers do not stop at technical levels.
The timing we attach to this is winter 2026/27 through spring 2027, with the central window for a durable reversal in the final ten days of April 2027, plus or minus four to six weeks.
The Two Macro Factors That Decide the Outcome
1. Dollar liquidity
Bitcoin has traded for several years as the most liquidity-sensitive major asset in global markets. Not the most volatile — the most sensitive. It responds earlier and more violently to changes in the quantity of freely available dollars than equities, credit, or gold.
The components we track are the dollar index, the Treasury General Account balance, net issuance by the Treasury, and the policy rate path. The mechanism is simple: when the Treasury rebuilds cash balances and net issuance is heavy, dollars are drained from the private system. The dollar appreciates. Assets priced in dollars and funded with dollars face pressure, starting with the most reflexive.
Our dollar index framework runs from the low 100s toward 106–109, and a confirmed close above 109.34 opens a path to the 120 area. That is the environment in which our lower Bitcoin objectives become live. A failure of the dollar index to clear 106–109, followed by a decline below 97, would remove the main support of this thesis.
Two honest caveats. Macro flows do not work mechanically: a rising Treasury cash balance can be offset by declining reverse repo balances, by money market behaviour, or by central-bank action. And liquidity is a condition, not a trigger. It explains why a market is fragile, not when it breaks. For the mechanics of recognising the break itself, see our work on financial stress indicators.
2. The U.S. political calendar
The second factor is not economic, and conventional models exclude it. We include it deliberately, and it has been among the most reliable inputs we use.
November 3, 2026 is the date of the U.S. midterm elections. Ahead of a national vote, there is a clear institutional interest in keeping visible financial conditions comfortable: equity markets orderly, fuel prices contained, headline inflation unthreatening. Policy and communication both bend toward that objective. After the vote, the incentive disappears.
We are not claiming that markets collapse on November 4. We are claiming something narrower and more useful: the window during which the system is actively held together by hand closes at that date, and problems that were deferred become available for repricing.
Ranking the Forces Driving This Cycle
Investors are routinely offered four explanations for the current cycle: ETF flows, macro liquidity, halving mechanics, and institutional treasury allocation. They are rarely ranked. Ranking them is the entire analytical exercise, because treating them as equivalent is how portfolios end up positioned for the wrong cycle.
First: macro liquidity
By a wide margin. It sets the conditions for every risk asset, and Bitcoin is the most responsive of them. Liquidity is the only factor on this list capable of overriding all the others simultaneously.
Second: ETF flows
Important, but widely misunderstood. ETF flows are not an independent source of demand. They are the channel through which macro liquidity reaches Bitcoin. The fund does not create money; it transports money that already exists from one pocket to another.
This is why flows almost never run against the liquidity cycle for long. When dollars are abundant, allocations arrive and flows are positive. When dollars tighten, the same allocators redeem. Treating flows as an autonomous bid is the most common analytical error in the current market. Our detailed work on this is in the Bitcoin ETF Adoption Report.
Third: institutional and corporate treasuries
Their effect has become two-sided, and the market still prices only one side of it.
While treasuries accumulate, they withdraw supply: coins migrate from exchanges into long-term custody. Current structure shows roughly 13.03 million BTC in illiquid supply, 3.05 million liquid, and 4.0 million highly liquid. The bullish reading is obvious and has been repeated endlessly.
The other side is discussed in the final section of this report, because it is, in our view, the defining Bitcoin-specific risk of this cycle.
Fourth: the halving
The halving remains hard-coded. The April 2024 event cut issuance to 3.125 BTC per block, roughly 450 BTC per day; the next, in April 2028, will cut it to about 225 BTC per day.
But its marginal influence declines every cycle, and this is arithmetic rather than opinion. More than 95% of total supply has already been mined. Removing a couple of hundred coins per day from a market capitalised in the trillions is not the force it was when the asset was capitalised in the billions. The diminishing amplitude of each cycle is not a sign of weakness in Bitcoin; it reflects the fact that moving the same percentage of a larger market requires proportionally more capital.
The decisive evidence is in front of us. In 2026 Bitcoin declined more than 50% from its high while the issuance schedule did not change by a single coin. If the halving were the dominant driver, that could not have happened.
Bitcoin and Risk Assets: Is “Digital Gold” Overstated?
Yes. And in our view the phrase now functions as marketing rather than description.
Bitcoin behaves as a high-beta risk asset. During calm periods it produces its own narratives and genuine divergences from equity indices, and those episodes are the evidence usually cited for independence. But independence is not tested in calm periods. It is tested on the day of a liquidation cascade, and on that day correlations across risk assets converge toward one. Bitcoin converges with them. This has happened in every stress episode of recent years, and we see no structural reason for the next one to differ.
There is a real kernel inside the overstatement. The hard-asset narrative — fear of fiscal dominance and currency debasement — does lift gold and Bitcoin together. But it operates on the second leg of the sequence, after monetary authorities have been forced to respond. On the first leg, during the shock itself, it helps neither: investors close leverage and seek cash dollars, selling whatever is liquid rather than whatever is weakest.
The formulation we use internally is this: Bitcoin is not digital gold, it is the most liquidity-sensitive major asset there is. That characteristic is a liability in the deflationary phase and an advantage in the debasement phase that follows. Readers tracking the metal side of that trade will find our framework in the Gold Market Outlook.
What Would Prove This Forecast Wrong
A forecast without falsification conditions is entertainment. Ours has four, each independently checkable, with a review date in the first quarter of 2027.
Condition one. Bitcoin establishes itself above $93,638 and recovers $123,792 while liquidity conditions improve rather than deteriorate. That would mean we misread the market regime itself, not merely the timing.
Condition two. The dollar index fails to clear the 106–109 zone and declines below 97. The entire structure of this thesis rests on an appreciating dollar; without it, the thesis has no engine.
Condition three. The Treasury reduces its liquidity drain and the Federal Reserve eases before credit stress appears rather than after. Pre-emptive easing removes the forced-selling phase from which our capitulation scenario is built.
Condition four. Bitcoin dominance falls durably below 54.73% before any capitulation in Bitcoin itself. Our model expects capital to flee altcoins into Bitcoin first, pushing dominance to a final spike near 66–67%. Early rotation into altcoins instead would mean the market is running on different mechanics than we have described.
We publish these conditions for the same reason we publish the forecast. A research process that cannot be checked by its readers is not a process; it is advertising. The reasoning behind that standard is set out in our forecasting methodology.
The Defining Bitcoin-Specific Risk
Ask most analysts for the main risk to Bitcoin and you will hear about regulation, quantum computing, or a competing protocol. We think the real one is more mundane and considerably closer: supply concentrated in the hands of holders who are structurally obliged to sell.
The migration of coins off exchanges into long-term custody has been sold to the market as an unambiguous positive. Illiquid supply rises, available float shrinks, price must follow. The first half of that is true. The conclusion does not follow.
A meaningful portion of that illiquid supply does not sit with individuals holding on conviction. It sits in corporate treasuries and exchange-traded products. A corporate treasury has debt, covenants, auditors, and shareholders. A fund has an obligation to meet redemptions. Neither enjoys the luxury of waiting out a drawdown. They sell when an obligation matures or a condition is breached, not when they judge the price to be right.
The consequence is specific to Bitcoin because Bitcoin, not the broader crypto market, is where this institutional inventory is concentrated. In a deep decline, the very coins the market classified as permanently removed return to it — at the worst moment, in size, and into an order book that has grown thin precisely because those coins were absent for so long. That is the mechanism behind the kind of overshoot we describe toward $30,000–$32,000, which will afterwards be explained as irrational panic. It is not irrational. There is simply nobody on the other side.
A second layer compounds this. Bitcoin is increasingly used as collateral within traditional finance. Collateral has the property of demanding top-ups precisely when its value falls. The larger the share of Bitcoin pledged against borrowings, the higher the probability of a forced-liquidation cascade — a mechanism that has produced every major crash in financial history and that has nothing to do with the merits of the underlying asset. Readers who want the institutional context will find it in our report on institutional crypto adoption.
How the Rest of the Market Behaves in This Scenario
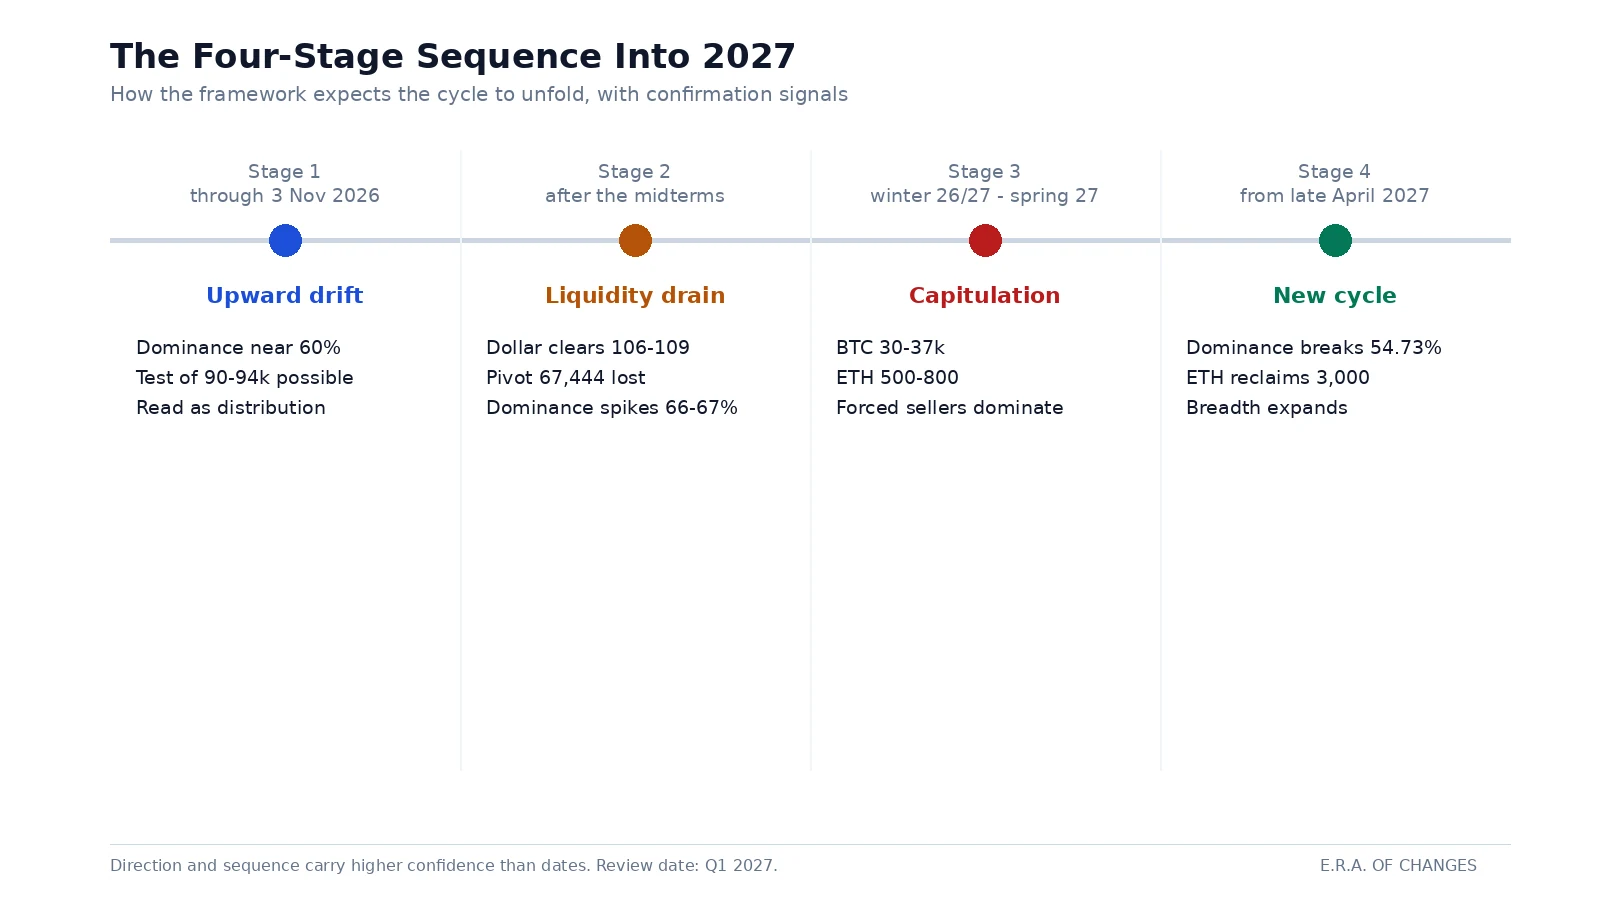
Our sequencing for the broader market follows four stages.
Stage one, through November 3, 2026. An upward-drifting range. Bitcoin dominance holds near 60%. Altcoins underperform on a relative basis despite occasional sharp rallies.
Stage two, after the midterms. Liquidity tightens, the dollar advances, and Bitcoin loses $67,444. Dominance makes a final spike toward 66–67% as capital flees illiquid tokens into Bitcoin and stablecoins faster than it flees Bitcoin itself.
Stage three, winter 2026/27 into spring 2027. Capitulation. Bitcoin searches for a floor in the $30,000–$37,000 band. Ethereum and smaller assets decline considerably more; our reference zone for Ethereum in that phase is $500–$800, a level most participants currently treat as unthinkable, which is itself part of the argument.
Stage four, from late April 2027. A new cycle begins, led first by Bitcoin, then by Ethereum, and only afterwards broadening outward. The sequence of confirmation we watch: a capitulation low that refuses to be broken on bad news; a reversal in the dollar index; dominance returning below 59.61% and then breaking 54.73%; Ethereum reclaiming $3,000 with a series of higher lows against Bitcoin; and finally participation expanding from large infrastructure tokens to mid-capitalisation assets.
The single most expensive mistake available in the coming months is buying altcoins because Bitcoin rallied toward $90,000–$94,000. In the first phase of a move, capital concentrates in Bitcoin. In a liquidity shock, altcoins lose against the dollar and against Bitcoin simultaneously.
What Is Structurally Different About This Cycle
Each Bitcoin cycle carries a claim that the current one is unlike its predecessors. The claim is usually made to justify a higher price. It is more useful to ask what has genuinely changed in the plumbing, because structural change alters the shape of a drawdown even when it does not prevent one.
Three things are materially different in 2026.
The holder base has institutionalised. A significant share of supply now sits with entities that report to boards, auditors and regulators. This dampens emotional selling and amplifies procedural selling. Retail panic arrives in a day and exhausts itself; institutional deleveraging arrives on a schedule and continues regardless of sentiment.
Access has been intermediated. Exchange-traded products have become the dominant route for new allocation. That lowers the barrier to entry and, less obviously, lowers the barrier to exit. A pension allocator who can express a Bitcoin view with a single ticker can also remove it with a single ticker, in a risk committee meeting, alongside other reductions, without any crypto-specific conviction being involved at all.
Bitcoin has entered the collateral system. It is increasingly pledged, lent against, and embedded in structured products. This is widely described as maturation. It is also the mechanism by which an idiosyncratic decline becomes a systemic liquidation, because collateral calls are automatic and indifferent to narrative.
The net effect is a market with lower day-to-day volatility and higher tail risk than previous cycles. Investors who conclude from the first half of that sentence that the asset has become safer have read only half of it.
On-Chain Indicators: What They Say and What They Miss
On-chain analysis is frequently presented as a parallel, superior view of the market. In our framework it occupies a narrower and more defensible role: it tells you where you are in the cycle, not what happens next week.
Realized Price
The aggregate cost basis of coins at the time they last moved. Historically, trading below it has coincided with the deep phase of bear markets. In June 2026, with Bitcoin near $62,750, Realized Price sat around $53,381 — meaning price would have needed to fall a further 15% or so to reach the level at which previous cycles found their true floors. It did not. That gap is one reason we treat the 2026 low as incomplete.
MVRV Z-Score
A normalised measure of unrealised profit across the network. It approached the historically significant zone during 2026 without entering it convincingly. Markets that enter and spend time in that zone tend to produce durable lows; markets that merely approach it tend to produce rallies that fail.
Percentage of addresses in profit
Roughly 67% of addresses remained in profit during the 2026 decline. That is not a capitulation reading. Genuine capitulation is characterised by the majority of holders sitting on losses, which creates the exhausted selling that precedes a durable floor. By this measure, the market has not yet done the work.
Long-term holder supply and coin-days destroyed
Long-term holder supply continued rising while short-term holder supply fell from roughly 6 million to 3.5 million coins over six months, with coin-days destroyed declining. Translated: speculative inventory moved into patient hands. This is constructive on a multi-year horizon and tells you nothing at all about the next quarter.
What on-chain data cannot see
It cannot see the dollar index. It cannot see Treasury issuance. It cannot see the covenant on a corporate balance sheet or the redemption notice inside a fund. In a cycle driven by the availability of the funding currency, the most important variables are entirely off-chain — which is precisely why we rank liquidity above every on-chain metric.
Three Scenarios for the Rest of 2026 and 2027
We publish scenarios with probabilities rather than a single forecast, because a single number conceals how the forecast could fail.
Scenario A: Liquidity drain proceeds (base case, ~55%)
The dollar index clears 106–109 and advances toward 120. Bitcoin loses $67,444 with weekly confirmation after the November midterms, declines toward $37,124, and overshoots into the $30,000–$32,000 convergence during the winter–spring window. Dominance spikes to 66–67%, Ethereum reaches the $500–$800 zone, and the cycle low forms between February and April 2027. Recovery begins in the final ten days of April 2027.
Portfolio implication: cash and short-duration instruments outperform; the opportunity is the entry, not the hold.
Scenario B: Managed deceleration (~30%)
Liquidity tightens but authorities act earlier than in our base case. The dollar stalls below 109, Bitcoin holds a wide $55,000–$90,000 range into 2027, and the cycle low is shallower and later. Volatility stays high, direction stays absent, and the asset spends three quarters frustrating both bulls and bears.
Portfolio implication: range discipline, no leverage, and no narrative commitment in either direction.
Scenario C: Early policy pivot (~15%)
Credit stress appears sooner than expected and the Federal Reserve eases pre-emptively. The dollar fails 106 and breaks 97. Bitcoin clears $93,638, recovers $123,792, and the 2026 low is confirmed as the cycle low. This is our invalidation scenario, and we would acknowledge it publicly as such.
Portfolio implication: the debasement phase arrives early, and hard assets lead.
The distribution of probability matters less than the asymmetry of outcomes. In scenarios A and B, patience costs little. In scenario C, the cost of being absent is a missed entry rather than a permanent loss. That asymmetry is why we position for A while explicitly funding the possibility of C.
Bitcoin, Gold and Equities Through Each Phase
Because Bitcoin is routinely compared to gold, it is worth stating how we expect the three major liquid asset classes to behave at each stage of the sequence.
Phase one, liquidity drain. Equities decline, gold declines, Bitcoin declines hardest. Correlations converge. Cash is the only functioning hedge. The common error here is expecting gold or Bitcoin to protect capital during the shock itself.
Phase two, policy response. Volatility collapses, risk assets rally sharply, and the rally is widely interpreted as recovery. Gold typically turns first because it reprices the credibility of the response rather than the growth outlook.
Phase three, debasement. Nominal prices rise across hard assets. This is the phase where Bitcoin's scarcity argument finally does the work its advocates claim for it today — and where the distinction between nominal gains and purchasing-power gains becomes the only measurement that matters.
Our standing recommendation, unchanged for two years: measure the portfolio in gold as well as in dollars. A portfolio that rises in dollars and falls in gold has not grown; it has been diluted while the owner watched a rising number.
What Investors Get Wrong in a Liquidity-Driven Market
Treating ETF inflow data as a forward signal. Flow data describes settled transactions from the previous session. By the time a record inflow is reported, the move that produced it has been priced.
Buying altcoins on Bitcoin strength. In early-phase moves, capital concentrates in Bitcoin. In shocks, altcoins fall against both the dollar and Bitcoin. The window in which altcoins genuinely outperform opens after dominance rolls over, not before.
Confusing low volatility with low risk. The institutionalised holder base has compressed daily ranges. It has not removed tail risk; it has postponed and concentrated it.
Sizing positions for the forecast rather than for the error. Our direction calls are stronger than our dates. A position that survives a six-month timing error converts a correct view into profit; a position that does not, converts the same view into a loss.
Mistaking a halving calendar for a demand forecast. Supply schedules are known years in advance and are therefore priced years in advance. What is not priced is the quantity of dollars available to buy that supply.
A Practical Monthly Check for Bitcoin Investors
A short, repeatable routine is worth more than continuous attention. Ten minutes, once a month, in this order:
- Dollar index. Is it above or below 106–109? Has 109.34 been closed above? Has 97 been broken? This single question answers most of the others.
- The pivot. Is Bitcoin holding $67,444 on a weekly closing basis? Treat intraday breaks as noise and weekly closes as information.
- Dominance. Rising toward 66–67% indicates defensive rotation within crypto. Falling through 59.61% and then 54.73% indicates the opposite.
- Credit conditions. Are high-yield spreads widening alongside a rising dollar? That combination is what converts a drawdown into a cascade.
- Your own forced-seller status. Is any part of your position pledged, leveraged, or needed for spending within twelve months? If yes, you are on the same list as the institutions described above.
What This Framework Cannot Tell You
Honesty about limitations is part of the product, so three statements of what this analysis does not do.
It does not time the low to the week. Our structural reads have been considerably more reliable than our dates, and we have revised the expected low once already during 2026.
It does not price discontinuous events. A protocol failure at a major custodian, an abrupt regulatory reversal in a large jurisdiction, or a geopolitical shock that closes a payment corridor would all dominate everything described here. Liquidity frameworks describe conditions; they do not anticipate accidents.
It does not substitute for position sizing. Every scenario above assumes the reader can survive being early. If that assumption fails, the quality of the forecast is irrelevant to the outcome.
E.R.A. OF CHANGES Analyst’s Perspective
I have been asked repeatedly this year why our Bitcoin view is more negative than that of most research desks, and whether that position has changed as the market stabilised near $80,000.
It has not, and the reason is methodological rather than emotional. We do not forecast Bitcoin as a technology story. We forecast it as the most sensitive instrument on the dollar liquidity curve. Everything we expect for crypto in the next two quarters follows from what we expect for the dollar, for Treasury issuance, and for the political calendar — not from anything happening on-chain.
I will also say plainly where our record is weakest, because it is relevant to how this forecast should be used. Our direction calls have been considerably more reliable than our timing. We are structurally early. In June 2026 we expected the cycle low in the fourth quarter of that year; by August we had moved it to the winter–spring window on evidence that the liquidity drain would take longer to bite. That is a correction we published rather than quietly deleted, and readers should assume the same risk attaches to the dates in this report.
What does not shift is the shape of the sequence: liquidity drain, forced selling, capitulation, policy response, debasement. Investors who understand that order will not be surprised by any individual month.
How E.R.A. OF CHANGES Uses This Framework in Its Research Process
Bitcoin is not analysed in isolation in our process. It enters as one expression of a single macro scenario that also governs our views on the dollar, oil, gold, and equity indices. If those components ever imply different regimes simultaneously, we treat that as evidence of an error in the framework rather than as a diversified set of opinions.
Three principles govern the work. First, ranked drivers: we state explicitly which force dominates, because unranked factor lists are how analysis avoids accountability. Second, falsification conditions with review dates, published alongside every scenario. Third, separation of structure from timing: we report direction and structure with higher confidence than dates, because that is what our track record supports.
The full description of the process, including how models are rebuilt rather than recalibrated, is available in our methodology deep dive, and the systemic-risk instrumentation behind it is documented in Era CrisisMeter.
Frequently Asked Questions
What is a realistic Bitcoin price range for the end of 2026?
Our base case is $40,000–$70,000, with $67,444 as the structural pivot. The upper invalidation band is $90,000–$100,000: sustained trade above $93,638 alongside improving liquidity would indicate that our regime reading is wrong.
What are the two macro factors that matter most for Bitcoin right now?
Dollar liquidity — the dollar index, Treasury cash balances, and net issuance — and the U.S. political calendar, specifically the November 3, 2026 midterm elections, after which the incentive to maintain visibly comfortable financial conditions disappears.
Do ETF flows drive the Bitcoin price?
They transmit it rather than drive it. ETFs do not create new money; they move existing capital into the asset. Flows therefore track macro liquidity rather than operating independently of it, which is why they rarely run against the liquidity cycle for long.
Does the four-year halving cycle still work?
As a calendar, yes. As an explanation of price, decreasingly. More than 95% of supply is mined, and the marginal impact of each issuance cut shrinks as market capitalisation grows. Bitcoin fell more than 50% in 2026 with no change in the issuance schedule.
Is Bitcoin digital gold?
Not in the way the phrase is used. Bitcoin behaves as a high-beta risk asset and converges with other risk assets during liquidation events. The hard-asset narrative supports it only in the debasement phase that follows a monetary response, not during the shock itself.
What is the most important Bitcoin price level to watch?
$67,444. Above it the market remains an upward-drifting distribution range; below it, with weekly confirmation, the structure opens objectives near $37,124 and $30,000–$32,000.
When do you expect the Bitcoin cycle low?
Between the winter of 2026/27 and spring 2027, with the central window for a durable reversal in the final ten days of April 2027, plus or minus four to six weeks.
What is the biggest risk specific to Bitcoin rather than crypto generally?
Concentration of supply among holders obliged to sell — corporate treasuries with covenants and funds with redemption duties — combined with the growing use of Bitcoin as collateral in traditional finance. Both convert “illiquid supply” into forced supply at the worst possible moment.
What would make you abandon this forecast?
Four conditions: Bitcoin above $93,638 and recovering $123,792 with improving liquidity; the dollar index failing 106–109 and breaking below 97; pre-emptive Federal Reserve easing before credit stress emerges; or Bitcoin dominance falling durably below 54.73% before any Bitcoin capitulation.
Why does Bitcoin dominance matter in this framework?
It describes where capital hides during stress. Our model expects a final dominance spike to 66–67% as investors exit illiquid altcoins first. The subsequent return below 59.61% and break of 54.73% is one of the confirmations that a new cycle has begun.
What happens to Ethereum and altcoins in this scenario?
They decline considerably more than Bitcoin during the capitulation phase — our reference zone for Ethereum is $500–$800 — and lead the recovery afterwards, with Ethereum typically outperforming first once dominance rolls over.
Is the current drawdown comparable to previous bear markets?
Not yet. Drawdowns of 86%, 84% and 77% characterised the 2014, 2018 and 2022 cycles. The 2026 decline of roughly 35% from the high, with an interim low near 53%, remains shallow by that standard.
How should long-term investors use a forecast like this?
As a map of sequence rather than a trading signal. The order — liquidity drain, forced selling, capitulation, policy response, debasement — is more reliable than any single date within it, and position sizing should assume the dates may be early.
Does regulation change this outlook?
Not materially for price in 2026. Regulatory clarity reduces the regulatory discount applied by institutions, which is a medium-term structural positive, but it does not create liquidity. See our cryptocurrency regulation guide for the detail.
What single indicator would you watch if you could only watch one?
The dollar index. Not because it is a crypto indicator, but because it is the cleanest available proxy for the availability of the funding currency in which the entire asset class is priced and leveraged.
About E.R.A. OF CHANGES
E.R.A. OF CHANGES is an investment and analytical agency producing macro research, market forecasts and risk analysis for private investors and institutions. Our published work includes dated forecasts with explicit falsification conditions, periodic forecast scoreboards documenting both accurate and failed calls, and a documented methodology describing how our models are built, calibrated and rebuilt.
This report reflects the analytical opinion of its authors. It is not investment advice and not a recommendation to buy or sell any asset. Digital assets are volatile and may lose a substantial portion of their value.
Sources
Monetary and Liquidity Data - FRED: U.S. Treasury General Account - FRED: Nominal Broad U.S. Dollar Index - Federal Reserve: Monetary Policy - U.S. Treasury: Quarterly Refunding
Digital Asset Regulation and Market Structure - U.S. Securities and Exchange Commission - U.S. Commodity Futures Trading Commission - Bank for International Settlements: Fintech and Digital Assets
Internal E.R.A. OF CHANGES Research - Bitcoin Cycles Explained - Bitcoin ETF Adoption Report - Institutional Crypto Adoption Trends - Global Liquidity Explained - Financial Stress Indicators Explained - Era Forecasting Methodology - Era CrisisMeter Explained - Gold Market Outlook 2026 - Cryptocurrency Regulation Explained - Stablecoin Risks Explained - Oil Price Volatility Explained