Executive Summary
Era uses a structured forecasting methodology that combines quantitative risk models with expert judgment, and I want to walk through the actual mechanics of it here rather than just asserting that a process exists. The core sequence begins with a measurable data signal, tests that signal against historical analogues, examines whether liquidity can actually support the market move the thesis implies, and then seeks confirmation through derivatives and options-market positioning before any position or published forecast is finalized.
Roughly 70% of this process is model-driven, and 30% depends on analyst judgment, though that ratio shifts hard toward judgment during unprecedented geopolitical or structural breaks, which I’ll walk through with a specific example of where our own models got something wrong. Era does not treat a forecast as permanent once published. Every thesis carries pre-defined invalidation conditions, tied to economic data, liquidity behavior, and shifts in the Fed’s own reaction function, not to whether the price moved against us for a week.
This methodology is designed to estimate probabilities, identify asymmetric risk-reward, and control downside. It is not designed to guarantee exact outcomes, and I’d be skeptical of anyone claiming theirs does.
Key Takeaways
- Era’s forecasting process follows a defined sequence from signal detection through to position selection, it doesn’t start with a conclusion and work backward.
- Quantitative models account for roughly 70% of the framework; analyst judgment contributes the remaining 30%.
- Liquidity analysis determines whether a fundamentally correct thesis can actually translate into market movement on any usable timeline.
- Options-market data is used as confirmation for a thesis, not as a standalone prediction tool on its own.
- Cross-currency basis swaps help reveal hidden stress in global dollar funding before it shows up anywhere else.
- Every forecast carries explicit invalidation conditions, decided in advance, not improvised after the fact.
- The methodology itself keeps evolving, particularly around geopolitical risk analysis and detecting nonlinear shocks faster.
Introduction
Most forecasts show you the conclusion and hide the process that produced it. I think that’s a real problem, and it’s worth being specific about why.
If you can’t see the assumptions behind a forecast, you can’t actually assess whether it deserves your confidence. A failed forecast can quietly get rewritten after the fact, with the original assumptions never disclosed in the first place. Model limitations stay hidden from view. And a genuinely successful call can reflect luck as easily as a repeatable process, there’s no way to tell the difference from the outside if the process itself was never shown.
Our approach is built around a different standard: a credible forecast has to show how the conclusion was actually reached, what specific evidence supports it, what would prove it wrong, and how the result will later be evaluated in public. That last part matters as much as the forecast itself, which is why every forecast-driven piece we publish ultimately traces back to the Forecast Scoreboard archive, the record of how our prior calls actually performed, including the ones we got wrong.
What Is a Forecasting Methodology?
A forecasting methodology is the repeatable process used to collect data, identify signals within it, form a testable hypothesis, assign a probability, test that hypothesis against historical relationships, evaluate current market conditions, select an appropriate risk exposure, define in advance what would invalidate the thesis, and review the outcome once the horizon has passed.
It's worth being precise about what this is not. It is not a single prediction. It is not a trading idea dressed up in more formal language. It is not one economic model run in isolation. It is not simply an analyst's opinion stated with confidence. And it is not a technical indicator crossing a threshold. The distinction that matters most: a forecast is the output. The methodology is the system that produces, tests, and revises that output over time, and a system can be evaluated on its track record in a way a single opinion never can.
What Are Risk Models?
Risk models estimate the probability of adverse outcomes, the potential magnitude of loss if those outcomes occur, sensitivity to changing underlying variables, correlations between different risks that might otherwise look independent, liquidity constraints on any given position, and exposure to genuine tail events.
We use risk models to answer a specific set of questions on an ongoing basis: is systemic stress actually increasing right now, and which macro variables are driving that increase specifically? Can the market keep moving in its current direction despite fundamentals that are visibly deteriorating underneath it? Which scenario, among the plausible ones, currently offers the most favorable risk-reward? And what specific evidence would tell us the thesis behind any of this has become invalid?
I want to be clear about the limits here, because overselling this would undermine the whole exercise: risk models do not eliminate uncertainty. They organize it into something you can actually reason about and act on.
The Era Forecasting Process at a Glance
The full sequence runs: data signal, historical validation, liquidity analysis, options confirmation, instrument selection, position or published forecast, ongoing monitoring, and finally invalidation or resolution.
| Stage | Core Question | Typical Output |
| Signal detection | What is changing? | Initial hypothesis |
| Historical validation | Has this pattern mattered before? | Context and base rate |
| Liquidity analysis | Can the market sustain the expected move? | Timing and confidence adjustment |
| Options confirmation | How is institutional risk being priced? | Confirmation or contradiction |
| Instrument selection | How can the thesis be expressed with controlled risk? | ETF, option structure, or no position |
| Monitoring | Is the evidence strengthening or weakening? | Maintain, reduce, or invalidate |
| Review | What happened and why? | Forecast Scoreboard result |
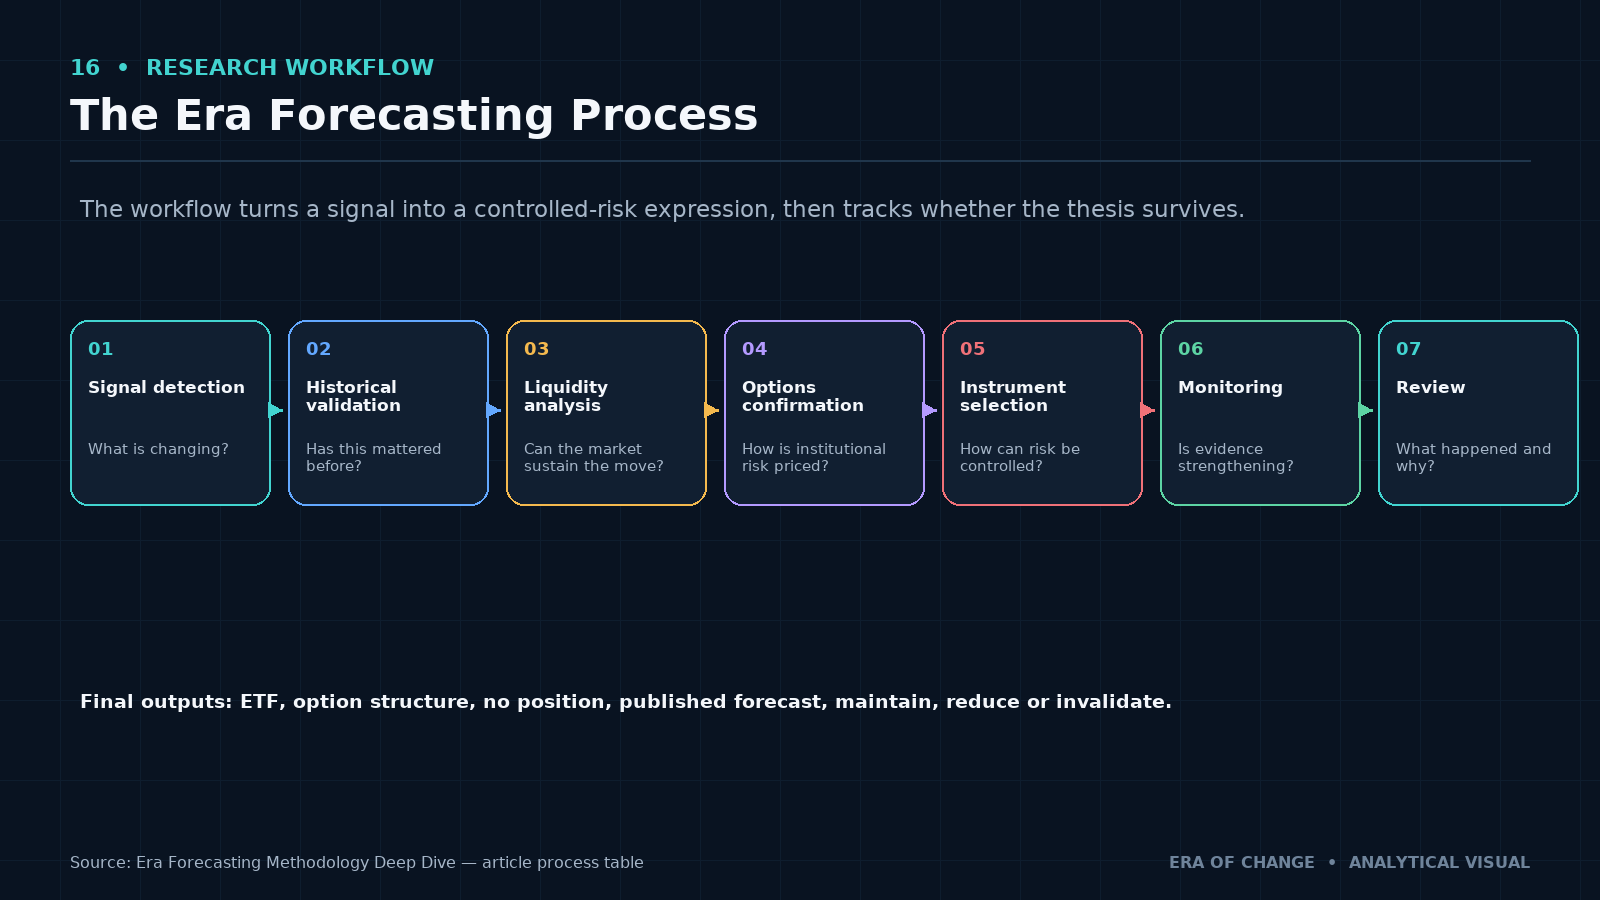
Every step below walks through one row of that table in detail.
Step 1. Detecting a Signal in the Data
Forecasting begins with an observable deviation in the data, not a narrative someone finds compelling. Signals can originate from inflation data, credit spreads, M2 growth, yield-curve shape, labor-market indicators, commodity markets, cross-border capital flows, sovereign-debt dynamics, interbank funding conditions, geopolitical escalation, or options-market positioning itself.
Whatever the source, the signal has to answer a specific set of questions before it earns further attention: what actually changed? How large is the deviation from what would be considered normal? Is it isolated to one series, or part of a broader pattern showing up across multiple indicators at once? Is the change cyclical, structural, or driven by a discrete event? And is the underlying data contemporaneous, leading, or lagging the thing it's supposedly telling you about? A single data point is rarely sufficient on its own. This is exactly why the next four steps exist.
Step 2. Testing the Hypothesis Against Historical Analogues
Once a signal is identified, we compare the current environment against historical periods that shared similar characteristics: comparable inflation regimes, interest-rate environments, debt levels, credit conditions, liquidity backdrops, asset valuations, geopolitical structures, central-bank policy stances, and market concentration.
The purpose of this comparison is specific: estimate a base rate for how often this kind of setup has actually mattered historically, identify the typical transmission mechanism connecting cause to market effect, understand the usual lag between signal and outcome, recognize the conditions under which similar theses have previously failed, and avoid the trap of treating every environment as though it's genuinely unprecedented when it usually isn't.
Why Historical Analogues Are Useful
They reveal how similar combinations of stress actually developed the last time conditions rhymed with today, not a guarantee of repetition, but a genuine base rate grounded in something other than intuition.
Why Historical Analogues Can Mislead
The current environment can differ from its historical analogue in debt scale, market structure, the nature of the likely policy response, available technology, global trade patterns, the prevailing monetary regime, or geopolitical alignment. The principle I keep coming back to: history provides probabilities, not templates. Treating a historical parallel as a template rather than a probability estimate is one of the more reliable ways to be confidently wrong.
Step 3. Liquidity Analysis
This is one of the defining pieces of the methodology, and the question underneath it is one I ask constantly: even if the thesis is fundamentally correct, does the market still have enough liquidity available to move in the opposite direction anyway, for longer than the thesis can survive?
We evaluate M2, bank-credit creation, central-bank balance-sheet trajectories, credit spreads, interbank funding conditions, dollar liquidity specifically, Treasury-market functioning, margin and collateral availability, and cross-border capital flows, all covered in more depth in M2 Money Supply Explained and tracked continuously through the Era CrisisMeter.
Timing depends on liquidity more often than most investors want to admit. A structurally overvalued equity market can keep rising for a surprisingly long time while liquidity remains abundant, regardless of how correct the overvaluation thesis actually is. A genuinely valid recession thesis can be delayed for quarters by cheap refinancing that lets over-leveraged borrowers roll their debt instead of defaulting on it, precisely the dynamic we track in Yield Curve Explained. A geopolitical shock can remain contained if funding markets stay functionally stable through it. And a genuinely modest event can turn systemic if it lands on a system where liquidity was already fragile going in. The message I want every reader to take from this section specifically: fundamentals determine vulnerability. Liquidity usually determines timing.
Step 4. Confirmation Through Options-Market Structure
Once a thesis has cleared the historical and liquidity checks, we look at what the options market is actually pricing. This means monitoring implied volatility, volatility skew, the relationship between put and call pricing, the term structure of volatility across expiries, tail-risk premiums specifically, the VVIX, a volatility-of-volatility measure often called "the VIX of the VIX," institutional demand for downside protection, and open interest broken down by strike and expiry.
Options data reveals things macro data alone genuinely can't: how much institutional hedging demand actually exists right now, what the market's expectations for distribution tails look like, whether fear is concentrated in the near term or further out on the curve, whether a given risk is already heavily priced into the market, and whether protection against that risk is currently cheap or expensive relative to its own history.
I want to state an important limitation plainly, because it's easy to over-rely on this data: options markets can reflect hedging mechanics, dealer positioning, and temporary flows just as easily as they reflect genuine forward-looking information. They don't hand you objective truth. Options-market structure confirms or challenges a thesis. It does not create the thesis by itself, and treating it as though it does is a mistake I've watched other analysts make repeatedly.
Step 5. Selecting the Lowest-Risk Expression
Identifying a correct forecast does not automatically justify taking a specific position, and this is the step most forecasting content skips entirely. We consider broad ETF exposure, index-level exposure, sector-specific exposure, directional options, put spreads, long-dated options, simply holding cash with no position at all, or hedged relative-value structures.
The decision runs against a consistent set of criteria: maximum defined loss, available liquidity in the instrument itself, the appropriate time horizon for the thesis, current volatility pricing, correlation risk against the rest of a portfolio, path dependency, how much the route to the outcome matters, not just the destination, the probability of being forced to exit early for reasons unrelated to the thesis, and the upside relative to the premium or capital actually being put at risk. The principle underneath all of it: the best forecast in the world can still produce a poor investment outcome if it's expressed through the wrong instrument.
Models vs. Analyst Judgment
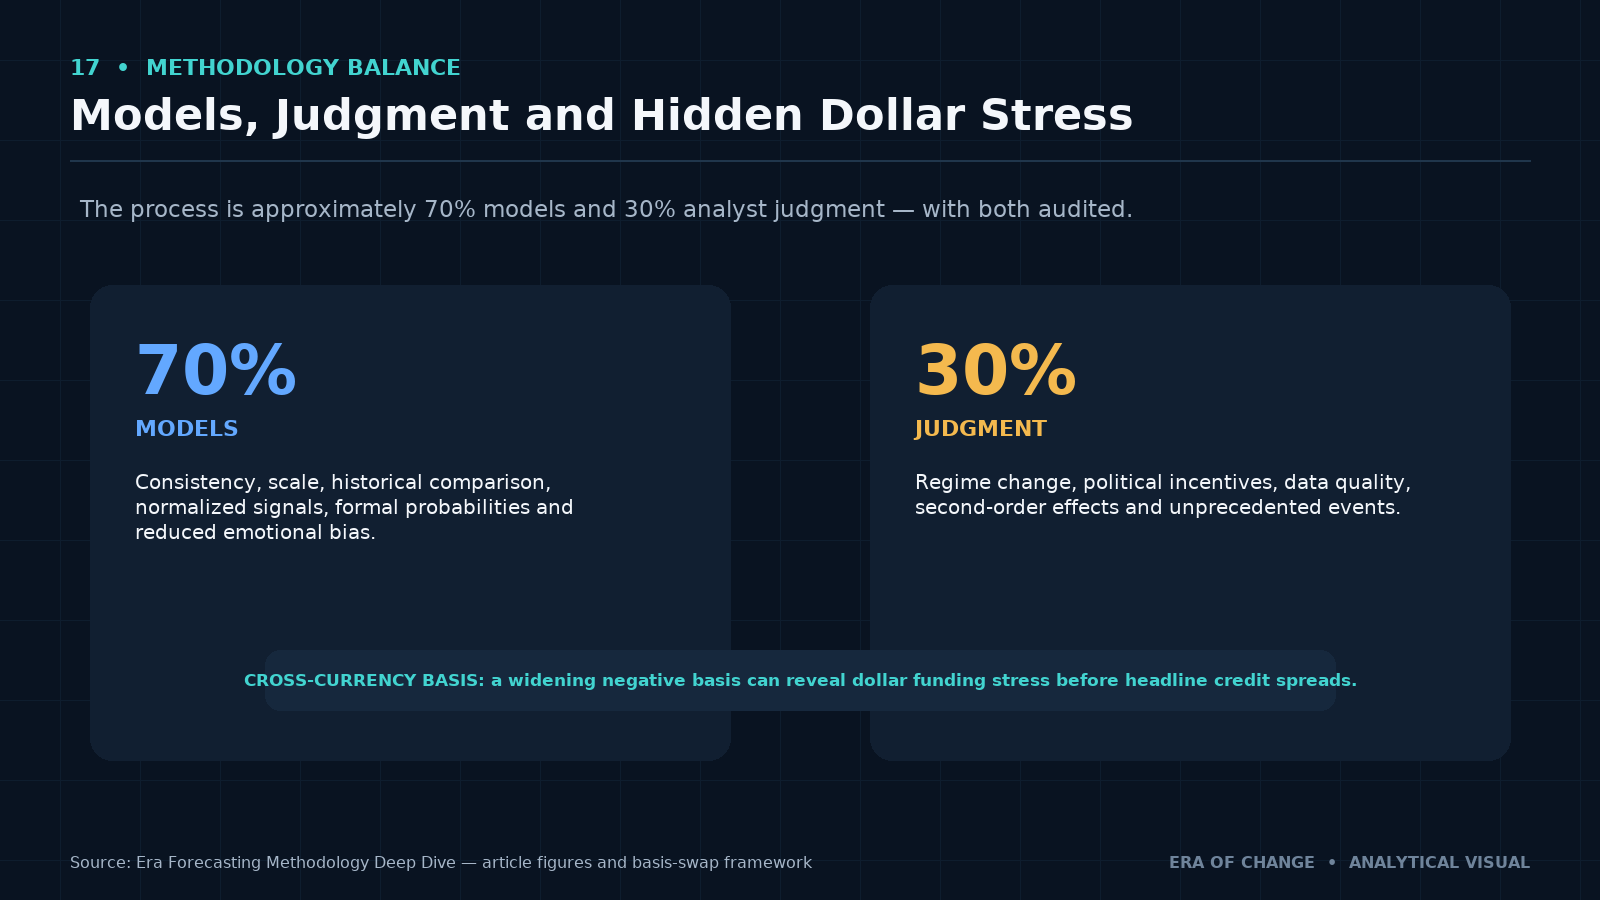
Era's process runs approximately 70% models, 30% analyst judgment, and I think both halves of that ratio deserve honest explanation rather than a vague gesture at "a blend of art and science."
Models contribute consistency across time and analysts, the ability to process at scale, genuine historical comparison, normalization of signals that would otherwise be apples-to-oranges, formal probability estimation, and removal of the emotional bias that creeps into every human decision made under uncertainty and time pressure.
Judgment contributes something models structurally cannot: interpretation of genuinely unprecedented events, assessment of political incentives that don't show up cleanly in economic data, recognition that a regime has actually changed rather than just moved within its normal range, evaluation of data quality itself, identification of second-order effects a model wasn't built to see, and the willingness to adjust when historical relationships that used to hold have quietly stopped holding.
When Judgment Becomes More Important
I want to walk through a specific example of where our own models fell short, because I think a methodology page that only describes successes isn't a credible one.
Through most of 2021, a large share of the forecasting community, Era's models included, classified the post-pandemic inflation surge as transitory. That classification relied on historical relationships built around supply-chain normalization following past disruptions, typical labor-force reentry patterns, standard money-velocity behavior, and the usual pace of global trade reopening after a shock. Fed Chair Jerome Powell told the Senate Banking Committee on November 30, 2021, that it was "probably a good time to retire" the word transitory, and Treasury Secretary Janet Yellen later said directly that she regretted using the term, acknowledging that to most people, "transitory" implies a matter of weeks or months, not years.
What the models, ours included, underestimated was the sheer scale of the monetary and fiscal expansion actually underway, genuine structural supply constraints rather than temporary ones, the early stages of deglobalization, a labor market that had changed in ways the old models weren’t built to capture, and chronic underinvestment in energy and commodity production building up in the background. The lesson I take from this, and the one I want every reader to sit with: models trained on normal regimes can fail precisely when the regime itself changes underneath them, which is exactly the situation the models are least equipped to recognize while it’s happening.
I want to be careful not to overcorrect into implying judgment is always superior, it isn’t, and treating it that way invites its own kind of bias. Every discretionary override of our models gets documented at the time it happens and audited later against the outcome, the same way a model-driven call would be.
The Least-Known Indicator in the Era Framework: Cross-Currency Basis Swaps
This is, in my experience, the single most underappreciated indicator most retail-facing analysis never mentions at all.
A cross-currency basis swap allows institutions to exchange funding in one currency for funding in another (dollars for yen, dollars for euros) and the basis is the additional premium or discount required beyond what the theoretical interest-rate differential between the two currencies alone would predict. In a well-functioning market, this basis should sit close to zero under covered interest parity. It almost never does, and the size and direction of that gap tells you something real.
Global banks and corporations outside the United States frequently need U.S. dollars to fund dollar-denominated assets and obligations, and stress in dollar funding often shows up in cross-currency basis markets before it becomes visible anywhere else. A widening negative basis signals that institutions are effectively paying a premium simply to obtain dollars through the swap market rather than directly, which can reveal hidden liquidity pressure building inside the global banking system well before it surfaces in headline credit spreads.
Here's a simplified way to think about it: if obtaining dollars through a swap becomes materially more expensive than covered interest parity would suggest it should be, the market is telling you dollars are becoming scarce relative to demand for them, somewhere in the system, right now. During the 2008 financial crisis, short-term basis deviations reached roughly negative 200 basis points as European institutions' dollar-denominated assets had sharply outgrown their dollar deposit base, and the basis widened sharply again in March 2020 as the pandemic shock hit simultaneously with a broad dash for dollar liquidity worldwide. In both episodes, the basis moved before the stress was obvious anywhere else an ordinary investor would have been looking.
What it can indicate: bank funding stress specifically, an offshore dollar shortage, balance-sheet constraints at the institutions most exposed, cross-border capital pressure building quietly, and rising demand for safe dollar liquidity generally. It comes with real limitations worth stating plainly, regulatory balance-sheet costs can influence the basis independent of genuine funding stress, quarter-end and year-end reporting effects distort readings predictably, the basis behaves differently across currencies and maturities, and it has to be interpreted alongside interbank spreads, broader credit-market conditions, and the state of central-bank dollar swap lines rather than read in isolation.
The chain runs: cross-currency basis widens, dollar funding stress builds, bank balance-sheet pressure follows, and global liquidity tightens as a consequence, often before that tightening shows up anywhere more visible.
How Era Assigns Confidence and Probability
Forecast probabilities are built from combined evidence, not a single input treated as decisive on its own: the strength of the original data signal, its historical frequency, the number of independent indicators confirming it, current liquidity conditions, options-market pricing, the probability attached to any relevant geopolitical development, the likely policy response, the quality of the underlying data itself, the degree of disagreement across our own models, and the specific time horizon in question.
We classify confidence into three tiers. Low confidence means limited evidence or meaningful disagreement across our own models. Moderate confidence means several signals genuinely align, but important uncertainties remain unresolved. High confidence means broad confirmation across data, liquidity conditions, and market pricing simultaneously. I want to be explicit about something easy to lose sight of: high confidence never means certainty. It means the available evidence converges more than it usually does. Nothing more, nothing less.
Internal Stop-Loss: How Era Invalidates a Thesis
Every forecast we publish defines its key assumptions, the signals that would confirm it's playing out as expected, the specific thresholds that would invalidate it, a review date, the maximum risk being taken, and the conditions under which we'd reduce or close the position entirely.
Take a bearish macro thesis as a concrete example. It would be invalidated if two consecutive labor reports come in materially stronger than expected, if CPI accelerates beyond a pre-defined threshold set before the thesis was published, if the Federal Reserve's reaction function itself shifts, if markets respond to stress with renewed liquidity inflows rather than tightening further, or if credit and funding conditions genuinely improve rather than continuing to deteriorate. The Fed's reaction function, worth defining precisely, is simply how the central bank changes policy in response to inflation, employment, financial stress, and broader market conditions and when that function itself shifts, every thesis built on the old version needs to be reassessed from scratch, not patched.
The key distinction I want to draw sharply: a thesis is not invalidated merely because price moves against it for a week, or a month. It's invalidated when the underlying causal assumptions that supported it in the first place stop holding. Those are genuinely different failure modes, and conflating them is how investors end up either abandoning good theses too early or defending bad ones far too long.
Price Stop-Loss vs. Thesis Stop-Loss
| Price Stop-Loss | Thesis Stop-Loss |
| Triggered by market price | Triggered by changing evidence |
| Controls position loss | Controls analytical error |
| Can be hit by ordinary volatility | Requires a genuine causal reassessment |
| Mechanical | Methodological |
| Protects capital | Protects process integrity |
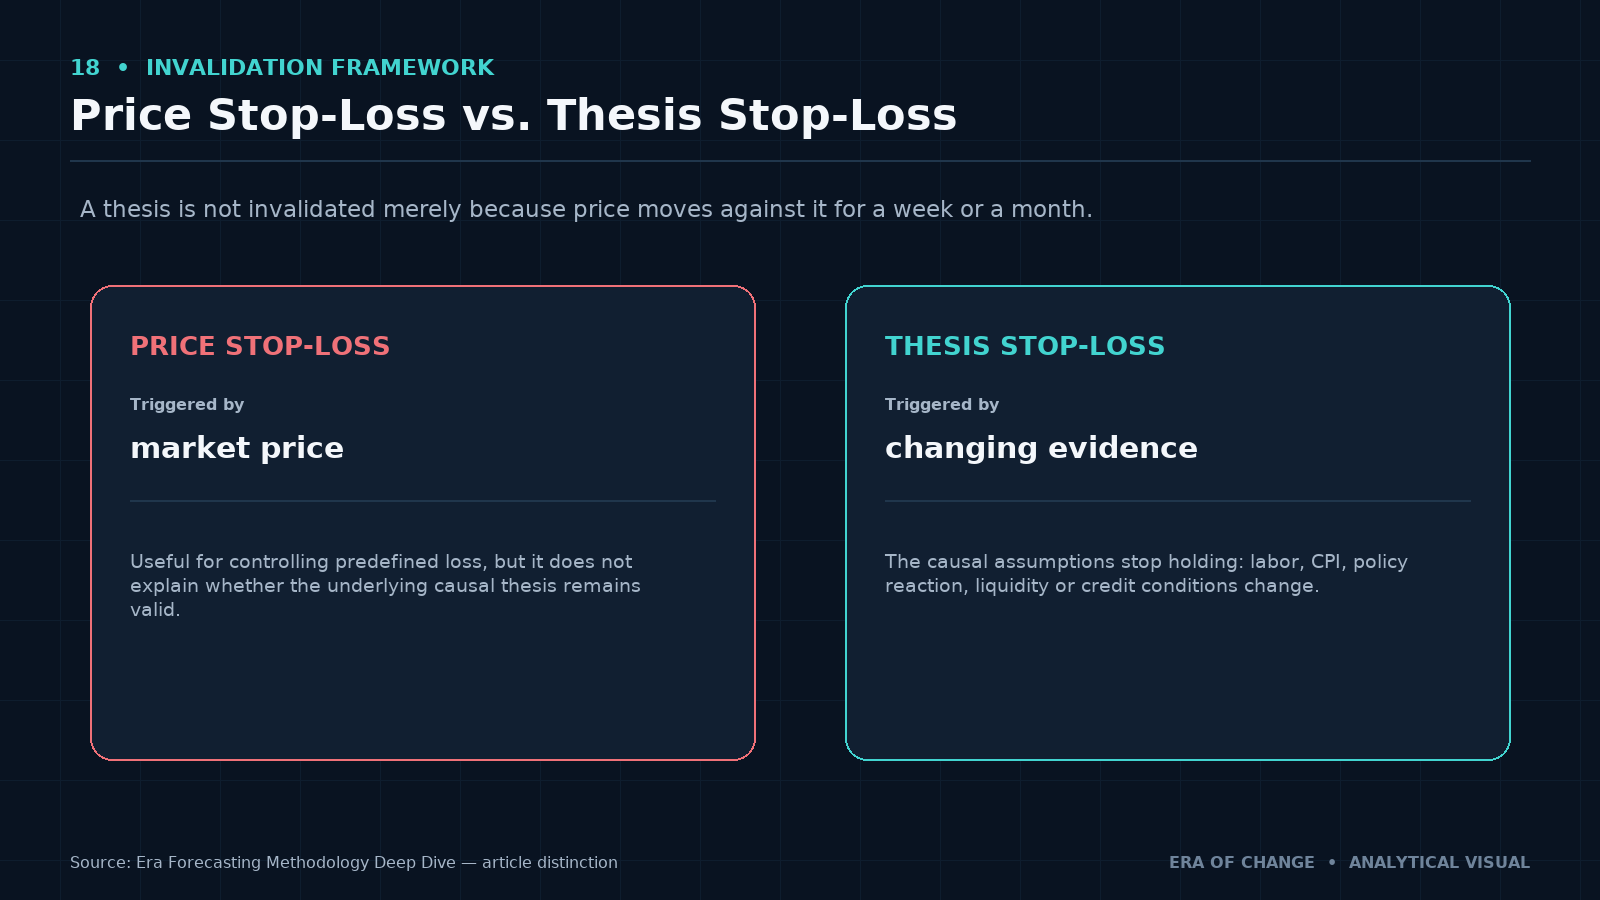
Robust risk management uses both, and they serve genuinely different functions. A forecast can remain analytically sound while a position tied to it gets reduced purely for risk-management reasons unrelated to the thesis itself. And conversely, a position that's currently profitable should still be closed if the thesis behind it has been invalidated: profit is not evidence that the underlying reasoning was correct, and treating it as such is a quiet way to erode process discipline over time.
How the Era Global Risk Index Has Evolved
The index itself is not static, and I think it’s worth documenting how it’s actually changed rather than presenting it as a finished product. Recent improvements include better quantification of geopolitical news specifically, more advanced natural-language-processing classification of that news, faster detection of nonlinear shocks as they’re developing rather than after they’ve resolved, improved weighting of escalation signals relative to routine diplomatic noise, and a stronger connection between political events and the specific financial transmission channels they move through.
NLP processing helps identify escalation language, sanctions activity, trade restrictions, military mobilization, shipping disruption, resource controls, policy shifts, and changes in diplomatic posture, across a volume of text no team of human analysts could realistically process in real time on its own. I want to be precise about what this technology does and doesn’t do: NLP does not replace analyst review. It improves the speed and consistency with which large volumes of text get processed, so that analyst attention gets directed toward what actually matters rather than spent scanning everything manually. The full architecture behind how all of this feeds into a single daily score is covered in Era Global Risk Index.
Current Limitations of the Methodology
This section matters as much as anything else on this page, and I’d be doing readers a disservice by leaving it out or softening it.
Hidden capital flows. Some cross-border flows are genuinely difficult to observe in real time: private transactions, offshore structures, informal settlement channels, capital routed through intermediaries specifically to obscure its origin, and reporting that arrives with a meaningful delay.
Off-balance-sheet obligations. Derivatives exposure, guarantees, structured products, shadow-banking activity, contingent liabilities, and unreported leverage can all sit outside what standard data captures, sometimes for years before they surface.
Data publication lags. Some official indicators arrive well after the underlying conditions they describe have already changed, the exact limitation of GDP and CPI we’ve written about elsewhere as the rear-view mirror of macroeconomics.
Regime change. Historical relationships can weaken or break entirely during genuinely unprecedented monetary or geopolitical shifts, precisely the 2021 inflation example above.
Reflexivity. Forecasts, investor positioning, and policy responses to a developing situation can all alter the very outcome being forecast, which is a genuinely difficult problem for any model built on the assumption that the system being observed isn’t watching itself back.
Exogenous shocks. Pandemics, infrastructure failures, cyberattacks, and sudden military events are frequently not predictable from structural financial data at all, no matter how sophisticated the model.
The statement I want to leave you with here: this methodology is designed to improve probabilities and preparedness. It is not designed to eliminate uncertainty, and any framework that claims otherwise should be treated with real skepticism.
How Era Avoids Overfitting
A model is overfit when it explains historical data extremely well but fails on new, unseen conditions, it has essentially memorized the past rather than learned something that generalizes to the future. This is a well-documented problem in quantitative finance specifically, where repeated strategy testing against the same historical dataset can produce apparently strong backtested performance that evaporates the moment it's applied to genuinely new data.
Our safeguards include testing across multiple distinct historical periods rather than one favorable window, deliberately avoiding excessive indicator complexity that would make overfitting easier, separating training and evaluation periods wherever the data structure allows it, reviewing genuine out-of-sample performance rather than only backtested results, stress-testing our own indicator weights under conditions they weren't originally calibrated on, comparing model output against simple benchmarks to confirm the added complexity is actually earning its keep, publishing forecasts that turned out to be wrong rather than quietly retiring them, and never changing methodology retroactively without disclosing exactly what changed and when.
How Forecasts Are Published and Tracked
The workflow runs in a fixed sequence: define the forecast precisely, record its publication date, specify the time horizon it covers, state the expected direction or range, record the assumptions it rests on, define the invalidation conditions in advance, assign a confidence classification, publish it, monitor the evidence as it accumulates, and review the outcome in the Forecast Scoreboard.
Outcomes get classified honestly: correct, partially correct, incorrect, still developing, or invalidated before resolution, the last category covering cases where the thesis's own stated conditions broke down before the horizon was reached, which is a genuinely different outcome from simply being wrong and deserves to be recorded as such.
Example Forecast Workflow
Here’s a structural example that demonstrates the methodology without exposing our proprietary weights.
Signal: High-yield spreads begin widening while equity volatility remains unusually low, a divergence between what credit markets and equity markets are pricing simultaneously.
Historical analogue: A similar divergence between credit and equity pricing has appeared before previous credit-led slowdowns, giving us a base rate to work from rather than treating the current divergence as unprecedented.
Liquidity analysis: Dollar funding conditions and M2 growth are both deteriorating at the same time the spread divergence appears, which argues the market may lack the liquidity cushion to simply absorb the signal and move on.
Options confirmation: Long-dated downside protection remains relatively inexpensive despite the credit signal, suggesting the broader options market hasn’t yet priced the same stress the credit market is already showing.
Instrument selection: A defined-risk put spread, rather than an unlimited short position, expresses the thesis with a known maximum loss rather than open-ended exposure.
Invalidation: The thesis is invalidated if credit spreads tighten back toward their prior range, labor data comes in materially stronger than expected, and liquidity conditions reaccelerate rather than continuing to deteriorate.
Review: The forecast gets evaluated publicly at the end of its stated horizon, win or lose, in the Forecast Scoreboard.
How Era's Methodology Differs From Common Forecasting Approaches
| Approach | Primary Input | Main Limitation |
| Consensus forecasting | Economist surveys | Herding behavior and slow revision |
| Technical analysis | Price patterns | Can ignore underlying macro causality entirely |
| Econometric models | Historical relationships | Vulnerable to regime change |
| News sentiment | Language and headlines | Measures attention more than actual financial impact |
| Single-indicator models | One leading signal | High false-positive risk |
| Era methodology | Data, analogues, liquidity, options, judgment | More complex, and still limited by hidden data |
I'm not going to claim Era's approach is universally superior to every one of these. Each has genuine strengths in specific contexts. What I'd argue is that our advantage is integration and transparency: combining several of these inputs deliberately, and showing our work, rather than presenting a single input as though it were the whole answer.
Era Analyst's Perspective
From Nikolai Fainizkii, CEO & Senior Analyst, Era of Change
"I get asked constantly why we bother publishing a methodology page at all, given that it hands competitors a roadmap. My answer is that the roadmap isn't actually the valuable part. Any serious analyst can read this page and understand our process in an afternoon. What they can't replicate is twenty years of pattern recognition across cycles, or the discipline to actually follow the process when a position is losing money and every emotional instinct says to abandon the thesis or double down on it.
The cross-currency basis swap is the clearest example I have of why this process matters more than any single indicator. It's not a metric retail investors track, and most financial media never mentions it. But in 2008 it moved to roughly negative 200 basis points as European banks quietly ran out of dollar funding, and it moved again in March 2020 for the same underlying reason. Both times, it was signaling real stress in the global banking system before that stress was visible anywhere a typical investor would have been looking.
What I want readers to take from this page isn't the specific indicators. It's the discipline underneath them. We got post-COVID inflation wrong in 2021 because our models leaned on historical relationships that the actual regime had already broken. We corrected because the process itself is built to force that reassessment rather than let us quietly rationalize a wrong call. That's the actual product here, not the forecasts themselves, but the willingness to be proven wrong in public and adjust accordingly."
— Nikolai Fainizkii, CEO & Senior Analyst, Era of Change
How Readers Should Interpret Era Forecasts
Every forecast we publish is probabilistic, not a guarantee, and time horizons genuinely matter: a thesis that's correct over 18 months can look wrong for the first six of them. A thesis being correct in direction doesn't mean it plays out on the timeline originally expected; markets can take considerably longer to confirm a fundamentally sound view than the original forecast anticipated. A published market position and a broader macro forecast are related but distinct things, and confidence in any given thesis can and should change as new data arrives. That's a feature of the process, not a sign it failed. Any revision we publish gets dated explicitly, and no model, ours included, can guarantee returns.
Frequently Asked Questions
What is a forecasting methodology?
A forecasting methodology is the repeatable process used to collect data, identify meaningful signals, form and test a hypothesis against historical relationships, evaluate market conditions, select an appropriate risk exposure, define invalidation conditions in advance, and review the outcome afterward. It's the system that produces and revises forecasts over time, not a single prediction on its own.
What are risk models?
Risk models are quantitative frameworks that estimate the probability of adverse outcomes, potential magnitude of loss, sensitivity to changing variables, correlations between different risks, liquidity constraints, and tail-event exposure. They organize uncertainty into something that can be reasoned about systematically, rather than eliminating that uncertainty.
How does Era produce economic forecasts?
Era's process moves through five stages: detecting a data signal, testing it against historical analogues, analyzing whether liquidity conditions can support the expected move, seeking confirmation through options-market pricing, and selecting the lowest-risk way to express the resulting thesis. Every forecast published this way carries defined assumptions and invalidation conditions from the outset.
What percentage of Era's process is model-driven?
Approximately 70% of Era's forecasting process is model-driven, with the remaining 30% dependent on analyst judgment. That balance shifts meaningfully toward judgment during unprecedented geopolitical or structural breaks, when historical relationships the models rely on are more likely to have already changed.
Why does Era use analyst judgment?
Judgment contributes interpretation of genuinely unprecedented events, assessment of political incentives that don't appear cleanly in economic data, recognition of regime changes as they're happening, evaluation of underlying data quality, and identification of second-order effects models weren't built to capture. Every discretionary override is documented at the time and audited later against the actual outcome.
What is liquidity analysis?
Liquidity analysis evaluates whether the financial system currently has enough available capacity, measured through M2, credit growth, central-bank balance sheets, credit spreads, and dollar-funding conditions, to actually support a given market move, independent of whether the underlying macro thesis is fundamentally correct. Fundamentals determine vulnerability; liquidity conditions usually determine the timing.
How are options used in forecasting?
Options-market data, including implied volatility, volatility skew, and tail-risk pricing, reveals how institutional capital is actually hedging and where the market currently prices distribution tails. It serves as confirmation or contradiction of a thesis already built from macro and liquidity analysis, not as a standalone forecasting tool on its own.
What are cross-currency basis swaps?
Cross-currency basis swaps let institutions exchange funding in one currency for another, and the basis is the premium or discount required beyond the theoretical interest-rate differential alone. A widening negative basis signals rising stress in global dollar funding, often before that stress becomes visible through more commonly watched indicators like credit spreads.
How does Era decide a forecast is wrong?
A forecast is considered invalidated when the underlying causal assumptions that supported it no longer hold, not simply when the market price moves against the position temporarily. Every published thesis defines specific invalidation conditions in advance, tied to data thresholds, liquidity behavior, and shifts in policy, so that reassessment is triggered by evidence rather than by discomfort with short-term price action.
What is a thesis stop-loss?
A thesis stop-loss is triggered by changing evidence rather than by market price, and it protects the integrity of the analytical process rather than simply limiting position loss. It requires an active causal reassessment, distinct from a mechanical price stop-loss, which can be triggered by ordinary volatility regardless of whether the underlying thesis remains sound.
How does Era measure forecast accuracy?
Every published forecast is tracked from its original publication date through its stated time horizon and reviewed publicly in the Forecast Scoreboard, with outcomes classified as correct, partially correct, incorrect, still developing, or invalidated before resolution. This classification system is applied consistently, including to forecasts that turned out to be wrong.
What are the limitations of economic forecasting models?
Economic forecasting models are limited by hidden capital flows that resist real-time observation, off-balance-sheet obligations that aren’t captured in standard data, publication lags in official statistics, the risk of historical relationships breaking down during genuine regime change, reflexivity between forecasts and the outcomes they’re forecasting, and exogenous shocks that structural financial data simply cannot predict.
About Era of Change
Era of Change is an independent macroeconomic research and geopolitical intelligence firm providing institutional-quality analysis for investors worldwide. Its research combines macroeconomics, financial markets, blockchain analytics, artificial intelligence, and geopolitical risk within proprietary forecasting frameworks designed to identify structural market changes before they become broadly recognized.
Era's forecasting methodology combines quantitative risk models, historical analysis, liquidity conditions, derivatives-market information, and expert judgment. Forecasts are published with defined assumptions, monitored against observable evidence, and reviewed through the Era Forecast Scoreboard. Our full methodology, live index reading, and forecast archive are available at eraperemen.info/en.
The content published by Era of Change is for informational and educational purposes only and does not constitute financial, investment, legal, or tax advice. All views expressed are the personal analytical perspective of the author. Past forecast accuracy does not guarantee future results. Readers should conduct their own research and consult a qualified financial professional before making any investment decisions.
Sources
Official Economic Data
Market and Derivatives Data
- Cboe / Schwab: What Is VVIX and Why Does It Matter?
- BIS Quarterly Review: Covered Interest Parity Lost — Understanding the Cross-Currency Basis
- BIS Quarterly Review: Dollar Debt in FX Swaps and Forwards — Huge, Missing and Growing
- BIS Quarterly Review: The Basic Mechanics of FX Swaps and Cross-Currency Basis Swaps
- Dallas Fed: Swap Lines Curbed Global Dollar Shortages During COVID-19 Crisis
Academic and Methodological Research
News and Historical Record
- Fox Business: Powell Admits Fed Got It Wrong on Inflation, Says They Should Stop Calling It "Transitory"
- The Hill: Yellen Says She Regrets Saying Inflation Was "Transitory"
Internal Research
- Era Global Risk Index
- Era CrisisMeter Explained
- M2 Money Supply Explained
- Yield Curve Explained
- Monthly Forecast Review: June Review (Forecast Scoreboard)
- Scenario Planning for Investors
— Nikolai Fainizkii, CEO & Senior Analyst, Era of Change



