.
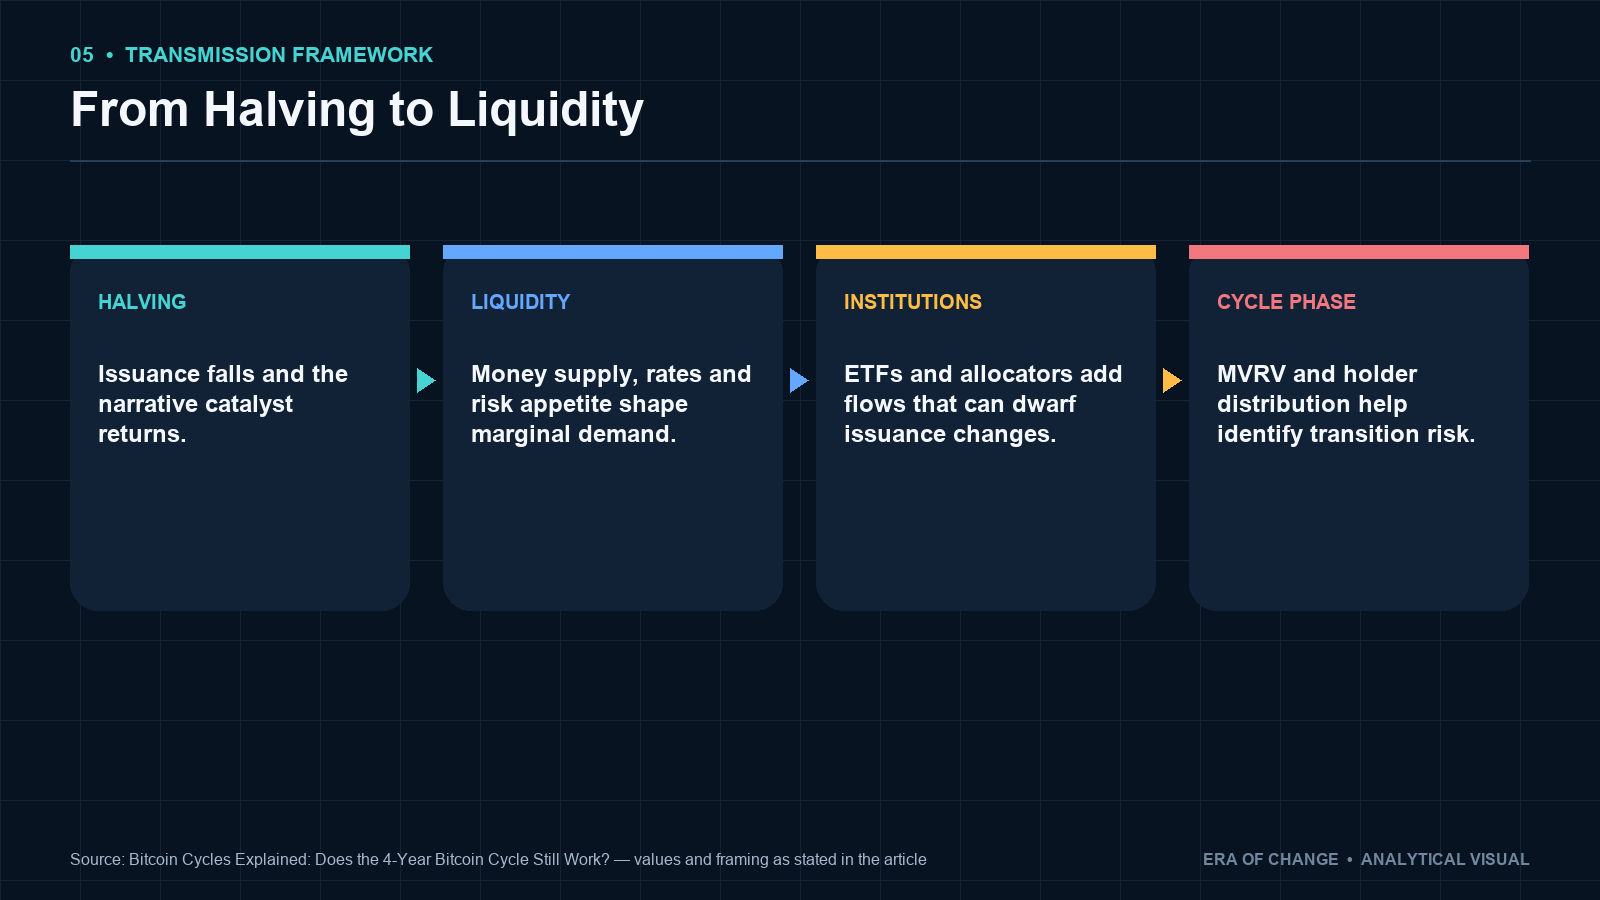
Bitcoin has historically moved through multi-year expansion and contraction cycles that roughly follow its four-year halving schedule. The traditional explanation is simple: every halving reduces new Bitcoin issuance, creating a supply shock that, combined with steady demand, pushes prices higher. Peak. Crash. Accumulate. Repeat.Era’s view is that this relationship has structurally weakened, not disappeared, but changed in the mechanism that drives it. As Bitcoin has grown into a trillion-dollar-scale asset, the marginal supply reduction from each halving becomes a smaller fraction of total capital flows. Bitwise's December 2025 outlook reported that U.S. spot Bitcoin ETFs had purchased 710,777 BTC since launch, versus estimated new issuance of 363,047 BTC over the same period through December 5, 2025. This is a dated cumulative comparison, not a full-year 2025 net-inflow total. Institutional allocation, ETF demand, global money supply, Federal Reserve policy, and long-term-holder distribution behavior now play a larger role in determining where the cycle is heading than the halving date alone. Source.
The halving remains a powerful psychological and narrative catalyst. It is not the fundamental force it once was.
Era monitors two indicators in combination to identify cycle transitions: the MVRV Z-Score, which measures how far market value has stretched from realized value, and Long-Term Holder Net Position Change, which tracks whether the Bitcoin that matters most is being accumulated or distributed.
Key Takeaways
- Bitcoin’s four-year cycle has historically aligned with halvings, but correlation does not mean the halving explains the entire cycle.
- The supply impact of each halving becomes progressively smaller relative to Bitcoin’s total market size and capital flows.
- Institutional and ETF demand can now absorb multiples of daily miner issuance, making the ETF calendar at least as relevant as the halving calendar.
- Global liquidity increasingly influences Bitcoin’s price alongside other risk assets, though the relationship operates with a lag of months rather than weeks.
- MVRV Z-Score measures valuation extremes relative to historical norms. Long-Term Holder Net Position Change measures whether conviction holders are accumulating or distributing. Neither indicator should be read in isolation.
- A future cycle without a major capitulation phase during a global liquidity contraction would require significant revision of the traditional four-year framework.
- Institutionalization may be extending cycle length and moderating peak-to-trough drawdowns, without eliminating the cycle structure itself.
Introduction
Every four years, Bitcoin halves. Then Bitcoin rises. Eventually the market corrects, and the cycle begins again. This framework became one of the most repeated ideas in crypto: chart after chart overlaying halving dates onto price history, the pattern repeating with enough regularity to feel like physics.
The pattern is real. I am not going to tell you it is a coincidence or that the halving is irrelevant. What I am going to argue is that the mechanism behind it is changing in ways that matter for how you should think about the next cycle, and the one after that.
The halving reduces supply. That reduction, historically, coincided with market cycles that produced new price highs. But “coincided with” is doing a lot of analytical work in that sentence. Bitcoin’s early cycles operated in a market where miner issuance was a substantial share of daily trading volume, where institutional capital did not participate, and where liquidity from global central banks had no transmission channel into crypto. None of those conditions apply today.
The question is not whether the four-year cycle exists. The question is whether the halving is still the engine, or whether the engine has shifted to something else entirely.
What Is the Bitcoin 4-Year Cycle?
Bitcoin’s block subsidy halves roughly every 210,000 blocks, approximately every four years given average block times. The cycle is not perfectly four years by calendar, but the halving schedule produces a roughly four-year rhythm that has, historically, correlated with meaningful price cycles.
The classic framework moves through recognizable phases. After a cycle peak and subsequent bear market, Bitcoin enters an accumulation phase: sentiment is weak, valuations are depressed relative to historical norms, and investors with conviction buy while retail participation is minimal. Price action is flat to modestly recovering. This phase typically precedes the next halving or runs concurrently with it.
As macroeconomic conditions improve and liquidity expands, Bitcoin enters an expansion phase. Prices rise, participation broadens, and the narrative around the upcoming or recent halving attracts media attention. Long-term holders who accumulated at lower prices begin to hold with greater conviction. Euphoria follows expansion: speculation accelerates, valuations stretch, leverage enters the system, and new participants who have never experienced a bear market begin purchasing at price levels that experienced investors recognize as historically stretched. Then distribution. Early and long-term holders begin realizing profits, not all at once, but in a pattern measurable in on-chain data. Finally, capitulation: leverage unwinds, prices fall sharply, and the cycle resets.
Each of these phases is recognizable in Bitcoin’s history from 2012 through 2022. The question is whether they remain the right framework for 2024 onward.
What Is the Bitcoin Halving Cycle?
Every halving reduces the rate at which new Bitcoin enters circulation. The April 2024 halving cut the block reward from 6.25 BTC to 3.125 BTC, reducing daily miner issuance from approximately 900 BTC to approximately 450 BTC, roughly $36 million per day at 2024 average prices.
The supply-shock thesis is logically coherent. When new supply is cut and demand stays constant or grows, price should increase. Every halving from 2012 through 2020 was followed by a significant price appreciation within 12 to 18 months. The April 2024 halving continued that pattern: Bitcoin set a new all-time high in October 2025, approximately 18 months after the halving date, squarely within the historical window. Source. Source 2.
But the relevant analytical question is not whether the halving was followed by a price increase. It is how much of that increase the halving actually caused, and how much would have happened anyway given the broader liquidity environment and the structural shift in who was buying Bitcoin.
Why the Halving Matters Less Than It Used To
Here is the arithmetic that changed the analysis for me. Post-2024 halving, miners produce approximately 450 BTC per day. At $80,000 per Bitcoin, that is roughly $36 million in daily new supply. ETF purchases can exceed the supply of newly mined Bitcoin, but cumulative purchases and daily issuance have different measurement periods. The dated comparison above captures demand since the ETF launches, not a full-year 2025 net-flow figure. Bitwise projects that ETF demand alone could absorb more than 100 percent of all new Bitcoin issuance in 2026. Source.
Holdings, cumulative net inflows and assets under management are distinct measures; one figure cannot stand in for all three. ETF demand and new issuance are key inputs to the cycle analysis, alongside global liquidity and long-term-holder behavior.
The implication is this: when a single category of institutional buyer can absorb multiple times the daily miner output on a sustained basis, the supply side of the halving equation becomes a secondary factor. The demand side (who is buying, how much, and under what macro conditions) becomes primary. The halving matters as a narrative and as a psychological catalyst, because it draws attention and shapes expectations. But it no longer represents the fundamental supply constraint it did when Bitcoin’s market capitalization was measured in single-digit billions and miner issuance was a meaningful fraction of daily trading volume.
Bitcoin Has Become a Global Liquidity Asset
The more important shift is what Bitcoin has synchronized with. In the 2013 and 2017 cycles, Bitcoin’s price had essentially no relationship with global monetary conditions. Central bank balance sheets expanding in Tokyo and Frankfurt did not influence whether Bitcoin rose or fell. Today that isolation no longer holds.
Bitcoin increasingly moves with global M2 (the aggregate of money supply across major economies) and with the broader liquidity cycle defined by Federal Reserve policy, central-bank balance-sheet expansion and contraction, and the availability of dollar funding globally. The relationship is not tight on a month-to-month basis. Research shows correlations strengthen substantially at six to twenty-four month horizons, which is precisely the timeframe at which halving effects have historically materialized.
This creates an analytical challenge that is worth naming directly. CF Benchmarks' March 2026 analysis reported that global M2 had risen more than 12 percent while Bitcoin had fallen roughly 12 percent over the prior twelve months. This is a trailing-period comparison, not a calendar-2025 result or a measure of Bitcoin's decline from its October peak. But the divergence followed a period in which Bitcoin had already substantially front-run global liquidity expansion during 2024 and early 2025. The M2 relationship does not mean Bitcoin rises in real time with money supply: it means that over multi-month horizons, the direction of global liquidity conditions sets the backdrop against which Bitcoin’s supply dynamics and narrative catalysts play out. Source.
Lower interest rates reduce the return available on cash and fixed income, ease financial conditions broadly, and increase risk appetite for assets like Bitcoin. Higher rates do the opposite, constraining the capital flows that bid for risk assets at any price. Central-bank balance-sheet expansion injects liquidity into the financial system. Contraction removes it. Bitcoin now lives inside this system rather than outside it. For the full mechanics of how M2 and money supply feed into asset prices, see What Is M2 Money Supply?.
The halving affects Bitcoin’s supply schedule. Liquidity determines how much capital is available to bid for that supply. When I see those two things working together (a post-halving supply reduction coinciding with global liquidity expansion), I expect a strong cycle. When they conflict (a halving narrative running against a tightening Fed), I expect the liquidity cycle to win.
The Institutionalization of the Bitcoin Cycle
Spot Bitcoin ETF approval in January 2024 was not merely a product launch. It was an infrastructure change that fundamentally altered who participates in Bitcoin price formation and on what cadence.
Before ETFs, Bitcoin’s cycle peaks were driven primarily by retail participation: a wave of new investors buying near highs, fueling the final leg of the euphoria phase, and then becoming the primary holders when the cycle turned. The selling that initiated bear markets came largely from early holders realizing profits into retail enthusiasm.
Institutional participation through ETFs changes both sides of that equation. The buying is more continuous and less sentiment-driven. Capital enters through recurring portfolio allocations, systematic rebalancing, and institutional mandate rather than through retail mania alone. But institutional portfolios also rebalance after large gains. They sell not because sentiment has turned but because a position has grown beyond its target allocation. This creates a more structured distribution pattern: multiple waves of selling rather than a single blowoff top, absorbed over a longer period rather than compressed into weeks.
This is exactly what the 2025 data showed. Glassnode recorded three distinct waves of long-term holder distribution in the 2024–2025 cycle: the first following ETF launch in early 2024, the second around Bitcoin’s push above $100,000 after the U.S. election in late 2024, and the third approaching the October 2025 peak. Each wave was absorbed by the market, extending the cycle beyond what classical models predicted. The cycle did not peak and crash in a single dramatic blowoff. It distributed over twelve months.
The likely consequences of deepening institutional participation over future cycles are longer consolidation periods, less explosive peak-to-trough moves, and volatility that looks increasingly like a mature macro asset rather than a speculative internet token, though that transition is far from complete. For context on how interest rate environments affect this participation, see How Do Interest Rates Affect the Stock Market?
Where Are We in the Current Bitcoin Cycle?
As of August 2026
Bitcoin reached a new all-time high in October 2025, approximately 18 months after the April 2024 halving, consistent with the historical pattern of cycle peaks arriving 12 to 18 months post-halving. The subsequent correction is a reminder that a post-halving high does not eliminate downside risk. Source. Source 2.
The MVRV Z-Score measures the gap between market capitalization and realized capitalization relative to the standard deviation of market capitalization. Lower readings can indicate less valuation stretch, but neither MVRV nor its Z-Score establishes that a market bottom has formed. Source.
Long-term-holder data offers a separate view of Bitcoin's supply dynamics. Glassnode's July 1, 2026 report described Long-Term Holder Net Position Change returning to positive territory after distribution, alongside continued ETF outflows. That improvement was not confirmation of a completed market bottom. The metric reflects changes in cohort supply, including coins aging into the cohort, rather than direct exchange purchases alone. Source. Source 2.
The current environment does not look like a blowoff top followed by immediate cycle reset. It looks more like the extended distribution-to-re-accumulation transition that a more institutionally-mature cycle would produce: a correction that has removed speculative excess without triggering the kind of forced-liquidation capitulation that 2018 and 2022 exhibited. Whether a deeper drawdown follows depends primarily on how global liquidity conditions evolve and whether institutional demand maintains its structural bid.
The Two Indicators Era Watches Most Closely
MVRV Z-Score
The MVRV (Market Value to Realized Value) ratio compares Bitcoin’s total market capitalization with its realized capitalization, which approximates the value of all Bitcoin based on the price at which each coin last moved on-chain. When the market value significantly exceeds realized value, it indicates the average Bitcoin holder is sitting on substantial unrealized profit, a condition historically associated with cycle peaks and heavy distribution. When market value falls toward or below realized value, it indicates most holders are near or below their cost basis, a condition associated with capitulation and eventual accumulation.
The MVRV Z-Score divides the difference between market capitalization and realized capitalization by the standard deviation of market capitalization. It is not simply the MVRV ratio divided by that ratio's standard deviation. Glassnode describes historically high values as associated with market tops and low or negative values with market-bottom conditions. This is an interpretive historical relationship, not a fixed threshold that guarantees a turning point. Source.
I do not use MVRV as a mechanical buy or sell signal. No single on-chain metric should be used that way. What it does is tell me, with reasonable historical backing, whether valuation is historically stretched or historically compressed, and at what phase of that spectrum the current moment sits.
Long-Term Holder Net Position Change
Glassnode's entity-adjusted classification uses an entity's average acquisition date, with a logistic transition centered at 155 days rather than a perfectly sharp age boundary. This is not a fixed group: coins age into the LTH category and are removed from it when they are spent. What the LTH net position change tracks is whether that cohort is growing (accumulation) or shrinking (distribution) over rolling time periods. Source.
Long-term holders are defined by coin age, not by independently measured investment skill. Their supply behavior can inform cycle analysis, but age alone does not establish that they are the most informed investors. They accumulated at lower prices over previous cycles and are typically the primary sellers during advanced bull phases, distributing coins into demand generated by later participants. Their behavior is therefore one of the cleanest available signals for distinguishing between the early-to-mid phase of a bull market, where LTH supply grows as holders add to positions, and the mature-to-terminal phase, where LTH supply declines as they realize profits at historically elevated prices. Source.
Era Analyst’s Perspective
The 2024–2025 cycle gave us something the four-year framework had not fully produced before: an institutionally-structured distribution. Instead of one parabolic peak followed by a collapse, we got three measurable LTH distribution waves over twelve months, each of which was absorbed by persistent ETF and institutional demand before the next wave began. That structure is qualitatively different from 2017 and 2021.
What I take from that is not that the cycle is broken. It is that the mechanism is evolving in the direction I expected when ETF approval happened. Retail-driven blowoff tops produce dramatic, compressed distributions. Institution-driven demand absorption produces extended, layered distributions that look less dramatic in real time and more significant in retrospect.
The metric combination I now rely on most is MVRV Z-Score plus LTH Net Position Change plus the macro liquidity backdrop. I use valuation and long-term-holder supply behavior together rather than treating either as a standalone signal. The shift toward accumulation described in Glassnode's July 2026 report is constructive, but does not prove that distribution has ended or that a durable bottom has formed. My cycle interpretation remains conditional on liquidity and demand. Source.
The one thing that would force a fundamental revision of this framework is a Bitcoin cycle that moves through tight global liquidity and a meaningful U.S. recession without producing a drawdown above 50 percent from the all-time high. That has not happened yet. If it does, the four-year cycle thesis would need major structural revision. Until then, I am working with a modified version of the classical model, not a replacement.
Why Era Uses MVRV and Long-Term Holder Data Together
One indicator used alone can mislead significantly. The combination is more useful precisely because the two metrics can diverge, and those divergences are analytically interesting.
When MVRV is elevated and long-term holders are still accumulating, the market may be expensive by historical standards but the supply remains tightly held. Bitcoin can stay at stretched valuations longer than any model predicts when the holders with the most coins are not selling. When MVRV is elevated and long-term holders are distributing aggressively (the setup that existed approaching Bitcoin’s October 2025 peak), the evidence for a late-cycle distribution phase becomes substantially more credible. When MVRV is depressed and long-term holders are accumulating (the setup that now appears to be developing in mid-2026), the historical base rate for meaningful forward returns improves materially.
The terminal distribution phase becomes most credible when valuation reaches historically stretched levels while long-term holders simultaneously transition from accumulation to sustained, aggressive profit-taking. That combination appeared in late 2024 and through 2025. The current combination (moderate valuation, returning accumulation) reads more like an early recovery environment than a terminal one.
What Could Break the Bitcoin 4-Year Cycle?
I want to be explicit about falsification, because most crypto analysis never states what would prove its thesis wrong. That absence of falsification is one of the things that separates analysis from storytelling.
Condition 1: No Major Capitulation During a Global Liquidity Contraction
If Bitcoin moves through a period of genuinely tight global liquidity (a meaningful U.S. recession, restrictive monetary conditions sustained for more than twelve months, elevated real yields across major economies) without experiencing a drawdown of 50 to 60 percent or more from an all-time high, the classical four-year cycle model would require fundamental revision. Prior cycles produced peak-to-trough declines of 83 percent in 2018, 77 percent in 2022, and 93 percent in 2014–2015. Those were not noise. They were the mechanism by which leverage was cleared from the system and undervalued coins transferred from weak to strong hands.
If institutional participation is now deep enough that a genuine recession cannot produce that kind of forced capitulation, then the model has changed structurally, not just parametrically.
Condition 2: Bitcoin Develops Gold-Like Volatility
The second falsification condition is behavioral rather than cyclical. If Bitcoin develops sustained 90-day realized volatility comparable to gold (below approximately 15 to 20 percent) across both tightening and easing macro cycles, it will have crossed from a high-beta risk asset into a structurally distinct category. At that point, the boom-and-bust cycle model no longer applies, and Bitcoin’s price behavior would need to be understood through the same framework we apply to monetary assets like gold, not speculative assets like growth technology stocks.
Bitcoin’s 90-day realized volatility currently remains well above that threshold. The transition, if it occurs, will not be announced; it will be observable in rolling volatility data over several years.
Is Bitcoin Becoming Digital Gold?
The narrative is compelling and the surface-level similarities are real. Both Bitcoin and gold have supply constraints: gold through physical scarcity of extraction, Bitcoin through its protocol-defined 21 million cap. Neither produces cash flows. Both attract investors looking for monetary assets outside the traditional fiat system. Institutional ownership of both has grown materially over the past decade.
The differences are equally important. Bitcoin remains substantially more volatile than gold. Its 90-day realized volatility has historically run three to five times higher. Its market structure is younger, with leverage channels in the form of perpetual futures and options markets that can amplify both upside and downside in ways that do not exist in the gold market in equivalent form. Regulatory uncertainty remains a meaningful risk across most major jurisdictions in ways that gold has not faced for decades. And Bitcoin’s correlation with equity indices, particularly the Nasdaq, has been significantly higher than gold’s correlation, which tends to be low or negative during equity stress.
The real test of whether Bitcoin is becoming digital gold is not narrative. It is behavioral: does Bitcoin maintain store-of-value properties across a complete macro cycle that includes both tightening and easing, recession and recovery, without the leveraged capitulation phases that have defined every prior Bitcoin cycle? We have not yet observed a complete cycle under current institutional ownership conditions. The answer requires patience, not extrapolation from the most recent phase.
Bitcoin Cycle vs. Crypto Market Cycle
Bitcoin still anchors the wider crypto market, but the transmission mechanism has changed. The classic chain ran from Bitcoin appreciation to large-cap altcoins to small-cap speculation to extreme risk-taking in DeFi, NFTs, and new token launches. The idea was that Bitcoin liquidity expanded the entire crypto ecosystem, lifting all assets.
Institutionalization partially breaks that chain. ETF flows concentrate demand specifically in Bitcoin, which now holds SEC-approved spot products, institutional-grade custody, and regulatory clarity that most altcoins lack. Capital entering through ETFs does not automatically flow into Ethereum, Solana, or smaller tokens; it stays in the product it entered through. The result is that a Bitcoin bull cycle no longer guarantees an equivalently strong broad crypto cycle. Bitcoin dominance (its share of total crypto market capitalization) has remained elevated through this cycle in ways that previous cycles did not sustain.
Altcoin markets still respond to Bitcoin trends, but the relationship is more conditional and less automatic than it appeared in 2017 or 2020. For on-chain research into specific crypto projects and how they behave across cycle conditions, see Crypto Research & Blockchain Analysis. For current market sentiment across the asset class, see Crypto Market Analysis.
Common Bitcoin Cycle Mistakes
The mistake I see most consistently is treating the halving as a sufficient explanation rather than a contributing factor. The halving changes supply. It does not guarantee demand. In a risk-off macro environment with tightening liquidity, a halving can occur and the price can still fall, or simply not respond in the expected time window.
The second mistake is treating historical timing as fixed. Each cycle occurs in a different capital market environment. The 2017 cycle ran against minimal institutional participation and no ETF products. The 2021 cycle ran against unprecedented pandemic-era monetary expansion. The current cycle runs against the first genuinely institutional market structure in Bitcoin’s history. Expecting the same calendar timing to produce the same magnitude of moves is applying a template to a changed situation.
The third mistake is the opposite of the first: “this time is different” reasoning that dismisses the cycle entirely because Bitcoin is now a mainstream asset. Institutionalization may change the cycle without eliminating it. Gravity changes the arc of a thrown object; it does not stop being gravity. Global liquidity cycles, long-term holder behavior, and leverage dynamics remain real constraints on Bitcoin’s price no matter how many institutional custodians hold the coins.
The fourth is using a single on-chain indicator as a mechanical trading signal. No one metric (not MVRV, not LTH net position change, not exchange balances, not funding rates) is sufficient on its own. These metrics describe conditions. They do not determine outcomes. They should inform judgment, not replace it.
Three Possible Futures for the Bitcoin Cycle
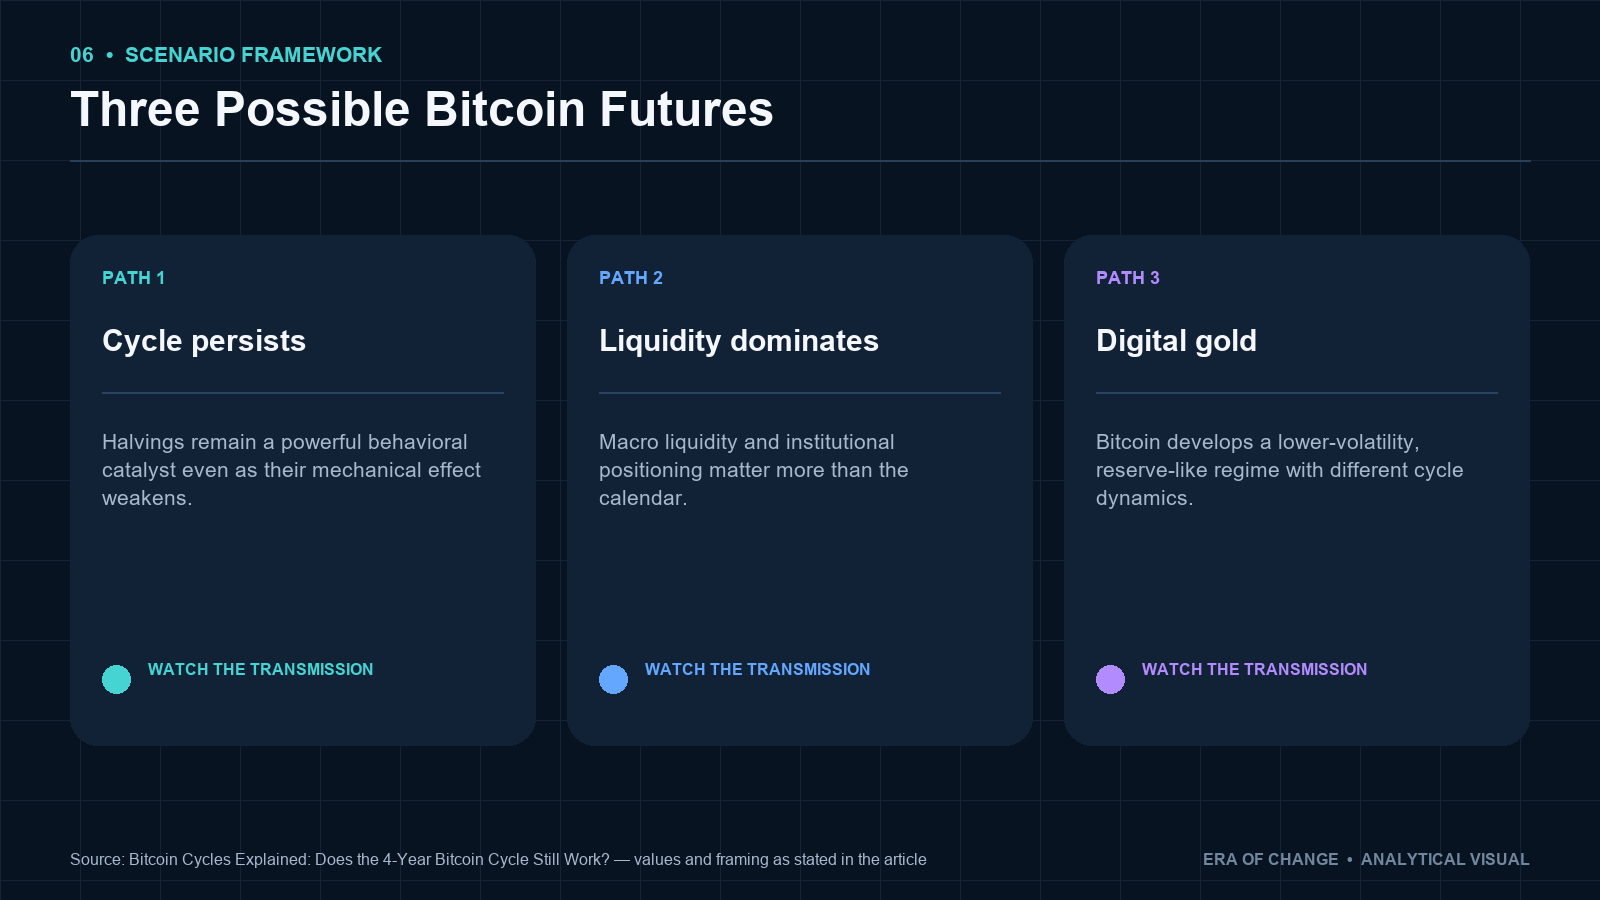
Scenario 1: The Four-Year Cycle Survives in Recognizable Form. Halvings continue to produce supply shocks that coincide with liquidity-expansion phases, generating major bull runs every four years. Long-term holders distribute into each peak. Capitulation phases clear excess leverage. The cycle timing stretches modestly as institutional participation deepens, but the basic structure, accumulation, expansion, euphoria, distribution, capitulation, remains intact. This is the continuity case, and the most recent cycle’s behavior is at least partially consistent with it.
Scenario 2: The Cycle Lengthens and Shallows. This appears closest to the structural trajectory Nikolai sees developing. ETF demand smooths supply shocks by absorbing miner selling more continuously. Bull phases extend because institutional allocation is more gradual than retail mania. Distribution takes longer and happens in multiple waves rather than a single blowoff. Bear market drawdowns become less severe as institutional buyers view corrections as allocation opportunities rather than existential events. The cycle does not disappear; it lengthens, becoming a six to eight-year structure rather than four. Halvings remain relevant as narrative catalysts but not as the primary timing mechanism. For scenario analysis on how macro conditions feed into this framework, see Scenario Planning for Investors.
Scenario 3: Bitcoin Becomes a Mature Macro Asset. Institutional ownership deepens to the point where leverage-driven boom-bust cycles are dampened toward the volatility profile of gold or commodity indices. Halvings have little observable direct price impact. Bitcoin responds primarily to real yields, global liquidity, currency confidence, and asset allocation decisions by large institutions. The four-year framework becomes analytically obsolete. This scenario requires falsification conditions not yet met: Bitcoin has not yet demonstrated sustained gold-like volatility across a full macro cycle. But the direction of travel, if institutional adoption continues at its current pace, is toward this scenario over a decade-long horizon.
Frequently Asked Questions
What is the Bitcoin 4-year cycle?
The Bitcoin four-year cycle refers to the historical pattern in which Bitcoin’s price has moved through multi-year expansion and contraction phases approximately aligned with its halving schedule. Each halving, occurring roughly every four years as the block reward cuts in half, has historically been followed by a major price appreciation over the subsequent 12 to 18 months and then a significant correction. The four-year rhythm reflects the halving interval of approximately 210,000 blocks.
Why does Bitcoin have a four-year cycle?
The most direct cause is the halving: every four years, new Bitcoin supply is cut in half, which has historically attracted attention and demand while reducing miner selling pressure. The deeper cause involves the interplay between that supply shock, the macro liquidity cycle, and the behavior of long-term holders who accumulate through bear markets and distribute during bull phases. All three factors tend to peak at similar points in the cycle.
What is the Bitcoin halving cycle?
The Bitcoin halving cycle refers specifically to the four-year schedule on which Bitcoin’s block reward is reduced by 50 percent. The most recent halving was in April 2024, cutting the reward from 6.25 BTC to 3.125 BTC per block and reducing daily miner issuance from approximately 900 BTC to approximately 450 BTC. Prior halvings were in 2012, 2016, and 2020.
Does Bitcoin always rise after a halving?
Historically, every halving has been followed by a significant price appreciation within 12 to 18 months, including the April 2024 halving, which preceded a new all-time high in October 2025. However, the halving does not guarantee demand. If global liquidity conditions are restrictive or if institutional flows are outweighed by large-scale selling, post-halving appreciation may be delayed, muted, or not materialize in the expected form. The halving changes supply; it cannot by itself create demand. Source. Source 2.
Is the Bitcoin four-year cycle still valid?
The cycle structure remains observable, but the mechanism has evolved. The halving-driven supply shock is less influential now relative to institutional and ETF capital flows, which can absorb multiples of daily miner output. The four-year calendar timing remains approximately relevant, but the amplitude and duration of each phase is increasingly determined by global liquidity conditions and institutional behavior rather than the halving alone.
What drives Bitcoin cycles today?
In Era’s framework, the primary drivers in order of current importance are: global liquidity conditions (Global M2 and central-bank policy), institutional flows through ETFs and large-scale allocations, long-term holder accumulation and distribution behavior, the leverage and derivatives market structure, and the halving supply schedule. Bitcoin has synchronized with the broader macro liquidity cycle to a degree that did not exist in prior cycles.
How does global liquidity affect Bitcoin?
When global money supply is expanding and interest rates are low, financial conditions are loose, risk appetite is elevated, and capital flows into scarce assets like Bitcoin. When liquidity contracts and rates rise, financial conditions tighten, risk appetite falls, and Bitcoin typically faces selling pressure from assets that need to be liquidated to meet margin or redemption demands. The relationship is stronger over 6 to 24-month horizons than on a week-to-week basis.
What is the MVRV Z-Score?
MVRV stands for Market Value to Realized Value. It compares Bitcoin’s total market capitalization with its realized capitalization, an estimate of the total value of all Bitcoin based on the price at which each coin last moved. The Z-Score normalizes this ratio against its historical volatility, making it comparable across different market sizes. High Z-Score readings have historically coincided with cycle peaks and heavy distribution. Low or negative readings have coincided with capitulation and accumulation environments.
What are Bitcoin long-term holders?
Glassnode's long-term-holder classification is centered around an average acquisition age of 155 days. It is a supply-cohort definition, not a test of investment skill or proof that every member bought at a lower price. Their net position change, whether LTH supply is growing through accumulation or shrinking through distribution, is one of the most reliable indicators of which phase the cycle is in. Source.
How can you tell when a Bitcoin cycle is near its peak?
No single indicator provides a reliable mechanical signal. Era monitors the combination of MVRV Z-Score and Long-Term Holder Net Position Change together with the macro liquidity backdrop. A cycle is most likely in a late or terminal distribution phase when MVRV valuation reaches historically stretched territory while long-term holders simultaneously transition from accumulation to sustained, aggressive profit-taking, the configuration that emerged in late 2024 through October 2025.
Are Bitcoin cycles becoming longer?
The evidence is consistent with cycle lengths extending as institutional participation deepens. The 2024–2025 cycle showed a more extended, multi-wave distribution phase than previous cycles, absorbed over approximately twelve months rather than compressed into a few weeks of blowoff selling. If ETF demand continues to smooth supply dynamics and institutional rebalancing continues to create structured rather than panic-driven selling, future cycles may run on a six to eight-year cadence rather than the traditional four.
Could institutional adoption end Bitcoin’s boom-and-bust cycles?
Institutional adoption could reduce the amplitude and frequency of extreme boom-bust behavior without eliminating cyclical price dynamics entirely. As long as global liquidity cycles, leverage dynamics, and long-term holder distribution create periodic supply and demand imbalances, some form of cyclicality is likely to persist. The falsification condition for a complete end to cycles is Bitcoin developing sustained gold-like volatility of below 15 to 20 percent across multiple tightening and easing macro cycles. That condition has not yet been met.
About E.R.A. OF CHANGES
E.R.A. OF CHANGES is an independent macroeconomic research and geopolitical intelligence firm providing institutional-quality analysis to investors worldwide. Our research combines macroeconomics, financial markets, blockchain analytics, and geopolitical risk into proprietary forecasting frameworks designed to identify structural market trends before they become consensus. The Era Global Risk Index, updated daily from 24 structural indicators, serves as the foundation of our analytical methodology, providing a forward-looking measure of systemic financial stress grounded in structural economic evidence rather than market sentiment. Our full methodology, live index reading, and forecast archive are available at eraperemen.info/en.
The content published by E.R.A. OF CHANGES is for informational and educational purposes only and does not constitute financial, investment, legal, or tax advice. All views expressed are the personal analytical perspective of the author. Past forecast accuracy does not guarantee future results. Readers should conduct their own research and consult a qualified financial professional before making any investment decisions.
Sources
- Glassnode: BTC Long-Term Holder Net Position Change
- Glassnode: BTC Long-Term Holder Supply
- Glassnode: Bitcoin MVRV Z-Score Methodology
- CoinDesk: Bitcoin Long-Term Holders Return to Accumulation, July 2026
- CoinDesk: Bitcoin LTH Supply Hits 8-Month Low, December 2025
- The Block: Spot Bitcoin ETF Total Net Flow
- AhaSignals: Current Bitcoin MVRV Z-Score
- CoinGecko Research: When Bitcoin All-Time Highs
- CF Benchmarks: The M2–Bitcoin Relationship: What the Data Actually Shows
- Federal Reserve: FRED: M2 Money Stock
- Era Global Risk Index
- Era CrisisMeter Explained
- Era Forecasting Methodology
- What Is M2 Money Supply?
- How Do Interest Rates Affect the Stock Market?
- Scenario Planning for Investors
- Crypto Research & Blockchain Analysis
- Crypto Market Analysis



