Executive Summary
Interest-rate hikes affect financial markets by raising borrowing costs, reducing liquidity, changing how future earnings get valued today, and slowing credit creation across the economy. But stocks don't all respond equally, and that's the part most explanations skip. Long-duration growth companies are sensitive to the discount rate applied to their future cash flows, while small companies, commercial real estate, and private credit are far more exposed to the actual cost of refinancing debt as it comes due.
The full effect of higher rates typically shows up with a real delay, because companies and property owners keep operating on older, cheaper financing until it matures. Era estimates commercial real estate and private credit specifically can carry an 18-to-24-month lag before refinancing pressure becomes visible in the data. Traditional models have also gotten less reliable lately, because large fiscal deficits and continued government spending keep adding liquidity to the system even while the central bank is nominally tightening.
For investors, the question that actually matters isn't simply whether rates are rising. It's whether real rates stay above the economy's neutral level long enough to damage earnings, credit availability, and refinancing capacity and for how long.
Key Takeaways
- Higher interest rates reduce the present value of future corporate earnings, hitting long-duration growth stocks hardest.
- Rate hikes affect credit-dependent sectors far more than cash-rich, self-funding businesses.
- Fiscal spending can partially offset monetary tightening, muting the expected market effect.
- Commercial real estate and private credit typically react with an 18-to-24-month lag tied to refinancing cycles.
- Small-cap companies are especially vulnerable because a large share rely on floating-rate or short-maturity debt.
- Rate cuts are not automatically bullish if they arrive after credit markets have already started breaking.
- Investors should track real rates, refinancing schedules, and credit spreads, not the policy rate in isolation.
Introduction
Investors are told constantly that higher interest rates are bad for stocks and lower rates are good for them. It's a useful shorthand, and it's also incomplete enough to actively mislead people who take it too literally.
Markets can rise through an entire tightening cycle for reasons that have nothing to do with rates being low: strong earnings that outrun the higher discount rate, fiscal stimulus offsetting monetary tightening, genuine excess liquidity still sloshing through the system, concentrated leadership in a handful of names that aren't especially rate-sensitive, market expectations of future cuts pulling valuations forward, and simply delayed refinancing pressure that hasn't hit yet. So the real question this piece is built around: how do interest-rate hikes actually move through financial markets, and where does the damage tend to show up first?
What Is an Interest-Rate Hike?
An interest-rate hike is an increase in a central bank's policy rate, the fed funds target range in the U.S., or the equivalent short-term rate at other central banks, which represents the cost at which banks lend to each other overnight and functions as the anchor for the broader cost of money throughout the financial system.
Central banks raise rates to reduce inflation, slow demand that's running ahead of the economy's productive capacity, tighten broader financial conditions, restrain excessive credit growth, and in some cases to support the currency's credibility against capital flight. It's worth being precise about the mechanism: central banks directly control very short-term rates.
Longer-term borrowing costs (mortgage rates, corporate bond yields, the rates that actually matter to most real-economy decisions) are set by market forces that respond to policy but aren't dictated by it directly.
How Interest-Rate Hikes Move Through the Economy
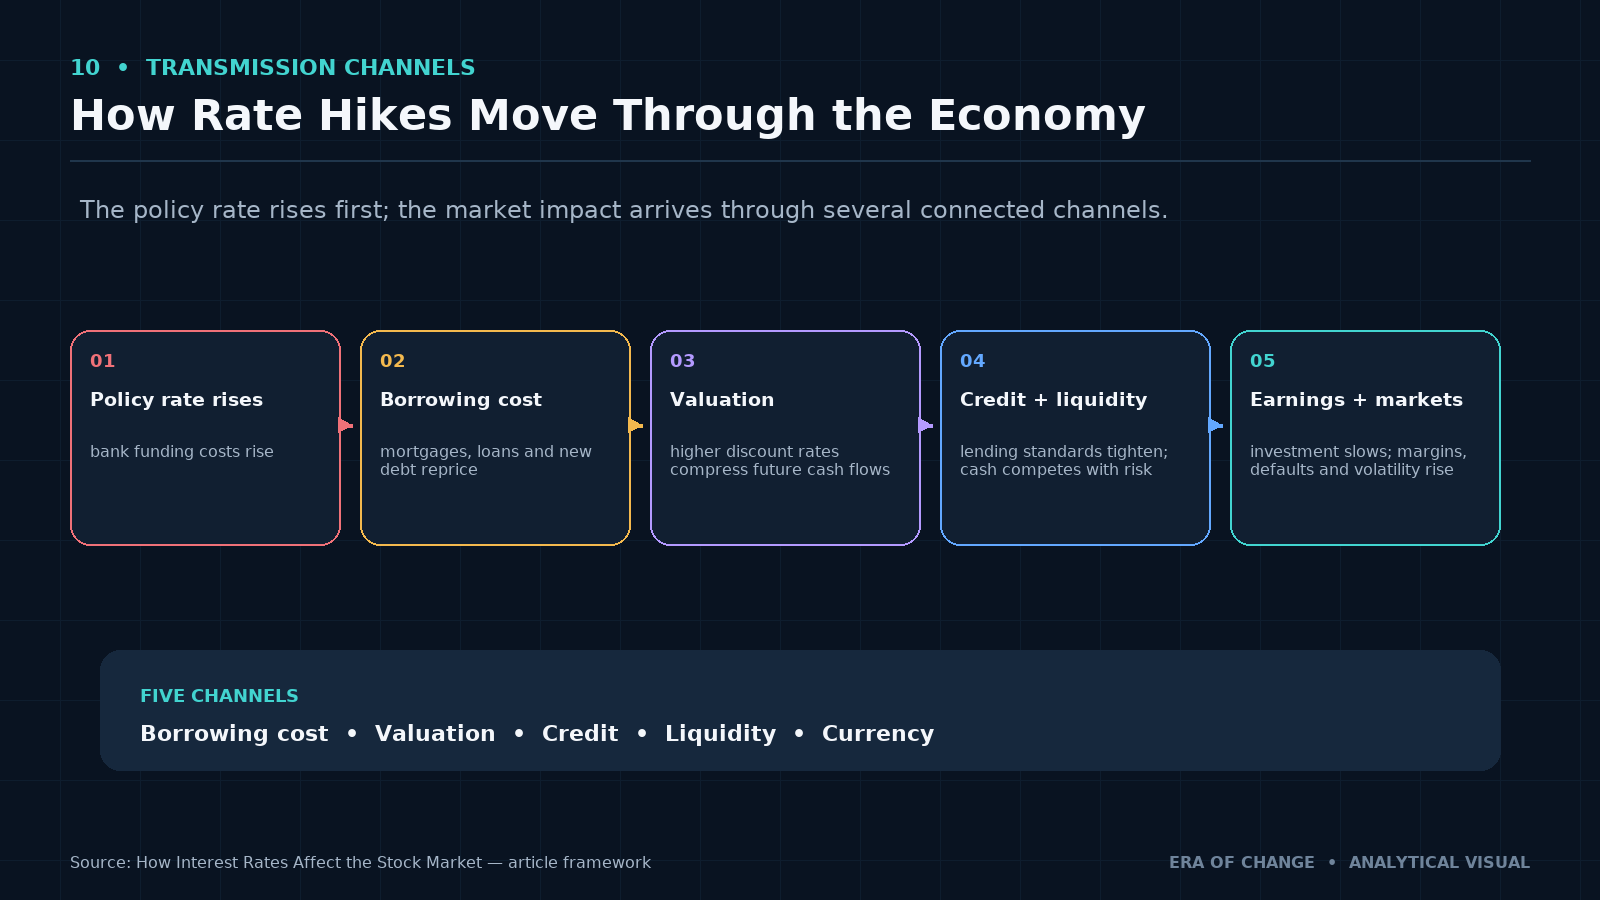
The basic sequence runs: the policy rate rises, bank funding costs rise in response, loans become more expensive throughout the system, borrowing and investment slow as a result, corporate earnings weaken, and defaults may eventually increase among the most exposed borrowers.
That transmission runs through five distinct channels. The borrowing-cost channel raises the price of mortgages, corporate loans, credit cards, floating-rate debt, and any new bond issuance directly. The valuation channel works through discounting: higher rates reduce the present value of future cash flows, mechanically compressing what those cash flows are worth today. The credit channel operates through banks specifically, lending standards can tighten even beyond what the official rate increase alone would suggest, as banks reprice their own risk appetite. The liquidity channel makes cash and short-term government bonds genuinely competitive with risk assets for the first time in years, pulling capital away from equities and credit. And the currency channel can attract capital and strengthen the domestic currency, which affects exporters and any borrower with dollar-denominated debt simultaneously.
How Do Interest Rates Affect the Stock Market?
Higher discount rates reduce valuations. In a discounted cash flow framework, a company's value is the sum of its future earnings, discounted back to today's dollars and the higher the discount rate, the less those future earnings are worth right now. Companies whose earnings are expected mostly years out into the future are structurally more sensitive to this than companies generating most of their value from cash flow already arriving today.
Corporate interest expense rises. Businesses refinancing existing debt face higher coupons on the new debt, which compresses profit margins directly, reduces the capital available for new investment, slows hiring, and raises default risk at the margin, all from the same underlying mechanism.
Consumers spend less. Higher mortgage rates, auto-loan costs, and credit-card rates all reduce the discretionary income households have left over, which shows up eventually in corporate revenue for anything consumer-facing.
Bonds become more competitive. When safer assets (Treasuries, investment-grade credit) offer meaningfully higher yields, investors rationally demand higher expected returns from stocks to compensate for taking on equity risk instead, which compresses the multiple the market is willing to pay.
Market volatility increases. Genuine uncertainty grows around earnings trajectories, the future path of policy, where inflation actually settles, recession probability, and what multiple the market should even be applying and that uncertainty itself shows up as wider price swings independent of any single data point.
Why Higher Rates Do Not Affect Every Stock Equally
Growth and Technology Stocks
These are sensitive to long-duration cash flows, valuation multiples built on years of future growth, and the underlying cost of capital generally. But it's worth distinguishing within the category: profitable mega-cap technology companies sitting on enormous cash balances can prove considerably more resilient than smaller, unprofitable technology firms that actually need external capital to keep operating.
Small-Cap Companies
This is where I think the real vulnerability in the current cycle sits, and it's already showing up in the data rather than staying theoretical. Small companies rely far more heavily on bank lending, carry a much larger share of floating-rate debt, operate with shorter debt maturities that force more frequent refinancing, run on thinner margins with less room to absorb a cost shock, and have meaningfully less access to public capital markets as an alternative funding source when bank credit tightens.
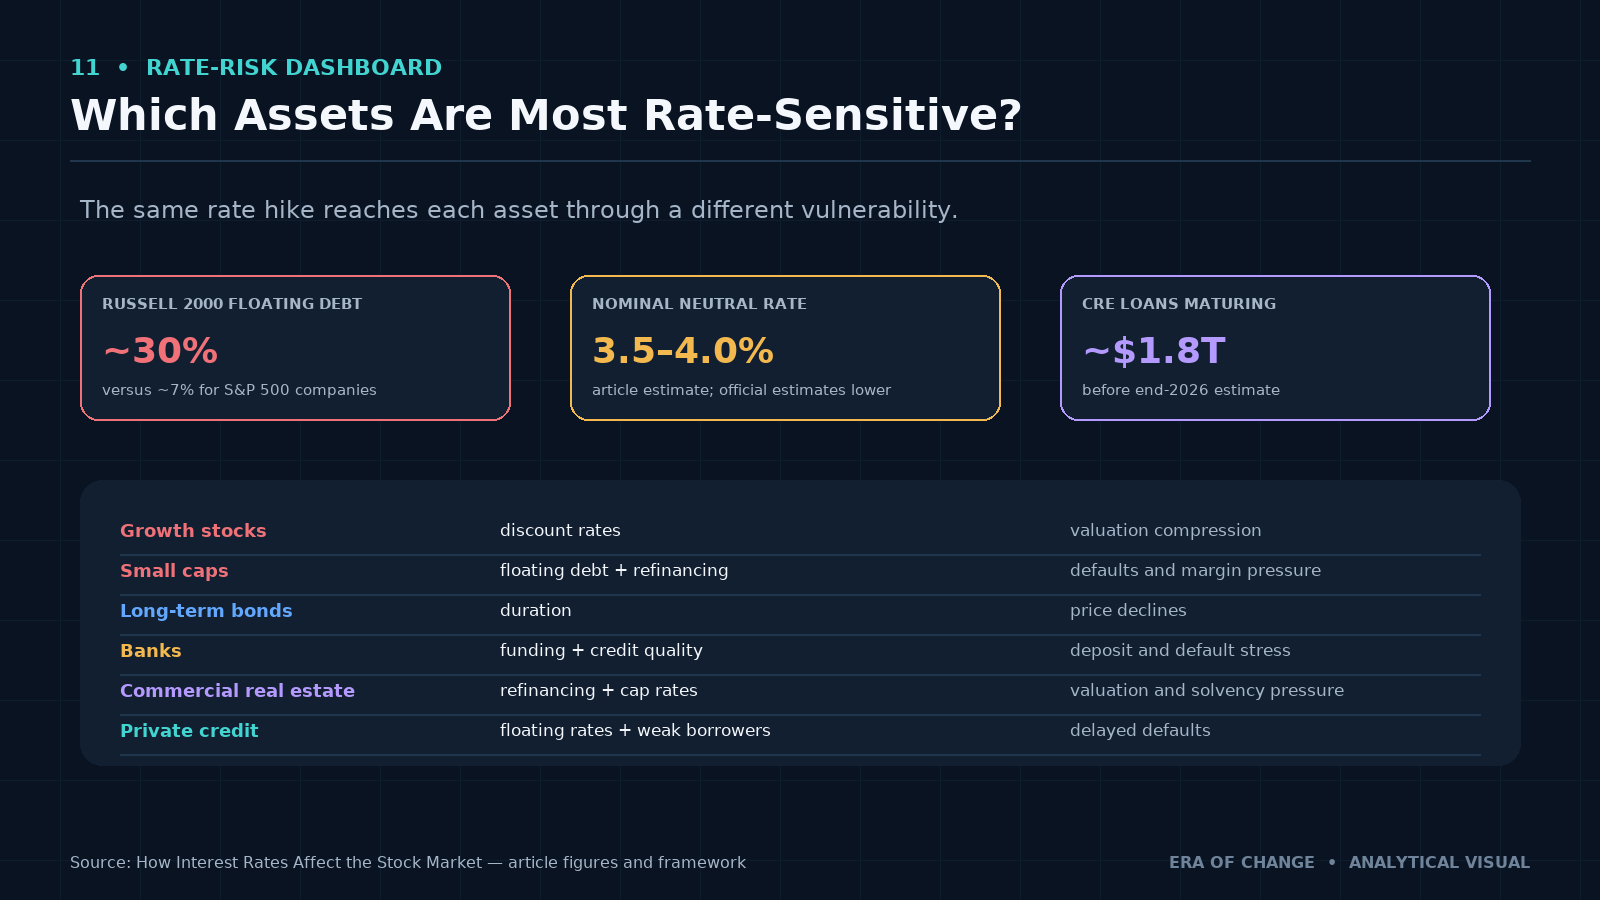
Roughly 30% of debt held by Russell 2000 companies is tied to floating interest rates, compared with about 7% for S&P 500 companies, a structural gap of roughly four times the exposure. This isn't an abstract risk. In March 2026, the Russell 2000 erased its yearly gains as floating-rate debt costs and a yield spike hit small-cap borrowers directly, and by July 2026, small-cap borrowing costs had climbed to a six-year high. The Russell 2000 functions as the cleanest broad indicator of exactly this kind of stress, precisely because of its debt composition relative to the large-cap index most investors default to watching.
Banks
Banks can benefit from wider lending margins as rates rise, but they also face real risks on the other side of the balance sheet: deposit outflows toward higher-yielding alternatives, unrealized losses on existing bond holdings purchased at lower rates, rising credit defaults among their borrowers, reduced loan demand generally, and genuine funding pressure if deposit competition intensifies.
Consumer Discretionary Companies
Higher borrowing costs directly reduce household purchasing power, which flows through to revenue for anything that depends on discretionary spending rather than necessities.
Utilities and Other Bond Proxies
High-dividend sectors that investors often hold as bond substitutes become structurally less attractive once government bonds themselves start offering competitive yields with none of the equity risk attached.
Energy and Commodity Producers
Performance here tends to depend more on commodity prices and inflation dynamics than on interest rates alone, a sector where the rate story is frequently secondary to the supply-and-demand story playing out underneath it.
The Neutral Interest Rate Explained
The neutral rate, often called r-star, is the interest rate that neither stimulates nor restricts economic activity when inflation is stable. It cannot be directly observed. It has to be estimated, and different credible methodologies produce genuinely different estimates.
The Fed's own June 2026 Summary of Economic Projections held its longer-run median rate at approximately 3.0% to 3.1%, a figure well above pre-pandemic norms already. The New York Fed's Holston-Laubach-Williams model estimated a real neutral rate of 0.84% as of Q2 2025, which combined with a 2% inflation target implies a nominal neutral rate a little below 3%.
My own view runs higher than both of those official estimates: I think the U.S. neutral rate now sits closer to 3.5% to 4.0%, not the roughly 2.5% level that was the conventional assumption for most of the 2010s. The reasons I'd point to: materially larger structural fiscal deficits than the pre-2020 era, deglobalization raising the underlying cost of capital and production, higher structural inflation pressure than the low-2010s regime, increased demand for capital generally as AI infrastructure and reshoring both compete for the same investment dollars, genuine supply constraints in several critical sectors, and government borrowing that keeps growing regardless of where rates sit. I want to be precise about what I'm discussing here specifically: I'm referring to the nominal neutral policy rate, not the real rate in isolation, which matters because conflating the two is exactly how this conversation gets confusing in most financial media coverage of it.
Why Real Interest Rates Matter More Than Nominal Rates
The real interest rate is approximately the nominal policy rate minus inflation. A nominal rate of 5% is still genuinely loose if inflation is running at 6%. A nominal rate of 4% can be meaningfully restrictive if inflation has actually fallen to 2%. The nominal number alone tells you almost nothing about whether policy is actually applying pressure to the economy.
My thesis, stated plainly: if the Federal Reserve keeps its real policy stance materially above the economy's neutral level for another full year, refinancing-dependent small companies face a real wave of defaults, not a hypothetical one, given what's already visible in Russell 2000 borrowing costs. Duration matters enormously here. A restrictive rate held for a few months is a fundamentally different experience for a leveraged borrower than the same restrictive rate maintained through multiple successive refinancing cycles, where each cycle resets debt at the new, higher cost rather than the old one.
What Broke in the Classical Rate-Hike Model?
Fiscal Dominance
Fiscal dominance describes a condition in which government debt and fiscal policy increasingly constrain, or directly offset, what monetary policy is trying to accomplish. My reading of the last several years: central banks raised rates aggressively, and governments simply kept running large deficits alongside them. Fiscal transfers and continued government spending kept liquidity flowing into the economy even as the central bank was actively trying to remove it. Monetary tightening and fiscal expansion were pulling in genuinely opposite directions at the same time, and fiscal policy, at the scale it's operating at, has real capacity to win that tug-of-war, at least temporarily. The message worth internalizing: higher policy rates do not guarantee tighter total financial conditions when government spending keeps supporting demand and liquidity on its own.
Why Markets Stayed Stronger Than Expected
Fiscal stimulus, pandemic-era household savings that took years to fully deplete, cheap debt locked in by both companies and households before rates rose, extreme concentration in a handful of technology names that were less rate-sensitive than the broader market, active government industrial policy directing capital toward specific sectors, and continued nominal spending growth across the economy all combined to keep markets more resilient through this tightening cycle than the classical model alone would have predicted.
Why the Effect May Be Delayed Rather Than Cancelled
This is the distinction I want to be most careful about: fiscal support can genuinely postpone the effects of tightening. It does not eliminate refinancing risk, rising interest expense, margin pressure, credit deterioration, or sovereign debt stress: all the things we cover in more depth in Global Debt Risks 2026. Delay is not the same thing as cancellation, and treating the two as equivalent is exactly how investors get caught off guard when the delayed effect finally arrives.
The Long Lag of Monetary Policy
Rate hikes don't hit the economy on the day they're announced, for a specific set of structural reasons: many mortgages are fixed-rate and simply don't reprice until sold or refinanced, companies typically only refinance when existing debt actually matures rather than proactively, commercial property loans roll over on their own multi-year schedules, consumer savings can cushion spending for a meaningful stretch before running out, banks tighten credit gradually rather than all at once, and many commercial contracts reset only periodically rather than continuously.
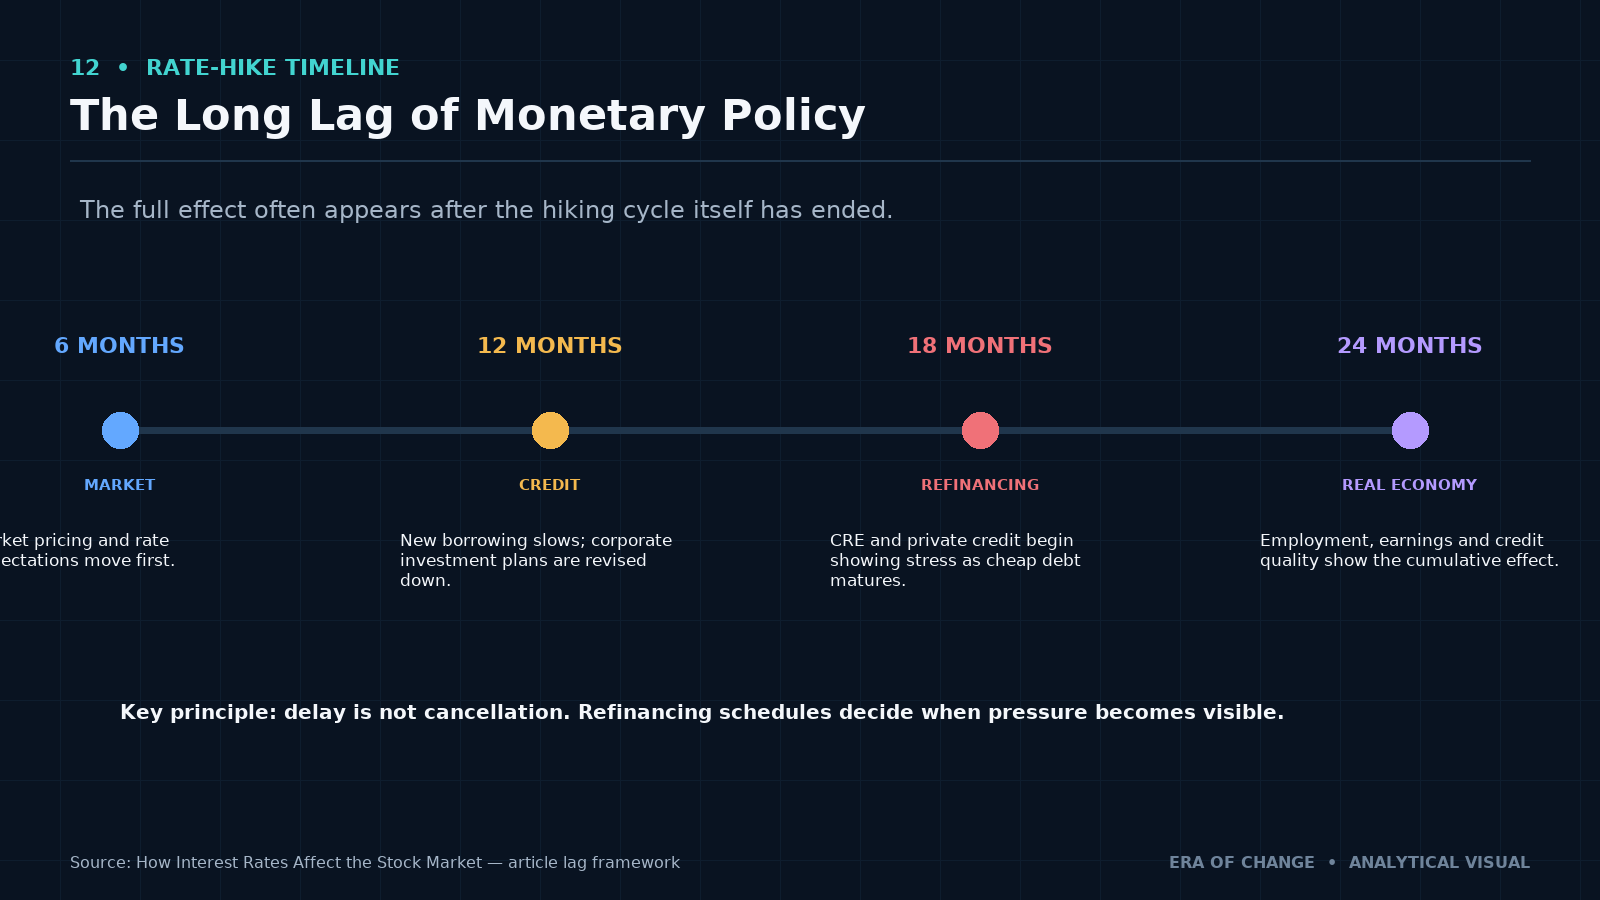
Mapped roughly by stage: at six months, market pricing and rate expectations move first, while the real economy has barely felt anything yet. At twelve months, new borrowing and new mortgage activity are clearly slower, and corporate investment plans start getting revised down.
At eighteen months, refinancing-dependent sectors, commercial real estate and private credit specifically, begin showing real stress as older, cheaper debt starts maturing into the new rate environment. At twenty-four months, the full cumulative effect on employment, corporate earnings, and credit quality is typically visible in the data, often well after the rate-hiking cycle itself has already ended.
Commercial Real Estate: The Delayed Pressure Point
Refinancing Cycles
Property owners frequently continue paying rates locked in years earlier until their existing loan actually matures, which means the pain doesn't arrive on a fixed schedule tied to the rate hikes themselves, but on the far more irregular schedule of when each individual loan happens to come due.
Falling Property Values
Higher capitalization rates, the rate investors use to value income-producing property, mechanically reduce valuations even when a property's actual rental income hasn't changed at all.
Lower Occupancy and Weak Demand
Office space specifically, and selected retail segments, face structural demand pressure layered directly on top of the higher-rate environment, compounding the refinancing problem rather than existing separately from it.
Bank Exposure
Regional and smaller banks disproportionately hold concentrated commercial-property loan books relative to their overall balance sheets, which makes CRE stress a genuine banking-sector transmission risk, not merely a real-estate-sector problem contained to that market alone.
The Refinancing Gap
A building can remain fully operational, with tenants paying rent as normal, and still become financially unviable the moment its debt resets at a materially higher rate: solvent in an operational sense, insolvent in a financing sense, which is precisely the liquidity-versus-solvency distinction that matters throughout debt analysis generally.
The scale here is real and already visible in the data. Trepp estimates nearly $1.8 trillion in commercial real estate loans mature before the end of 2026, while the Mortgage Bankers Association puts 2026-specific maturities at $875 billion, roughly 17% of the $5 trillion in commercial and multifamily mortgage debt currently outstanding, with S&P Global Market Intelligence projecting the wall actually peaks even higher, near $1.26 trillion, in 2027. The stress is already showing up directly: office CMBS delinquencies hit a record 12.34% in January 2026, and Trepp's own Spring 2026 review identified $76.6 billion in CMBS loans facing hard maturities this year alone with no clean refinancing path.
Private Credit: Hidden Rate Sensitivity
Private credit refers to loans extended directly by non-bank lenders (private funds, business development companies, specialty finance vehicles) outside the traditional banking system and public bond markets. The market has grown to roughly $1.96 trillion in 2026, with Morgan Stanley projecting it could reach $5 trillion by 2029 as institutional capital continues rotating toward the asset class.
Risk here can appear later than in public markets for structural reasons: less frequent price discovery than a publicly traded bond, floating-rate loan structures that reprice mechanically as rates rise, limited public transparency into the underlying borrowers, covenant modifications that can mask deteriorating credit quality, payment-in-kind interest that lets a borrower defer cash payments while debt quietly compounds, and valuation adjustments that lag the underlying reality by design rather than by accident.
The signals worth watching for genuine stress: rising loan non-accruals, increasing amend-and-extend activity as lenders avoid recognizing losses, growing use of covenant waivers, rising reliance on payment-in-kind interest structures, deteriorating borrower EBITDA, and fund-level redemption or liquidity pressure. The key insight I want to leave you with: private assets can appear stable specifically because they aren't repriced continuously in a public market, not because the underlying risk sitting inside them is actually low.
Which Asset Classes Are Most Sensitive to Rate Hikes?
| Asset Class | Main Rate Sensitivity | Typical Risk |
| Growth stocks | Discount rates | Valuation compression |
| Small caps | Refinancing and floating debt | Defaults and margin pressure |
| Long-term bonds | Duration | Price declines |
| Banks | Funding and credit quality | Deposit and default stress |
| Commercial real estate | Refinancing and cap rates | Valuation and solvency pressure |
| Private credit | Floating rates and weak borrowers | Delayed defaults |
| Gold | Real rates and currency confidence | Mixed response |
| U.S. dollar | Yield differentials and risk aversion | Appreciation or reversal |
| Crypto | Liquidity and risk appetite | High volatility |
How Rate Hikes Affect Bonds
Bond prices move inversely to yields by construction, and long-duration bonds carry far more price sensitivity to any given yield change than short-duration ones. New bonds issued after a rate hike offer genuinely higher income than older bonds issued before it, and credit spreads (the extra yield demanded over government bonds) can widen sharply during periods of real economic stress on top of the base-rate move itself.
Short-term government bonds carry less duration sensitivity and reprice quickly as rates move. Long-term government bonds carry meaningfully greater exposure to inflation expectations, the term premium investors demand for locking up capital longer, and as covered in Global Debt Risks 2026, genuine fiscal-credibility risk on top of the pure rate story. Corporate bonds are affected by both the government-yield backdrop and the issuer's own credit risk simultaneously.
High-yield bonds specifically are highly sensitive to default probability and refinancing conditions, which is exactly why high-yield spreads function as one of the cleanest real-time credit-stress indicators available.
How Rate Hikes Affect Currencies
Higher rates can support a currency by improving its relative yield versus other currencies, attracting capital inflows, and increasing overall confidence in the policy regime managing it. But a currency can weaken even as rates rise if markets start fearing recession, if sovereign debt dynamics become genuinely unstable (the exact mechanism covered in Currency Crises Explained) if inflation stays stubbornly high despite the higher rates, or if policy credibility itself declines. The currency reaction ultimately depends on relative policy across countries, not any single country's rate viewed in isolation.
How Rate Hikes Affect Gold and Commodities
Gold
The clearest negative force on gold from rate hikes: higher real yields raise the opportunity cost of holding an asset that produces no yield of its own. Working against that, several forces can dominate anyway: inflation uncertainty, sovereign risk, currency instability, and broader financial stress can all support gold even in a rising-real-rate environment, which is exactly why gold's relationship with rates is genuinely more complicated in practice than the textbook version suggests.
Oil and Commodities
Higher rates can weaken demand at the margin, but supply constraints or geopolitical shocks frequently dominate the price action regardless of where rates sit, a dynamic we cover in more depth from the inflation-transmission side in What Causes Inflation? and from the stagflation angle in What Is Stagflation?.
What Happens When Rate Hikes Finally Begin to Work?
The late-cycle sequence typically runs: credit growth slows, refinancing becomes genuinely more expensive across the board, the weakest borrowers start failing, hiring slows in response, unemployment begins rising, corporate earnings decline, inflation finally falls as demand destruction takes hold, and central banks begin considering easing. The insight worth holding onto: by the time inflation has visibly fallen, real financial damage may already be developing well beneath the surface: the lagging indicators confirming what the leading indicators, watched closely, had already been showing for months.
Are Rate Cuts Always Good for Markets?
Preventive cuts happen when inflation is genuinely easing and the broader economy remains fundamentally stable, a calibration move rather than a rescue. Crisis cuts happen because banks, credit markets, employment, or overall liquidity are actively deteriorating, and the cut is a response to that deterioration rather than a reward for good behavior.
Stocks can keep falling even after the first rate cut during a genuine crisis cycle, precisely because the cut itself confirms that conditions are worse than the market had priced, the same dynamic we cover in operational detail in How Central Banks Respond to Recessions. Don't evaluate a cut by its existence. Evaluate it by what actually triggered it.
A Practical Framework for Traders and Investors
When rates are rising, work through a specific set of questions in sequence: are real rates actually becoming more restrictive, or is inflation rising alongside the nominal rate and offsetting it? Is fiscal policy offsetting monetary policy, and by roughly how much? Which specific sectors in the portfolio face refinancing within the next 12 to 24 months? Are credit spreads actually widening, or holding steady despite the higher rate backdrop? Are bank lending standards tightening in the Fed's own Senior Loan Officer Opinion Survey? Is market leadership narrowing to a smaller and smaller group of names? Are consensus earnings estimates being revised down? Is the yield curve steepening after a period of inversion, a signal we cover in detail in Yield Curve Explained, and what does that steepening actually indicate given the broader context? And finally: are rate cuts being priced into markets because inflation is genuinely improving, or because something in the financial system is starting to break?
Indicators to Watch
For monetary policy: the federal funds rate itself, the real policy rate calculated against actual inflation, Fed forward guidance language, and changes in the Fed's balance sheet.
For credit conditions: high-yield spreads, bank lending standards from the Senior Loan Officer Opinion Survey, corporate refinancing volume, default rates, and private-credit non-accrual trends.
For equities: Russell 2000 performance relative to the S&P 500, market breadth, earnings revision trends, and the equity risk premium.
For real estate: commercial-property transaction volume, capitalization rates, delinquency rates, upcoming refinancing maturities, and bank exposure to commercial real estate specifically.
For liquidity generally: M2, repo rates, the SOFR-OIS spread, the cross-currency basis, and the Era CrisisMeter reading, which synthesizes all of the above into a single structural score.
Three Rate Scenarios
Soft-Landing Scenario. Inflation genuinely declines. Real rates normalize gradually rather than staying elevated. Credit markets remain functional throughout. Earnings growth broadens beyond the current handful of leaders. Likely implications: a broader equity rally, stable credit spreads, meaningfully improved small-cap performance, and a controlled, orderly bond rally.
Higher-for-Longer Scenario. Inflation remains sticky above target. The Fed keeps policy genuinely restrictive for an extended period. Fiscal deficits stay large regardless. Refinancing pressure continues building across CRE and private credit. Likely implications: a range-bound broad market, continued weak small-cap performance, ongoing CRE and private-credit stress, and persistent elevated volatility.
Credit-Break Scenario. Defaults accelerate meaningfully. Funding markets tighten sharply. Unemployment rises. The Fed cuts reactively rather than proactively. Likely implications: a genuine equity decline, a surge in credit spreads, a volatility spike, and sharply stronger demand for liquidity and defensive assets across the board.
Era Analyst's Perspective
From Nikolai Fainizkii, CEO & Senior Analyst, Era of Change
"The Fed's own June 2026 dot plot put the longer-run neutral rate at roughly 3.0% to 3.1%. I think that's too low, and I think the evidence for a higher neutral rate, closer to 3.5% to 4.0%, is already showing up in exactly the place you'd expect it to: small-cap borrowing costs.
Roughly 30% of Russell 2000 debt sits on floating rates, against about 7% for the S&P 500, and that index already erased its entire yearly gain in March 2026 when floating-rate costs and a yield spike hit small-cap balance sheets directly. By July, small-cap borrowing costs had climbed to a six-year high. That's not a forecast. That's already happened.
What most coverage of rate hikes still misses is fiscal dominance: the fact that government spending has been offsetting monetary tightening almost the entire way through this cycle, which is exactly why the broad market has stayed far more resilient than the classical model would have predicted. But fiscal spending doesn't erase refinancing risk. It just delays when that risk actually shows up, and I think 2026 and 2027 are the years the delayed bill comes due across commercial real estate and private credit specifically, nearly $1.8 trillion in CRE loans alone maturing before the end of this year, with office CMBS delinquencies already at a record 12.34%.
If the Fed holds a real policy stance meaningfully above neutral for another full year, I don't think this stays contained to small-caps. I think it becomes a genuine cascade through the refinancing-dependent parts of the economy that fiscal support simply cannot reach."
— Nikolai Fainizkii, CEO & Senior Analyst, Era of Change
Frequently Asked Questions
How do interest rates affect the stock market?
Higher interest rates raise the discount rate applied to future corporate earnings, which reduces present-day valuations, particularly for companies whose profits are expected mainly in future years. They also raise corporate borrowing costs, slow consumer spending, and make bonds more competitive with stocks for investor capital, all of which can compress equity valuations, though the effect varies significantly by sector and by how a company is financed.
Why do stocks fall when interest rates rise?
Stocks can fall because higher rates reduce the present value of future earnings through the discounting mechanism, increase the cost of corporate borrowing and refinancing, make government bonds more attractive relative to equity risk, and generally raise uncertainty around earnings, policy, and recession probability. However, stocks don't always fall during rate-hiking cycles: strong earnings, fiscal stimulus, and delayed refinancing pressure can offset the effect for extended periods.
Which stocks are most sensitive to interest-rate hikes?
Long-duration growth and technology stocks are highly sensitive through the valuation channel, while small-cap companies are especially exposed through refinancing and floating-rate debt. Banks, commercial real estate, and private credit also carry significant rate sensitivity, though banks can benefit from wider lending margins even as they face other risks like deposit outflows and credit losses.
How do rate hikes affect small-cap companies?
Small-cap companies rely more heavily on bank lending and floating-rate debt than large-cap companies, roughly 30% of Russell 2000 debt is floating-rate, compared to about 7% for the S&P 500. This structural difference means small caps feel the effect of rate hikes much faster and more severely, through rising debt-service costs and reduced access to affordable refinancing.
Why do higher rates hurt commercial real estate?
Higher rates raise capitalization rates, which mechanically reduce property valuations, while also raising the cost of refinancing maturing loans. Because CRE loans reset only when they mature rather than continuously, the pain arrives with a lag tied to each property's specific refinancing schedule, a lag Era estimates at roughly 18 to 24 months from the start of a hiking cycle to peak visible stress.
How long does it take for rate hikes to affect the economy?
Monetary policy operates with a meaningful lag because of fixed-rate mortgages, debt that only reprices at maturity, gradual bank credit tightening, and consumer savings buffers. Era's estimate is that the full effect typically unfolds over 18 to 24 months, with refinancing-dependent sectors like commercial real estate and private credit often showing the most delayed and most severe impact.
What is the neutral interest rate?
The neutral interest rate, or r-star, is the rate that neither stimulates nor restricts economic activity when inflation is stable. It cannot be observed directly and must be estimated; the Federal Reserve's own June 2026 projections put the longer-run neutral rate near 3.0% to 3.1%, while Era's own estimate is somewhat higher, closer to 3.5% to 4.0%, based on structurally larger fiscal deficits and higher capital demand than the pre-2020 era.
What are real interest rates?
The real interest rate is approximately the nominal policy rate minus the inflation rate. It matters more than the nominal rate alone because a nominal rate can be either loose or restrictive depending entirely on where inflation sits: a 5% nominal rate is loose against 6% inflation but genuinely restrictive against 2% inflation.
Can fiscal spending offset higher interest rates?
Yes, at least temporarily. Continued government deficit spending can keep liquidity flowing into the economy even as a central bank raises rates, a dynamic known as fiscal dominance. This can delay the expected market and economic effects of monetary tightening, but it does not eliminate underlying refinancing risk, interest expense, or credit deterioration. It simply postpones when those pressures become visible.
Are rate cuts always good for stocks?
No. Preventive rate cuts, delivered because inflation is cooling in an orderly way, tend to support markets. Crisis rate cuts, delivered because credit markets or employment are already deteriorating, frequently coincide with continued equity declines, because the cut itself confirms that underlying conditions are worse than previously priced.
How do rate hikes affect bonds and gold?
Bond prices move inversely to yields, with long-duration bonds carrying the greatest price sensitivity to rate changes; credit spreads can widen further during genuine economic stress. Gold faces a headwind from higher real yields, which raise the opportunity cost of holding a non-yielding asset, but can still perform well when inflation uncertainty, currency instability, or financial stress dominate the real-yield effect.
What should investors watch during a tightening cycle?
Key indicators include the real policy rate relative to the estimated neutral rate, high-yield credit spreads, bank lending standards, Russell 2000 performance relative to large caps, commercial real estate delinquency and maturity data, private-credit stress signals like non-accruals and payment-in-kind usage, and broader liquidity indicators including M2, repo rates, and the Era CrisisMeter.
About Era of Change
Era of Change is an independent macroeconomic research and geopolitical intelligence firm providing institutional-quality analysis for investors worldwide. Its research combines macroeconomics, financial markets, blockchain analytics, artificial intelligence, and geopolitical risk within proprietary forecasting frameworks designed to identify structural market changes before they become broadly recognized.
Era evaluates interest-rate policy through its interaction with fiscal spending, real rates, liquidity, credit markets, refinancing cycles, and systemic risk rather than treating policy-rate changes as isolated signals. Our full methodology, live index reading, and forecast archive are available at eraperemen.info/en.
The content published by Era of Change is for informational and educational purposes only and does not constitute financial, investment, legal, or tax advice. All views expressed are the personal analytical perspective of the author. Past forecast accuracy does not guarantee future results. Readers should conduct their own research and consult a qualified financial professional before making any investment decisions.
Sources
Central Banks and Official Data
- Federal Reserve: FOMC Statement, June 17, 2026
- TradingKey: June Fed Decision — Dot Plot Significantly Raised
- New York Fed: Measuring the Natural Rate of Interest (R-Star)
Credit and Real Estate
- CRE Daily: CMBS Maturity Wall Tests Refinancing in 2026
- Friedman Real Estate: $875 Billion in Commercial Real Estate Loans Mature in 2026
- Kidder Mathews: Why CRE Experts Say the Looming $1.26 Trillion Debt Wall Can Be Scaled
- Mordor Intelligence: Private Credit Market Size & Share Outlook
- Morgan Stanley: Private Credit Outlook — Estimated $5 Trillion Market by 2029
Equity Markets
- Benzinga: Can Fed Chair Ease the Squeeze? Small-Cap Debt Costs Hit 6-Year High
- FinancialContent: Small-Cap Reckoning — Russell 2000 Erases Yearly Gains as Floating-Rate Debt and Yield Spike Batter Main Street
Internal Research
- Yield Curve Explained
- M2 Money Supply Explained
- How Recessions Are Measured
- What Causes Inflation?
- What Is Stagflation?
- Era CrisisMeter Explained
- How Central Banks Respond to Recessions
- Global Debt Risks 2026
- Currency Crises Explained
- Scenario Planning for Investors
— Nikolai Fainizkii, CEO & Senior Analyst, Era of Change



