Executive Summary
Oil is simultaneously a physical commodity, a macroeconomic indicator, a geopolitical asset, a futures market, and an input into virtually every major economy. That combination is precisely why its price can move several percentage points in a single session and 47% in a single year. Brent crude opened 2026 near $65 per barrel and crossed $96 as of September 30, 2026. Most daily oil commentary attributes every large move to whatever geopolitical headline was most recent. Era’s analytical framework ranks the drivers differently.
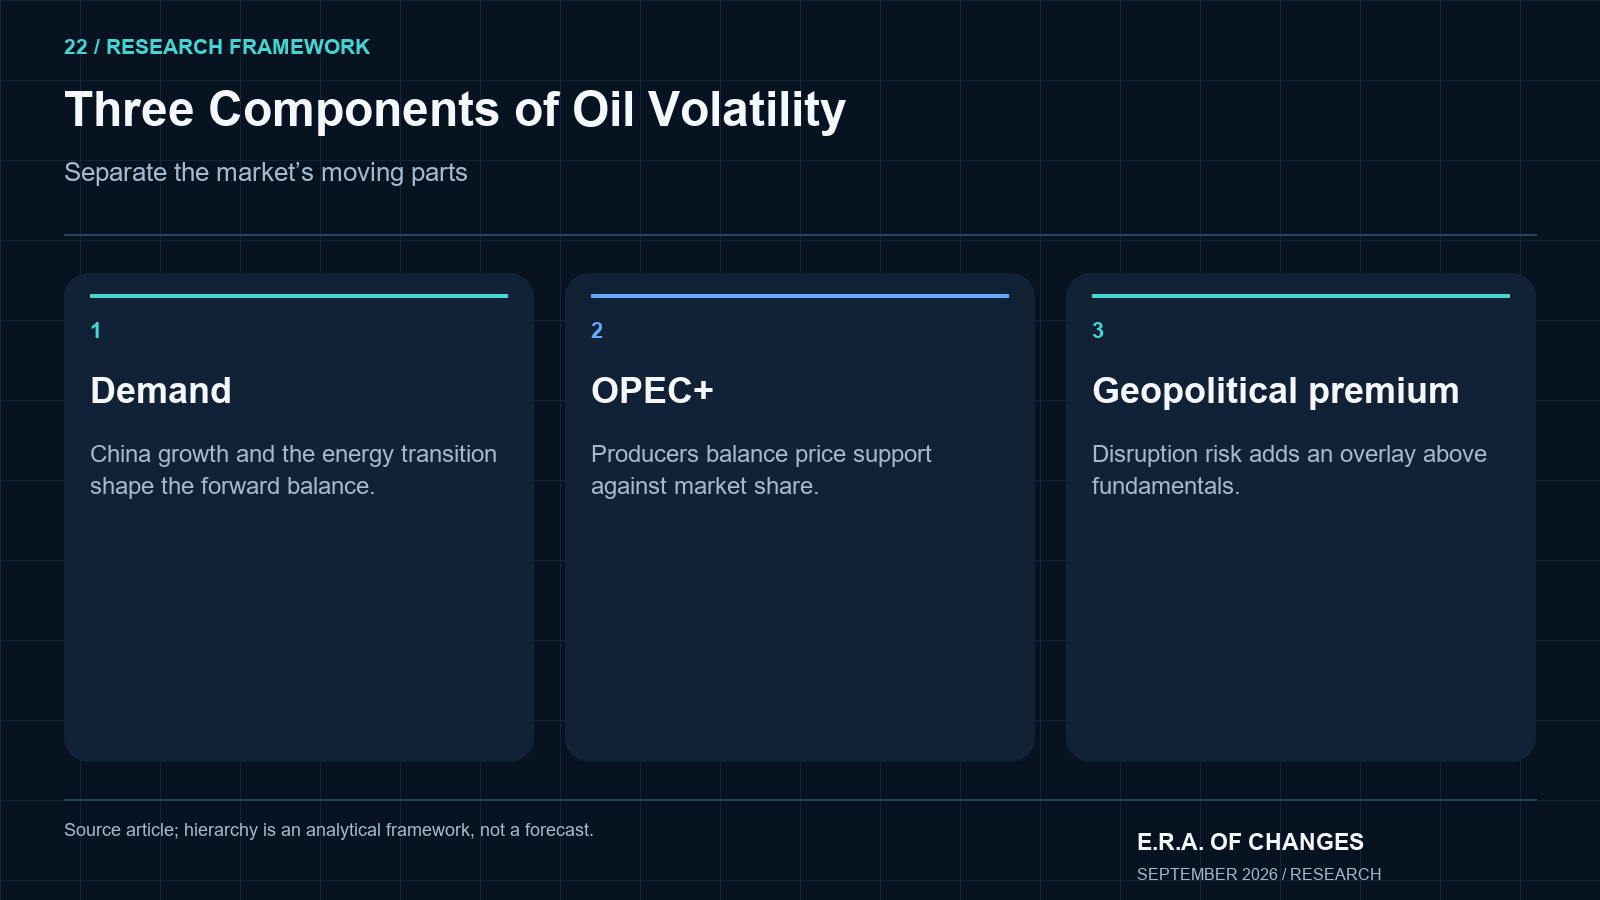
Nikolai Fainizky’s hierarchy for oil price volatility in the current environment places demand uncertainty first, OPEC+ supply discipline second, and geopolitical risk premium third. That ordering is deliberate, and it challenges the default assumption that oil price movements are fundamentally a Middle East story.
On the demand side, China’s growth trajectory and the pace of the global energy transition are the two variables that can most alter the forward oil balance over a six- to eighteen-month horizon. On the supply side, OPEC+ faces the same strategic tension that broke the cartel’s pricing power in 2014–2015: how to balance supporting prices against losing market share to rapidly growing non-OPEC producers in the United States, Guyana, and Brazil. Geopolitics creates a risk premium above the fundamental supply-demand price, but that premium is not the underlying market; it is an overlay that can collapse as quickly as it builds.
Era’s estimate of the fundamental supply-demand price for Brent crude sits in the $65–$70 range. The current market at $96 reflects a geopolitical premium substantially larger than the baseline $5–$10, a direct consequence of Middle East escalation in 2026. The benchmark for all figures in this article is ICE Brent crude.
Key Takeaways
- Demand uncertainty (primarily China’s growth trajectory and the energy transition’s pace) is Era’s highest-ranked oil price driver, ahead of geopolitics.
- OPEC+ must continuously choose between defending price and defending market share as non-OPEC production from the U.S., Guyana, and Brazil grows.
- Brent crude at ~$96 (September 30, 2026) implies a geopolitical premium substantially above Era’s baseline $5–$10 estimate, driven by 2026 Middle East escalation.
- Era’s estimated fundamental supply-demand value for Brent is approximately $65–$70. The difference from the current market price is the premium the market is paying for disruption risk.
- The IEA revised global oil demand forecasts downward by 1.6 million barrels per day in August 2026, a bearish demand signal that has not yet fully countered the geopolitical premium.
- Understanding oil volatility requires decomposing the price into its components: fundamental value, geopolitical premium, and financial positioning, rather than treating it as one unpredictable number.
The Question Most Oil Analysis Gets Wrong
Oil is one of the most heavily analyzed commodities in the world. Every major bank has a commodities desk. The IEA, EIA, and OPEC publish monthly reports. Futures markets price supply and demand expectations with extraordinary granularity. And yet, Brent crude can move $5 in a single session on a single news headline, and then retrace half of that move the following day.
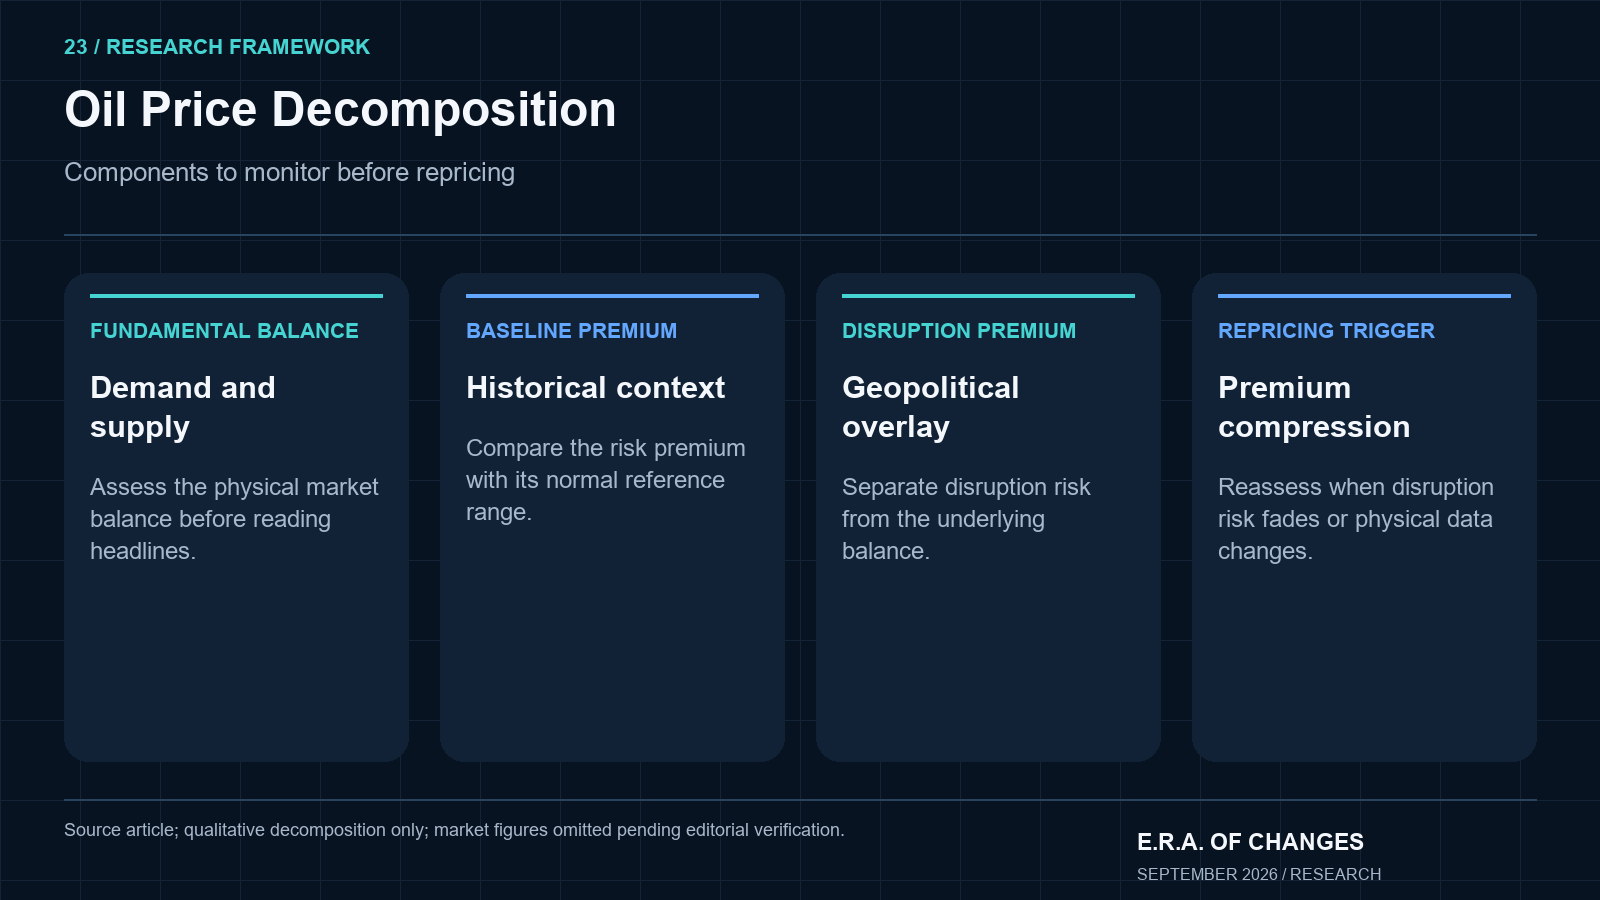
The reason is not that oil is fundamentally unpredictable. The reason is that most investors ask the wrong question. They ask “Why did oil move today?” and look for the nearest headline. Era’s framework asks a different question: “Which component of the oil price is actually moving: expected demand, physical supply discipline, or the geopolitical risk premium?” Those three components behave differently, respond to different signals, and have different durability. Conflating them is the most common analytical error in oil market commentary.
Brent crude opened 2026 near $65 per barrel, right at Era’s estimated fundamental supply-demand value. It crossed $96 as of September 30, 2026. That 47% year-to-date increase was not driven by a fundamental demand surge. In its August 12, 2026 Oil Market Report, the IEA forecast that global oil demand would decline by 1.6 million barrels per day in 2026, with the expected decline 510,000 barrels per day larger than in its July forecast. The price increase was driven overwhelmingly by a geopolitical risk premium that expanded far beyond its historical range of $5–$10 as Middle East conditions deteriorated through the year. Era’s decomposition framework predicted that these components would diverge. That is precisely why the hierarchy matters. Source.
What Is Oil Price Volatility?
Oil price volatility describes the degree and speed at which crude prices change over time. This is worth defining carefully because two investors can look at the same volatile oil market and draw entirely different conclusions depending on whether the volatility reflects a fundamental supply-demand shift or a temporary risk-premium spike.
Realized volatility measures how much prices actually moved over a defined historical period. Implied volatility, extracted from options pricing, measures how much the market expects prices to move in the future. Short-term volatility is frequently driven by inventory data releases, geopolitical headlines, positioning shifts, and futures expiry dynamics, none of which necessarily change the underlying physical balance. Structural price change, by contrast, is driven by actual shifts in supply growth, demand trajectories, technological disruption, and producer strategy, forces that operate on a much longer timeline.
The most analytically useful insight from this distinction: a large daily oil price move does not necessarily mean the long-term supply-demand balance has changed. It may simply mean that a geopolitical premium arrived, or shifted, or disappeared. Understanding which type of volatility is occurring determines whether the appropriate response is to adjust long-term positioning or simply wait for the noise to settle.
Why Oil Prices Are So Volatile
The structural reasons for oil’s inherent volatility are worth understanding before applying any analytical framework.
Demand cannot adjust instantly. Consumers do not stop driving, flying, or shipping goods because oil rises for a week. Industrial and transport demand is relatively inelastic in the short run, meaning that small supply changes can create disproportionately large price moves because demand is slow to respond. Supply cannot adjust instantly either: new production requires drilling, infrastructure investment, permitting processes, and lead times that range from months for shale well completions to years for deepwater projects. Inventories provide a buffer, but finite one: when inventories are drawn down, the market loses its primary shock absorber. And geopolitics can remove supply faster than any of these mechanisms: a shipping disruption, a production outage, or a sanctions escalation can take significant barrels off the market in days, creating price dislocations that take months to resolve.
The mathematical consequence of these structural features: small changes in expected supply or demand can create large price responses, because there is very limited short-term flexibility on either side of the market.
Era’s Three-Component Oil Price Framework
Rank | Driver | Core Question |
|---|---|---|
1 | Demand uncertainty | How much oil will the global economy actually consume? |
2 | Supply discipline | Will OPEC+ maintain production restraint as non-OPEC supply grows? |
3 | Geopolitical premium | How much supply-disruption risk should investors currently price? |
The ranking matters. Most daily oil commentary inverts this hierarchy, treating geopolitics as the primary driver and demand as an afterthought. Era’s framework places demand uncertainty first, not because geopolitics is unimportant, but because over any meaningful investment horizon of six to eighteen months, the balance between actual demand growth and available supply determines whether a geopolitical premium survives or evaporates.
Driver #1: Demand Uncertainty: The Biggest Variable Most Analysis Underweights
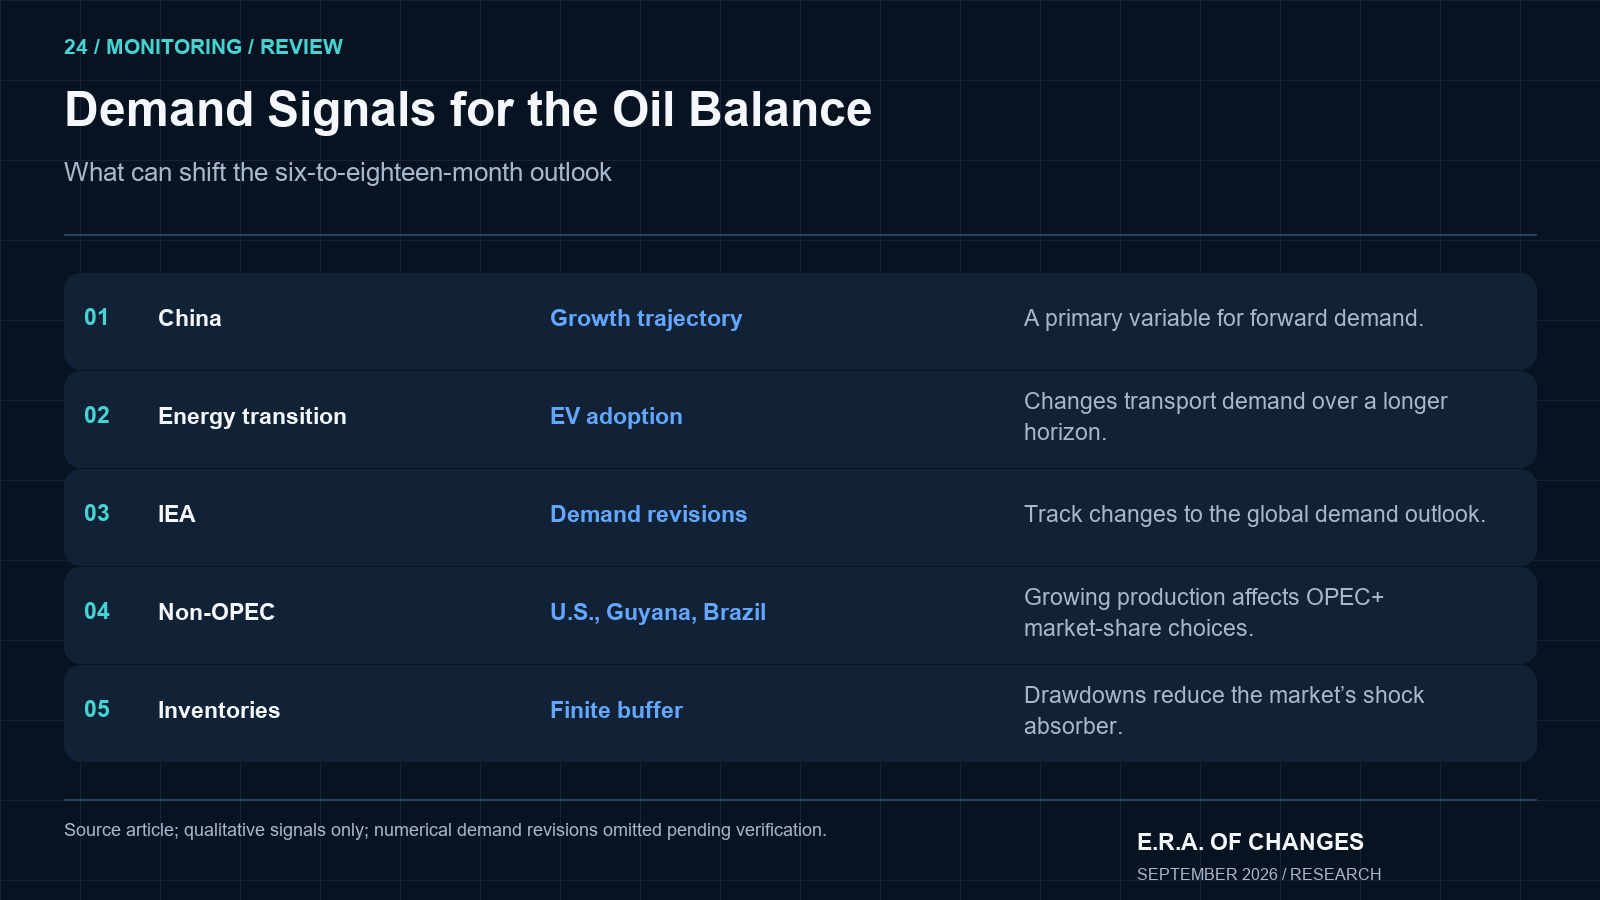
Oil demand is difficult to forecast because it is a derived variable: it depends on global GDP, Chinese industrial activity, aviation recovery, petrochemical feedstock demand, freight volumes, fuel efficiency trends, EV adoption rates, and the pace at which energy transition policies translate into actual behavioral change. Each of these sub-components carries its own forecast error. Compounding them produces significant uncertainty at the aggregate level.
The IEA’s August 2026 forecast illustrates this sensitivity. The agency projected a year-on-year decline of 1.6 million barrels per day in global oil demand for 2026, with the expected contraction 510,000 barrels per day larger than in its July report. The IEA identified the continuing closure of the Strait of Hormuz and elevated fuel prices as important pressures on consumption. The change demonstrates how disruptions and prices can materially alter the demand outlook within a year. Source.
The energy transition adds a second layer of demand uncertainty with a longer time horizon. The critical market question is not merely whether oil demand will eventually peak (most credible analysts accept that it will, at some point) but when, at what level, and how quickly demand declines after the peak arrives. A plateau lasting ten years at 100 million barrels per day has entirely different price implications than a peak followed by rapid structural decline. Electric vehicles reduce petroleum-based transport demand, but petrochemicals, aviation, heavy industry, and emerging-market mobility are demand-sustaining forces that will remain material well into the 2030s. This ambiguity means that even analysts who agree on the long-term directional trend disagree substantially on the near-term oil demand outlook.
China: The Single Most Important Demand Variable
Within the demand picture, China deserves specific attention because relatively small changes in Chinese expectations can materially alter the entire global oil balance.
China’s crude imports are driven by manufacturing activity, freight volumes, petrochemicals, aviation, consumer mobility, and deliberate strategic stockpiling. The EIA estimates China continues to fill its strategic petroleum reserves in 2026 at approximately 1.0 million barrels per day, a component of import demand entirely disconnected from current consumption. Chinese state buying of crude at relatively low fundamental prices is an analytically important overlay that can make Chinese import data look stronger than underlying demand.
For 2026, the IEA forecasts Chinese oil demand growth of approximately 198,000 barrels per day, while the EIA projects a somewhat higher 300,000 barrels per day on stronger economic growth assumptions. The range between those two estimates (roughly 100,000 barrels per day) illustrates the marginal uncertainty. For a global market producing approximately 100 million barrels per day, a 100,000 barrel difference in Chinese demand growth is small in percentage terms. But in a market where supply and demand are perpetually in near-balance, it can be the difference between inventory draws and inventory builds, and that difference can move the price by $5 or more.
Era’s structural concern on China is not necessarily outright demand collapse. It is that a structurally slower Chinese economy (one where property deleveraging suppresses construction activity, industrial credit growth moderates, and EV adoption replaces internal combustion transport faster than currently priced) could reduce the rate of Chinese demand growth to near zero even without absolute consumption falling. A flat China demand trajectory, combined with growing non-OPEC supply, creates a global balance that is difficult for OPEC+ to manage at current price levels. Our China Debt Crisis Risk Analysis covers the deleveraging dynamics in detail.
Driver #2: OPEC+ Supply Discipline
OPEC+ (a coalition of 23 producers including Saudi Arabia, Russia, the UAE, Iraq, and eight other OPEC members plus twelve non-OPEC associates) can influence available global oil supply through production targets and voluntary output adjustments. OPEC+ required production levels for 2026 totaled 39.725 million barrels per day before additional voluntary adjustments. Separately, EIA’s January 2026 Short-Term Energy Outlook forecast average OPEC+ crude oil production of 37.63 million barrels per day for 2026; that figure is a forecast, not observed production, and is not directly comparable with the OPEC+ baseline. Source. Source 2.
The cartel’s influence over the oil price depends critically on two conditions: whether member states actually comply with their assigned quotas, and whether the spare capacity the cartel holds is credible enough to deter over-investment by competitors. Both conditions are structurally under pressure in 2026.
The OPEC+ Dilemma: Price vs. Market Share
The strategic tension at the heart of OPEC+ is not complicated to describe, but it is extremely difficult to resolve. If the group reduces production to support prices, supply falls and prices may rise, but competitors with lower-cost marginal barrels gain market share in the space OPEC+ vacates. If the group increases production to defend market share, volumes improve but price can weaken, potentially below levels that balance the fiscal needs of member states.
This dilemma has no clean solution. A cartel can suppress output to maintain price only as long as the resulting market share loss is acceptable to its members, and that acceptability changes with fiscal circumstances, geopolitical pressures, and competitive dynamics. The sustainability of any price-supporting cut depends entirely on how quickly non-OPEC producers can fill the gap.
The relevant question for the current cycle is how long OPEC+ can support prices above fundamental equilibrium before new supply from outside the cartel (growing in the United States, Guyana, and Brazil) erodes the discipline that makes those prices possible. History suggests this tension eventually resolves in favor of the market. The question is the timing.
The 2014–2015 Historical Analogue
Nikolai’s chosen historical reference for the current OPEC+ strategic challenge is the 2014–2015 oil price collapse. The setup then was as follows: U.S. shale production had grown at approximately 1.0 million barrels per day annually for several consecutive years, adding supply at a pace OPEC had not anticipated and could not easily counter. OPEC, led by Saudi Arabia, faced the same core dilemma: cut production to support prices and cede market share to U.S. shale, or maintain output to defend market share and accept a price correction. The organization chose the latter in late 2014. Brent fell from $115 in June 2014 to below $30 by January 2016.
The producer names have changed. The strategic problem has not.
In 2026, the role that U.S. shale played in 2014 is being played by a combination of U.S. tight oil (still growing, though at a more disciplined pace than the early 2010s boom) plus two new production centers that did not exist as meaningful players in 2014: Guyana and Brazil. Brazil’s crude production is forecast at approximately 4.0 million barrels per day in 2026, supported by additional FPSO vessels at Petrobras’s Buzios field, one of the most prolific deepwater discoveries in the Western Hemisphere. Guyana crossed 900,000 barrels per day in late 2025 after ExxonMobil’s Yellowtail project reached full capacity. The Uaru project, expected online in 2026, adds another 250,000 barrels per day, pushing Guyana toward 1.0 million barrels per day by 2027. Combined with Argentina’s Vaca Muerta shale development, non-OPEC supply growth is projected at roughly 800,000 barrels per day in 2026, with Brazil, Guyana, and Argentina accounting for approximately half of that increase, according to the EIA.
Each of these producers makes independent investment decisions. None coordinates with OPEC+. When their project timelines are set and their FPSOs are commissioned, those barrels come to market regardless of what Saudi Arabia decides about its own production quota. This is the structural pressure OPEC+ faces, not next quarter, but structurally over a two- to four-year horizon.
This comparison should be understood as an analogue, not a prediction that oil must reprice as it did in 2014–2015. The geopolitical conditions in 2026 are materially different from 2014. But the underlying strategic logic (non-OPEC production growth constraining the cartel’s pricing power over time) is structurally present in ways that any serious oil analysis must incorporate.
Driver #3: The Geopolitical Risk Premium
The geopolitical risk premium is the portion of the oil price that investors are willing to pay above the fundamental supply-demand equilibrium price because of the possibility that conflict, sanctions, or shipping disruption removes future supply. It is an option on physical scarcity, priced into the market before that scarcity materializes.
Crucially, the geopolitical premium is not the same as actual lost production. Prices can move $5 or $10 on a geopolitical headline even when zero barrels of physical supply have actually been removed from the market. The premium reflects the market’s assessment of probability-weighted future supply disruption, not current disruption. When conditions de-escalate, the premium can compress just as quickly as it built, often without any change in the physical supply balance.
Era’s Oil Price Decomposition: Brent Benchmark
Era’s analytical estimate of Brent crude’s fundamental supply-demand value (the price at which the market would clear based on the physical balance of global supply and demand, excluding extraordinary risk events) sits in the range of $65–$70 per barrel. This estimate is based on the current trajectory of demand growth, OPEC+ production levels, non-OPEC supply additions, and global inventory dynamics.
Brent crude traded at approximately $96.23 per barrel on September 30, 2026.
The implied geopolitical premium (the gap between Era’s fundamental estimate and the observed market price) is therefore approximately $26–$31 per barrel. This is substantially larger than the baseline $5–$10 range Era uses to characterize a “normal” geopolitical environment in the Middle East. The expansion of that premium in 2026 reflects specific escalation events in the region that have materially raised the probability-weighted expectation of near-term supply disruption. Note that this estimate represents Era’s analytical interpretation and is not market consensus. Multiple legitimate methodologies for estimating this gap exist, and they produce different results.
The year-to-date price trajectory makes the decomposition legible. Brent opened 2026 near $65 (essentially at Era’s fundamental range) and rose progressively as Middle East risks escalated through the first and second quarters. The 47% year-to-date increase to $96 is not a story of demand pulling oil higher. The IEA downgraded demand expectations in August. It is a story of the geopolitical premium expanding to a historically elevated level, sustained by ongoing supply-disruption risk that has not materially diminished as of the end of September.
What would bring the premium back toward $5–$10? Reduced Middle East tensions, shipping normalization through affected chokepoints, lower war-risk insurance premiums, stable Strait of Hormuz flows, reduced risk of direct attacks on production infrastructure, or a meaningful increase in OPEC+ spare capacity that gives the market confidence that any lost supply can be rapidly replaced. None of those conditions are currently in place. If they were, the implied fundamental price would be closer to $70–$80, not $96.
Why the Strait of Hormuz and Red Sea Matter Differently
Not all geopolitical oil risk is equal, and investors benefit from distinguishing between the two primary current chokepoint concerns.
The Strait of Hormuz, at the mouth of the Persian Gulf, transits roughly 21 million barrels of oil per day, approximately 21% of total global petroleum liquids demand, according to EIA chokepoint data. The critical analytical point is not just the volume: it is the extreme difficulty of replacing the route. There is no practical pipeline alternative of comparable scale. A sustained Hormuz disruption (even a partial one that raises tanker insurance costs and slows transit) creates genuine physical supply constraints that cannot be buffered for long, regardless of inventory levels. A Hormuz disruption is a structural supply shock that would force inventory drawdowns globally and likely push prices well beyond their current level.
The Red Sea disruption, by contrast, primarily causes rerouting: ships avoiding the Bab el-Mandeb strait add approximately 10–14 days to Europe-bound voyages by circumnavigating the Cape of Good Hope. This raises freight costs, insurance premiums, and transit times, which feeds into delivered commodity prices and inflation expectations. But it does not constrain the physical volume of oil available globally in the same way Hormuz would. Red Sea risk is a freight and inflation story; Hormuz risk is a supply availability story. The market should price these differently, and historically it does.
For a fuller analysis of the specific scenarios and escalation pathways Era monitors for each chokepoint, see Top 10 Geopolitical Hotspots in 2026 and our analysis of how economic sanctions reshape global trade routes.
Inventories: The Physical Reality Check on Narrative
Oil market narratives can outrun physical reality for weeks or months. Inventories are the mechanism by which physical reality eventually reasserts itself.
When consumption exceeds supply, inventories fall, and a declining inventory trend confirms that the market is genuinely tight. When supply exceeds consumption, inventories build, and rising inventories undermine any geopolitical premium that is not accompanied by actual supply disruption. This is the most important reality check available to oil investors: regardless of what the narrative says, what are inventories actually doing?
The relevant datasets include U.S. commercial crude inventories reported weekly by the EIA, OECD-wide petroleum inventories reported by the IEA, floating storage tracked by tanker data providers, and strategic reserve levels where data is publicly available. One weekly EIA number is noisy and often distorted by seasonal patterns and import timing. The multi-week trend in multiple inventory datasets simultaneously is much harder to dismiss. When inventories are building while the price is high, one of those two signals is wrong, and historically, inventory accumulation eventually wins.
The inventory picture in September 2026 reflects the geopolitical premium’s structural tension: despite the IEA’s downward demand revision, inventories have not built as rapidly as a purely fundamental analysis would predict, because supply disruptions and reduced OPEC+ output (not just risk premium) are providing genuine physical tightness. This is what makes the current premium partially defensible even at elevated levels.
Reading the Oil Futures Curve
The futures curve (the series of prices for oil delivered at different forward dates) contains information about market structure that the spot price alone does not provide.
Backwardation exists when spot and near-term futures prices trade above longer-dated contracts. This typically signals tight near-term physical supply, where buyers are willing to pay a premium for immediate delivery because they are short physical barrels now. Strong backwardation during geopolitical stress suggests the market believes disruption is real and present. Contango exists when future prices exceed the spot: typically in periods of adequate near-term supply and storage incentives, where the market is offering sellers a premium to store oil and deliver later. Contango sustained over time can encourage inventory building and a progressive softening of spot prices.
Brent has been in meaningful backwardation through much of the second and third quarters of 2026, consistent with genuine near-term supply tightness rather than purely financial positioning. When a geopolitical spike occurs, the near-term portion of the curve typically moves more sharply than longer-dated contracts, reflecting a temporary disruption expectation rather than a structural supply deficit. If long-dated contracts barely move while near-term contracts spike, the market is signaling the disruption is expected to be temporary. If the entire curve shifts up together, the market is reassessing the fundamental long-term balance. Monitoring the shape of the curve at the time of a price move provides more information than watching the front-month contract alone.
Oil as an Inflation Transmission Mechanism
Oil price volatility is not merely a commodity market story. It transmits directly into consumer price inflation through multiple channels, which is why Era’s oil framework connects to its broader macro analysis.
Higher crude prices raise fuel costs for transport directly: gasoline and diesel in household budgets and trucking logistics. They raise aviation fuel costs, which flow into airfare. They raise the cost of petrochemical feedstocks, affecting plastics, packaging, fertilizers, and chemicals. Agricultural production costs rise because energy is a major input into fertilizer and farm machinery. The chain from crude to consumer price is long, but it is not slow: fuel prices move almost in real time with crude, and transport cost increases flow through to goods prices within weeks rather than months.
This transmission is one of the reasons a geopolitically elevated oil price complicates central bank decisions in 2026. The Fed, ECB, and BOJ are all managing monetary policy against inflation backdrops that already carry structural pressures from wages, services, and deglobalization. A large oil premium adds headline price pressure that central banks cannot easily dismiss even when they understand it as supply-driven rather than demand-driven. Supply-driven inflation is theoretically “transitory” by definition (it should reverse when the supply shock resolves), but the credibility cost of appearing to tolerate high headline inflation can force policy responses regardless. See our analysis of global inflation trends 2026 and the Inflation Forecast H2 2026 for the broader inflation transmission picture.
Three Oil Market Scenarios for the Remainder of 2026
No probabilities are assigned. These scenarios represent the range of plausible outcomes under different combinations of the three core variables.
Scenario 1: Geopolitical Premium Compression
Middle East risk moderates: through de-escalation, diplomatic progress, or simply the absence of further escalation events. Shipping conditions normalize. War-risk insurance premiums decline. With geopolitical premium compressing back toward the $5–$10 baseline, Brent gravitates toward the fundamental supply-demand range of $65–$75, incorporating modest support from OPEC+ discipline. This scenario does not require positive news; it simply requires the absence of further negative escalation. Given the current $26–$31 premium, this scenario represents significant potential price downside from current levels if realized.
Scenario 2: Geopolitical Supply Shock
A direct disruption to major production or export infrastructure (a sustained Hormuz closure, significant damage to export terminals, sanctions dramatically reducing previously exempted flows, or a major producer’s production falling offline) causes the current risk premium to expand further. Backwardation deepens sharply. Volatility spikes. The price transmission into global inflation accelerates, creating a secondary effect on demand through real income compression. This scenario would validate the current premium level and likely extend it. Era does not assign a dollar target for this scenario without Nikolai’s approval.
Scenario 3: Demand Shock / Oversupply
Chinese economic conditions deteriorate faster than current forecasts, reducing the rate of demand growth toward zero. Non-OPEC supply additions from Guyana, Brazil, and U.S. tight oil continue as planned. OPEC+ compliance weakens as members facing fiscal pressure prioritize volume over price discipline, a recurring pattern in cartel history when prices hold high enough to incentivize cheating. Inventories build progressively. The geopolitical premium compresses. Brent reprices toward the fundamental range or below it as the supply-demand balance shifts to oversupply. See our Global Recession Probability Report for Era’s current assessment of the demand-destruction risk embedded in this scenario.
What Would Change Era’s $65–$70 Fundamental Estimate?
Era should revise the fundamental Brent estimate upward if structural demand growth exceeds current expectations: particularly from China returning to stronger industrial growth, or from emerging-market demand growth surprising higher. A persistent failure of non-OPEC supply to deliver planned volumes would tighten the underlying balance and support higher fundamental prices. Stronger-than-expected OPEC+ discipline sustained over multiple years, combined with falling spare capacity, would also raise the sustainable fundamental price level.
Era should revise the estimate downward if Chinese demand growth weakens structurally rather than cyclically: the key distinction being whether China’s oil demand trajectory looks more like Japan’s post-bubble deceleration than a temporary growth pause. Energy transition demand destruction accelerating faster than current IEA scenarios would also lower the long-run fundamental price. Stronger non-OPEC supply from Guyana’s Uaru project, Brazilian Buzios expansions, and potential additional U.S. tight-oil growth creates downside supply pressure regardless of OPEC+ decisions.
Era Analyst’s Perspective
The most analytically instructive aspect of the 2026 oil market is the divergence between the IEA’s downward demand revision and the price’s upward trajectory. In August 2026, the IEA forecast a 1.6 million-barrel-per-day decline in global oil demand for the year, with the expected contraction 510,000 barrels per day larger than in July, signaling a weaker consumption outlook. In a normal supply-demand-driven market, that kind of downgrade would have pushed prices lower. Instead, Brent rose to nearly $100. The two signals are not contradictory: they reflect the fact that fundamentals and geopolitical premium are genuinely separate components. The market is simultaneously pricing a weaker demand outlook and a significantly larger supply-disruption risk premium. Both can be true at once, which is exactly why Era’s decomposition framework matters. Source.
Nikolai’s hierarchy (demand first, OPEC+ second, geopolitics third) is not a claim that geopolitics is unimportant. It is a claim about durability. Demand trends unfold over years. OPEC+ discipline evolves over quarters. Geopolitical premiums can build in days and collapse in hours. A structural oil investor who builds a thesis on the premise that $26–$31 geopolitical premium is permanent will eventually be wrong about the timing even if directionally right about the geopolitical risk. The framework exists to separate what is durable from what is transient, and to price both honestly.
What Investors Should Monitor
Demand signals worth tracking include Chinese crude imports (published monthly by Chinese customs), global oil demand revisions from the IEA and EIA, PMI readings for manufacturing-heavy economies, and IATA air traffic data for the aviation demand component.
For OPEC+ supply discipline, the key data sources are the OPEC Monthly Oil Market Report, IEA and EIA secondary-source production estimates (which often diverge from official OPEC self-reported figures), JODI data, and satellite-based tanker export tracking. Official quotas are the headline number; actual production verified through multiple independent estimates is the relevant analytical input.
For non-OPEC supply, watch U.S. EIA crude production weekly estimates, Baker Hughes rig counts for the leading indicator, Petrobras quarterly production updates for Brazil, and ExxonMobil project announcements for Guyana milestones.
For geopolitics, the relevant monitoring points are Strait of Hormuz shipping data, Red Sea transit volumes, war-risk insurance premiums for tanker routes, and diplomatic communication channels between major Middle East actors. Era’s CrisisMeter tracks systemic risk indicators that include energy security dimensions.
For the futures market, Brent backwardation/contango structure, CFTC speculative positioning, and options market implied volatility provide the financial overlay on top of the physical picture.
Era’s Oil Market Dashboard (September 30, 2026)
Indicator | Bearish | Neutral | Bullish | Current Reading |
|---|---|---|---|---|
Global demand revisions | Falling | Stable | Rising | Falling (IEA −1.6 mb/d, Aug 2026) |
China demand | Weak | Stable | Strong | Moderate (198–300K bpd growth) |
OPEC+ compliance | Weak | Mixed | Strong | Not directly comparable (EIA January 2026 forecast: 37.63 vs. OPEC+ 2026 required-production baseline before additional voluntary adjustments: 39.725 mb/d) Source. Source 2. |
Non-OPEC supply growth | Strong | Normal | Weak | Strong (Brazil, Guyana, U.S. adding ~800K bpd) |
Inventories | Rising | Stable | Falling | Stable to modestly falling |
Spare capacity | High | Normal | Low | Low-Moderate |
Geopolitical premium | Falling | Stable | Rising | Very Elevated (~$26–$31 implied premium) |
Futures curve structure | Contango | Flat | Backwardation | Backwardation |
The dashboard does not function as a mechanical buy or sell signal. It is a structured summary of the competing forces in the oil market at a point in time.
Frequently Asked Questions
What causes oil price volatility?
Oil price volatility comes from the interaction of three variables that are each uncertain and continuously changing: expected demand for oil globally, the supply discipline of major producers (primarily OPEC+), and the geopolitical risk premium that investors add for the possibility of supply disruption. Because supply and demand are in near-balance at all times, small changes in any of these variables can produce disproportionately large price movements. Short-term demand and supply are both relatively inelastic (neither consumers nor producers can adjust quickly), which amplifies the price response to new information.
Why do oil prices fluctuate so much?
Oil prices fluctuate because they must simultaneously price future demand growth, producer behavior across dozens of sovereign producers with competing interests, and the probability of supply disruptions from geopolitical events that are inherently unpredictable. Additionally, oil is heavily traded in futures markets by financial participants who are not physically buying or selling oil, and whose positioning changes rapidly in response to macro news, risk sentiment, and technical levels. The combination of fundamental uncertainty and financial market dynamics produces greater volatility than most physical commodity markets.
What determines the price of crude oil?
The price of crude oil is fundamentally determined by the balance between global supply and demand for petroleum liquids. Above that fundamental equilibrium, a geopolitical risk premium is added reflecting the market’s assessment of supply-disruption probability. Currently, Brent crude at approximately $96 (September 30, 2026) reflects Era’s estimated $65–$70 fundamental supply-demand value plus a geopolitical premium of approximately $26–$31, substantially elevated above the baseline $5–$10 due to 2026 Middle East conditions. The gap between the fundamental price and the market price will eventually close, either because geopolitical risk diminishes or because the market adjusts its fundamental estimates.
What is Era’s crude oil outlook?
Era estimates the fundamental supply-demand value of Brent crude at approximately $65–$70 per barrel, based on the current trajectory of global demand growth (revised downward by the IEA in August 2026), OPEC+ production levels, non-OPEC supply additions from the U.S., Guyana, and Brazil, and global inventory dynamics. The current market price significantly exceeds this fundamental estimate, reflecting an elevated geopolitical risk premium driven by 2026 Middle East escalation. The outlook depends critically on whether that premium compresses, holds, or expands, which in turn depends on geopolitical developments that cannot be forecast with precision. This estimate should be reviewed against current data before making investment decisions.
How does OPEC affect oil prices?
OPEC+ (a coalition of producers with required production levels for 2026 totaling 39.725 million barrels per day before additional voluntary adjustments) influences prices by adjusting available supply. When the group restricts output, reduced supply can support prices if demand is stable or growing. When it increases output, additional supply competes for market share. OPEC+’s actual leverage depends on quota compliance, spare capacity credibility, and how quickly non-OPEC producers fill any gap it creates. The group’s strategic dilemma is structural: supporting prices by cutting supply creates space for U.S., Guyanese, and Brazilian production to grow, gradually eroding OPEC+’s share of the global market, the same dynamic that produced the 2014–2015 price collapse. Source.
Why does China affect oil prices?
China is the world’s largest crude oil importer and the marginal demand growth driver for the global oil market. Its industrial activity, freight volumes, petrochemicals sector, aviation recovery, and strategic reserve purchases together determine whether global oil demand grows faster or slower than supply in any given year. The IEA forecasts Chinese demand growth of approximately 198,000 barrels per day for 2026, while the EIA projects 300,000 barrels per day, and that gap of roughly 100,000 barrels per day in estimated Chinese growth is sufficient to determine whether global inventories draw or build over the course of a year.
How does geopolitics affect crude oil?
Geopolitics primarily affects oil prices through the risk of supply disruption: the possibility that conflict, sanctions, or shipping route closures remove barrels from the global market. This risk is priced as a premium above the fundamental supply-demand equilibrium price. The premium does not require actual supply disruption to persist; probability-weighted disruption risk is sufficient. When geopolitical conditions worsen (as they have through 2026), the premium expands. When conditions improve, the premium can compress rapidly. Currently, Era estimates the implied geopolitical premium in Brent crude at approximately $26–$31 above the fundamental price range.
What is the geopolitical risk premium in oil?
The geopolitical risk premium is the portion of the oil price investors are willing to pay above the fundamental supply-demand equilibrium because of the possibility of future supply disruption. Era estimates Brent’s fundamental supply-demand value at approximately $65–$70, and current Brent at $96 implies a premium of approximately $26–$31. In normal Middle East conditions, this premium historically runs $5–$10. The current elevated premium reflects specific 2026 escalation that has materially raised the probability-weighted expectation of near-term supply constraints. The premium is not directly observable: it is estimated by comparing the observed price to an independently derived fundamental value.
What is backwardation in oil markets?
Backwardation occurs when spot and near-term oil futures prices trade above longer-dated contracts. It typically signals tight near-term physical supply: buyers are willing to pay a premium for immediate delivery because they need barrels now. Strong backwardation in Brent through Q2 and Q3 2026 is consistent with genuine near-term supply tightness, not purely financial speculation. Backwardation also incentivizes inventory drawdown, as rolling futures positions generates a positive roll yield when the near-term contract is above the longer-dated one.
What is contango in oil?
Contango is the opposite of backwardation: future prices exceed spot prices. It typically indicates adequate near-term supply and creates a financial incentive to store oil and sell it forward. Sustained contango can depress spot prices as stored inventory competes with new production. It is a structural signal of oversupply when persistent. Contango also imposes a cost on investors rolling long futures positions, as they sell a higher near-term contract and buy a lower longer-dated one, the reverse of backwardation’s roll benefit.
How do inventories affect oil prices?
Oil inventories are the physical counterpart to price narratives. When consumption exceeds supply, inventories fall, confirming physical tightness. When supply exceeds consumption, inventories build, undermining any premium not backed by actual disruption. Monitoring the multi-week trend in EIA weekly U.S. crude inventories, IEA OECD-wide petroleum data, and floating storage provides the physical reality check on whether geopolitical and demand narratives are matching actual market flows.
Could non-OPEC production push oil prices lower?
Over a two- to four-year horizon, growing non-OPEC supply from Brazil (forecast at approximately 4.0 million barrels per day in 2026), Guyana (approaching 1.0 million barrels per day by 2027), and continued U.S. tight-oil growth creates structural competitive pressure on OPEC+ pricing. The 2014–2015 analogue is instructive: when U.S. shale grew faster than OPEC could offset, the resulting market-share conflict triggered a major price repricing. The same strategic logic is present today: the producer names have changed, but the economics of non-OPEC supply crowding out cartel space remain the same. Whether and when this materializes as sustained price downside depends on OPEC+ discipline, the geopolitical premium trajectory, and actual demand growth.
How does oil affect inflation?
Oil price increases transmit into consumer price inflation through fuel costs, transport and logistics, aviation, petrochemical inputs, agricultural production costs, and manufacturing energy inputs. The transmission is relatively fast for fuel prices (days to weeks) and somewhat slower for supply-chain cost pass-through (weeks to months). A $26–$31 geopolitical premium in oil adds measurable pressure to headline CPI across energy-importing economies, one of the reasons the IEA demand downgrade and price elevation are creating complicated signals for central banks managing inflation in the second half of 2026. See our Inflation Forecast H2 2026 for the specific transmission estimates by region.
What is Era’s oil price forecast?
Era distinguishes between a fundamental price range and an observed market price. The fundamental supply-demand range for Brent is approximately $65–$70, representing the price at which global supply and demand would balance without extraordinary geopolitical risk events. The observed market price includes a geopolitical premium currently estimated at approximately $26–$31 above that range, driven by 2026 Middle East escalation. Whether Brent at $96 is sustainable depends on whether the current geopolitical premium proves durable. Era does not publish a specific dated price target for Brent crude without further analysis and Nikolai’s approval of a formal forecast with defined invalidation conditions. The Era Forecasting Methodology describes the framework we apply to all directional calls.
About E.R.A. OF CHANGES
E.R.A. OF CHANGES is an independent macroeconomic research and geopolitical intelligence firm providing institutional-quality analysis to investors worldwide. Our research combines macroeconomics, financial markets, blockchain analytics, and geopolitical risk into proprietary forecasting frameworks designed to identify structural market trends before they become consensus. The Era Global Risk Index (updated daily from 24 structural indicators) serves as the foundation of our analytical methodology, providing a forward-looking measure of systemic financial stress grounded in structural economic evidence rather than market sentiment. Our full methodology, live index reading, and forecast archive are available at eraperemen.info/en.
The content published by E.R.A. OF CHANGES is for informational and educational purposes only and does not constitute financial, investment, legal, or tax advice. All views expressed are the personal analytical perspective of the author. Past forecast accuracy does not guarantee future results. Readers should conduct their own research and consult a qualified financial professional before making any investment decisions.
Sources
Global Oil Supply and Demand - International Energy Agency: Oil Market Report - U.S. Energy Information Administration: Short-Term Energy Outlook - OPEC: Monthly Oil Market Report - JODI Oil World Database
Non-OPEC Production - EIA: Brazil, Guyana, Argentina Driving 2026 Oil Output Growth - OilPrice.com: EIA: Brazil, Guyana, Argentina Driving 2026 Oil Output Growth - World Oil: Brazil, Guyana and Argentina drive non-OPEC crude growth
OPEC+ Strategy - Offshore Industry: OPEC+ Production Strategy 2026 - Argus Media: OPEC cuts US supply view, Brazil to lead in 2026
Pricing - Investing.com: Brent Crude Oil Futures - ICE: Brent Futures - CME Group: WTI Crude Oil
Chokepoints and Geopolitics - EIA: World Oil Transit Chokepoints - International Maritime Organization
Internal Era Research - Era Forecasting Methodology - Era CrisisMeter Explained - Top 10 Geopolitical Hotspots in 2026 - How Sanctions Affect Global Trade - Inflation Forecast H2 2026: U.S. CPI Outlook - What Is Stagflation? - Emerging Market Investment Risks - Global Inflation Trends 2026 - Global Recession Probability Report - China Debt Crisis Risk Analysis



