Executive Summary
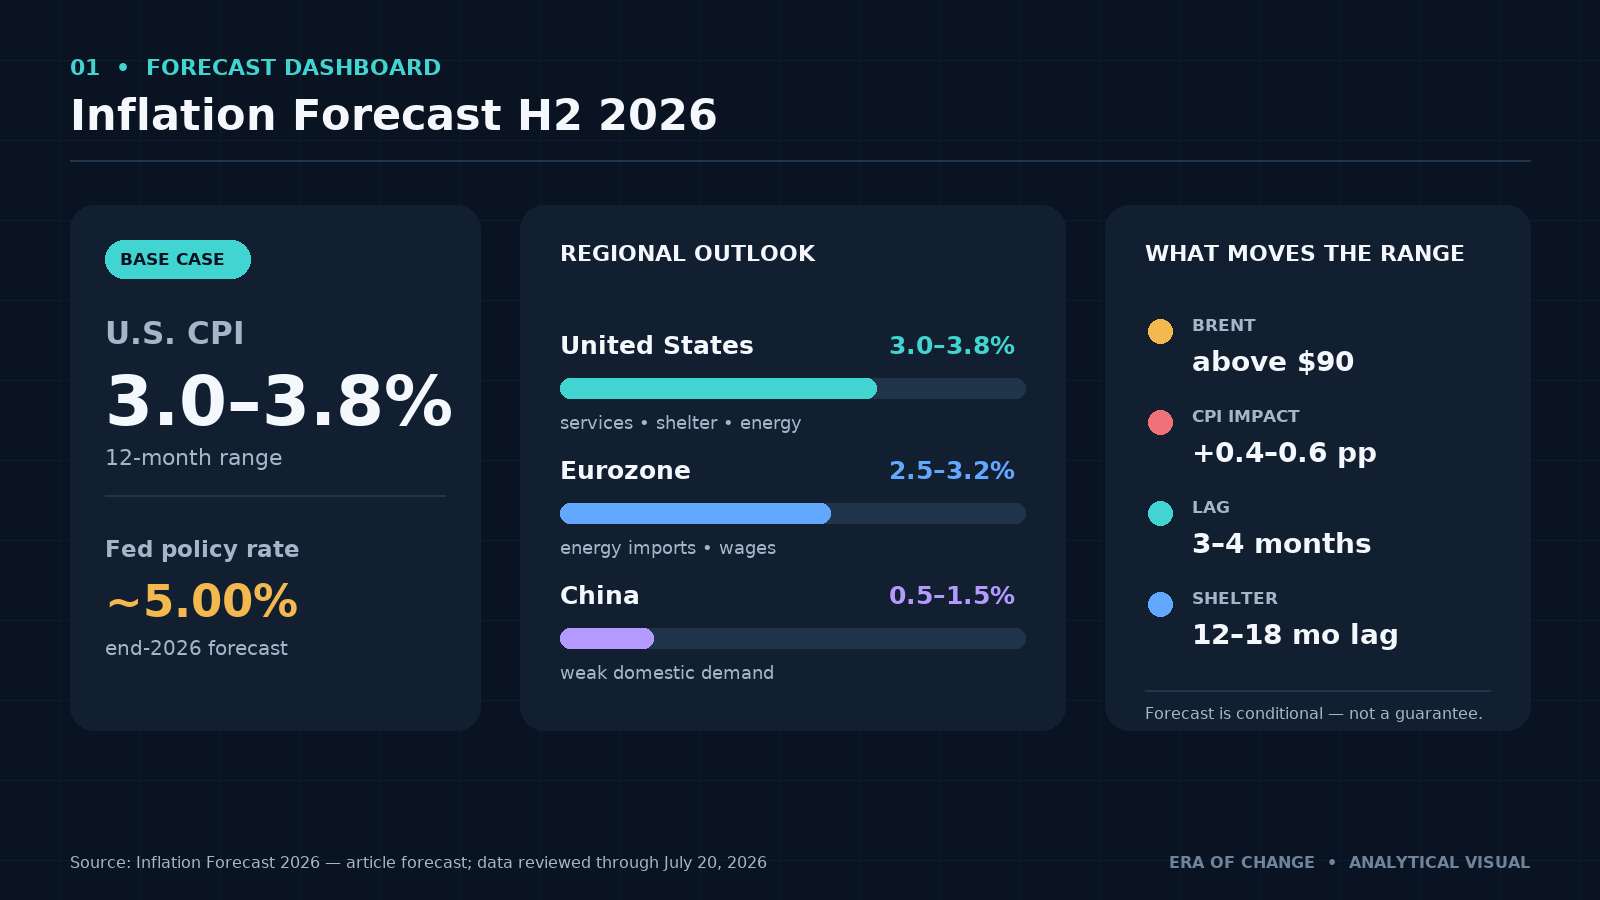
Headline inflation cooled to 3.5% in June, and I can already hear the relief in how people are talking about it. I don’t share it, not yet. Era’s 12-month U.S. inflation forecast is 3.0% to 3.8%, a range, not a straight line down to the Fed’s 2% target. We put eurozone inflation at 2.5% to 3.2% and China at 0.5% to 1.5%, a fundamentally different problem that looks nothing like ours. Our base case assumes services inflation stays persistent, shelter costs remain sticky longer than consensus expects, and consumer demand doesn’t collapse outright.
The most important upside risk I’m watching is energy, specifically Brent crude holding above $90 for a sustained stretch, which we can trace through the economy with real precision, not a vague gesture at “pass-through.” The main downside scenario, the one that would actually get us to 2% quickly, isn’t a soft landing. It’s a hard recession, a liquidity crisis, and unemployment above 4.5%, and I want to be clear that this isn’t a scenario anyone should be rooting for just because the CPI print would look better.
We expect the Federal Reserve’s policy rate to end 2026 near 5.00%, well above where futures markets are currently positioned, conditional on inflation and financial-stability data holding roughly where they are now. Every number in this piece is a conditional range tied to explicit assumptions, not a guarantee, and I’ll tell you exactly what would prove each one wrong.
Key Forecasts at a Glance
| Region / Indicator | Era Forecast | Main Driver | Principal Risk |
| U.S. inflation (headline CPI, 12-month) | 3.0%–3.8% | Services, shelter, energy | Oil shock or hard recession |
| Eurozone inflation | 2.5%–3.2% | Energy imports, wage pressure | Supply disruption |
| China inflation | 0.5%–1.5% | Weak domestic demand | Stimulus surprise or commodity shock |
| Fed policy rate, end-2026 | ~5.00% | Sticky inflation | Premature easing or default stress |
| Brent crude risk threshold | Above $90 | Geopolitical disruption | 0.4–0.6 pp CPI impact |
Methodology note: This forecast covers a 12-month horizon from the July 2026 publication date, with data reviewed through July 20, 2026. Unless specified otherwise, U.S. figures refer to headline CPI; core and supercore readings are called out explicitly where they diverge meaningfully from the headline number. All ranges will be reviewed against actual outcomes in Era's monthly Forecast Scoreboard, and material revisions to this forecast will be dated and explained, not applied retroactively.
Introduction
Falling headline inflation does not mean inflationary pressure has disappeared. That's the misconception I want to address directly, because it's shaping how a lot of very smart people are currently positioning their portfolios.
Goods prices can cool sharply, used cars, electronics, apparel, while services inflation stays elevated underneath, because services are priced differently: they’re labor-intensive, wage-linked, and slow to reprice downward. Shelter costs, which carry enormous weight in the CPI basket, adjust on a lag measured in quarters, not weeks, because rental leases don’t reset overnight. And an energy shock reaches the checkout counter with its own lag, working through freight costs and input prices before it ever shows up in a gas-station sign. The final stretch of any disinflation, the move from 3% down toward 2%, is consistently harder than the initial decline from a much higher peak, because what’s left standing by that point is exactly the stuff that doesn’t move quickly.
So the real question for H2 2026 isn't whether inflation keeps falling. Some of it will. The question is whether markets are underestimating the risk of a second wave building underneath a headline number that looks encouraging on the surface.
Era's Inflation Forecast for H2 2026
United States, 3.0% to 3.8%
Our range rests on five specific assumptions. Services inflation remains elevated rather than collapsing toward zero. Shelter disinflation continues, but slower than the consensus expects: owners’ equivalent rent rose 3.3% year-over-year in June, and because shelter in the official data tends to lag real-time market rents by roughly 12 to 18 months, that component has more room to fall, but on its own schedule, not the market’s.
Energy does not remain permanently above the stress threshold we describe below, though it spends meaningful stretches of H2 there given the Strait of Hormuz situation. Labor-market deterioration is gradual, not abrupt: average hourly earnings grew 3.5% year-over-year in June, an acceleration from May’s 3.4%, which tells you the labor market hasn’t cracked yet. And the Federal Reserve avoids the kind of aggressive, front-loaded easing that would reheat demand before the sticky components have actually cooled.
Eurozone, 2.5% to 3.2%
Europe’s inflation problem is structurally different from ours, even though the headline numbers can look similar on a chart. Euro area annual inflation came in at 2.8% in June, down from 3.2% in May, with energy decelerating from 10.8% to 8.5% year-over-year and core inflation easing to 2.4% from 2.6%. That’s genuine progress. But the eurozone’s exposure to imported energy makes it structurally more sensitive to exactly the Gulf shipping risk I cover in detail below, and its industrial base, already weaker than America’s, has less room to absorb another cost shock without layoffs.
Wage growth across the bloc remains sticky enough, and fiscal room in several member states tight enough, that the ECB’s own June decision to raise its deposit rate to 2.25%, its first hike since 2023, tells you the Governing Council is more worried about a fresh energy-driven acceleration than about growth right now.
China, 0.5% to 1.5%
China’s problem isn’t inflation. It’s closer to the opposite. Chinese CPI rose just 1.0% year-over-year in June, missing the 1.1% consensus estimate and slowing from May’s 1.2%, with food prices down 1.6% year-over-year. Weak domestic demand, continued property-sector stress, and industrial overcapacity are keeping consumer prices pinned near flat. What’s notable, and what most coverage of China misses, is the divergence between that soft consumer number and producer prices, which jumped 4.1% year-over-year in June, the strongest reading since July 2022, driven by elevated energy costs tied to the same Iran conflict pressuring the rest of the world and by AI-related industrial demand.
Chinese producers are absorbing that cost pressure rather than passing it to consumers, because consumer demand is too weak to support it. If Beijing shifts toward more aggressive stimulus to counter this, the resulting demand and commodity impulse could ripple into global inflation on the same 9-to-12-month lag we track through the China Credit Impulse, worth watching even though it isn’t our base case for H2.
Why Headline CPI May Understate Persistent Inflation
Official inflation statistics remain essential — I'm not arguing otherwise. But no single number captures every form of price pressure in the economy simultaneously, and treating headline CPI as the whole story is how investors get blindsided by inflation that never actually left the building.
Shelter Costs Adjust Slowly
Rent and owners'-equivalent-rent measures are built from surveys that update on a rolling basis, which means official shelter inflation reflects a blend of new and existing leases rather than the market rate on any given day. Shelter carries roughly 35% of the CPI basket, so this single component moves headline inflation more than almost anything else in the index and because it lags real-time market rents by well over a year, it can stay elevated in the official data even after actual market rents have already cooled, or reaccelerate even after the headline print looks calm.
Services Inflation Is More Persistent
Services are priced differently than goods. They're labor-intensive (insurance, healthcare, transportation services, personal care) and wages don't reprice downward the way a container of imported electronics does. Employment costs, limited productivity gains in several service sectors, and genuinely tight labor availability in specific trades all keep this component sticky, which is exactly why services inflation tends to decline gradually rather than falling off a cliff the way goods prices can.
What Supercore Inflation Reveals
Supercore inflation, services inflation excluding shelter, strips out both the volatility of goods prices and the reporting lag baked into shelter, leaving something closer to a real-time read on wage- and service-sector pressure. Supercore services rose 3.1% year-over-year in June, down from May’s 3.7%, and were essentially flat month-over-month, a genuine improvement, but still running well above what’s consistent with 2% headline inflation over time. I don’t treat supercore as the one “real” inflation number and everything else as noise. It’s a supplementary lens, and right now it’s telling us the underlying trend is cooling but not resolved.
The Main Inflation Drivers for H2 2026
Services and Wage Pressure
Wage growth, labor availability in specific sectors, and service-sector margins all feed directly into how quickly services inflation can actually fall. Average hourly earnings rose 3.5% year-over-year in June, which, against 3.5% headline CPI, means real wage growth is essentially flat. That’s not the dynamic of an overheating labor market forcing prices higher through pure demand pressure. It’s closer to wages and prices chasing each other in a tight loop, which is exactly the kind of dynamic that resolves slowly rather than snapping back to target.
Shelter and Housing Costs
Rental renewals, mortgage costs for anyone refinancing or moving, homeowners insurance, which has risen sharply in numerous states independent of the broader inflation trend, property taxes, and maintenance and construction expenses all sit inside this category. Most of these reprice on an annual or multi-year cycle, which is the structural reason shelter disinflation, even when it’s genuinely underway, shows up gradually rather than all at once.
Energy and Transportation
Energy affects far more than what shows up at the gas pump. It moves through freight costs, aviation fuel, agricultural input costs, manufacturing energy bills, packaging, chemicals, and household utility costs, a transmission chain wide enough that a sustained oil shock touches nearly every line item in the CPI basket eventually, just on different timelines. I walk through the specific math on this below, because it’s the single most quantifiable driver in this forecast.
Deglobalization and Supply-Chain Fragmentation
Reshoring, friendshoring, tariffs, and the kind of shipping-route risk currently playing out through the Strait of Hormuz all add redundancy costs and reduce efficiency relative to the pre-2020 model of maximally optimized global supply chains. Container spot rates from China to the U.S. East Coast are running roughly 75% above pre-conflict levels, with North Europe up 51%, the Mediterranean up 45%, and the transatlantic route up 57%, none of that is temporary noise. It’s a real, ongoing cost that businesses are currently absorbing or passing through, and every month it persists it becomes more structural rather than transitory.
Money Supply and Financial Conditions
M2 has stabilized after its sharp 2022–2023 contraction, and credit creation is showing early signs of reacceleration as the Fed maintains a restrictive but no longer tightening stance. If that liquidity backdrop shifts toward renewed expansion, through premature rate cuts or a resumption of aggressive balance-sheet growth, it would risk reigniting both demand-side inflation and asset-price inflation simultaneously, which is exactly the dynamic we mapped in detail in M2 Money Supply Explained.
The Brent $90 Scenario
This is the part of the forecast I want to walk through with actual numbers attached, because most inflation commentary gestures vaguely at “oil prices matter” without ever showing the mechanism.
If Brent crude remains above $90 for a sustained period, the inflationary effect reaches the broader economy with a lag of approximately three to four months. The chain runs in a specific, traceable sequence: oil prices hold above $90, freight and transportation costs rise as a direct consequence, industrial and agricultural input costs increase because nearly everything physical has to move, businesses pass some portion of those elevated costs through to consumers rather than absorbing all of it in margin, and core inflation rises with the lag noted above once that pass-through actually lands in retail pricing.
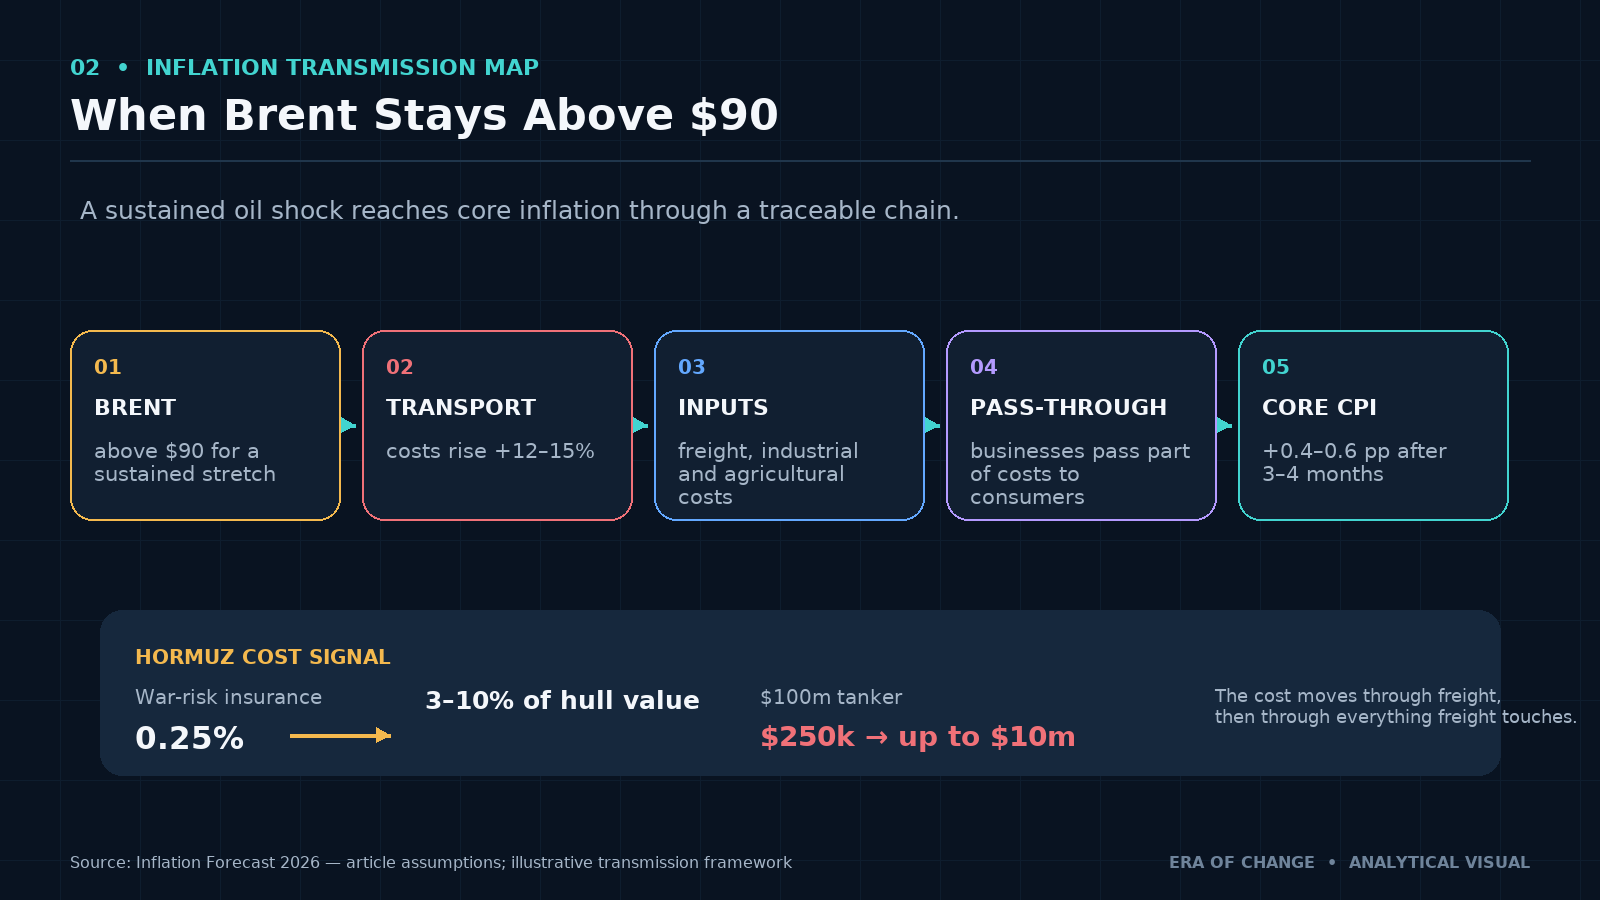
This isn’t theoretical right now. Brent has been trading through the high $80s and repeatedly above $90 in July as tanker attacks resumed in the Strait of Hormuz and Iran again restricted passage through the waterway, on top of the ceasefire that had briefly calmed the February–June conflict. War-risk insurance premiums on Hormuz transits, which sat around 0.25% of hull value before the conflict began, have surged to a range of 3% to 10% of hull value depending on vessel type, on a $100 million tanker, that’s a jump from roughly $250,000 per transit to as much as $10 million. That cost does not stay with the shipowner. It moves through freight rates, then through everything freight touches.
Era’s specific assumption: sustained Brent above $90 raises transportation costs by approximately 12% to 15%, and the estimated contribution to annual U.S. core CPI from that transmission chain is approximately 0.4 to 0.6 percentage points. That’s not a rounding error against a 2% target, it’s close to a third of the gap between where core inflation sits today and where the Fed actually wants it.
Assumptions box: this estimate depends on the duration of elevated oil prices, how much of the cost increase businesses actually pass through to consumers versus absorb into margin, the state of consumer demand at the time, currency movements affecting import costs, and any government intervention, a strategic reserve release, for instance, or a windfall-profits response, that could blunt the transmission. Treat 0.4–0.6 percentage points as a central estimate under sustained conditions, not a guaranteed outcome.
Three Inflation Scenarios for H2 2026
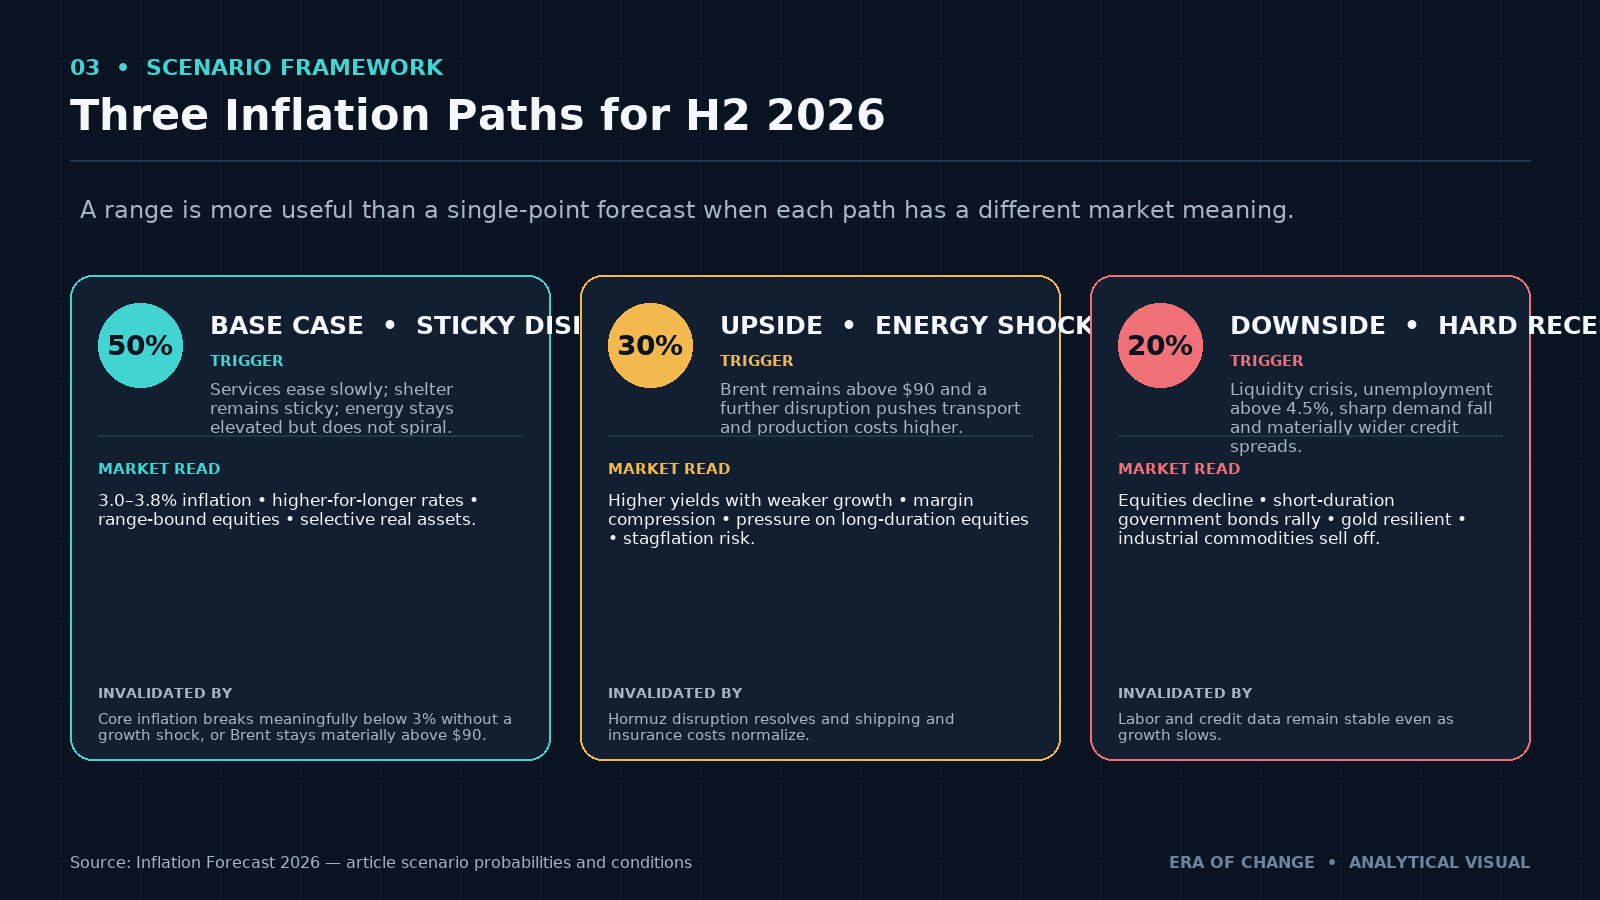
A single-point forecast invites readers to treat it as a prediction instead of a probability-weighted range, so here are the three paths, each with the conditions that would trigger it and the conditions that would prove it wrong.
Base Case, Sticky Disinflation (50% probability). U.S. inflation remains within our 3.0%–3.8% range. Energy prices stay elevated but don’t spiral, services inflation eases slowly rather than collapsing, shelter remains sticky on its usual lag, and the labor market cools without breaking, unemployment drifting modestly higher rather than spiking. The Fed holds its current stance or adjusts only cautiously. Market implications: higher-for-longer rates, range-bound equities, continued pressure on rate-sensitive and unprofitable businesses, and support for selectively held real assets. This case is invalidated by either a sustained break of core inflation meaningfully below 3% without an accompanying growth shock, or by Brent holding materially above $90 for an extended stretch.
Upside Scenario, Energy Shock (30% probability). Brent remains above $90 for a sustained period, a scenario that, as of this writing, is already partially underway. A further Middle East escalation disrupts supply or shipping beyond current levels, transportation and production costs continue rising, inflation expectations drift higher, and the Fed finds itself unable to ease materially even as growth slows. Potential implications: higher bond yields even as growth weakens, margin compression across the real economy, pressure on long-duration and unprofitable equities, relative strength in energy and commodity-linked assets, and rising stagflation risk of exactly the kind we mapped in What Is Stagflation?. This case is invalidated by a durable resolution to the Hormuz disruption that brings shipping and insurance costs back toward pre-conflict levels.
Downside Scenario, Hard Recession (20% probability). A liquidity crisis develops, unemployment rises above 4.5%, consumer demand falls sharply, credit spreads widen materially, and commodity demand contracts alongside it. Based on our broader framework, the likely asset-market pattern here is equities declining substantially, short-duration government bonds rallying as investors seek safety and anticipate cuts, gold holding up comparatively well, and industrial commodities facing real selling pressure as demand genuinely evaporates rather than merely slowing. Inflation would fall quickly under this scenario, but because of demand destruction, not healthy normalization, which matters enormously for how markets should actually read a falling CPI print if this is the path we’re on. This case is invalidated by labor-market and credit-spread data remaining stable even as growth slows, which would argue for the base case continuing instead.
Federal Reserve Rate Forecast for the End of 2026
Era’s forecast is a federal funds rate near 5.00% at year-end 2026, noticeably above where the Fed currently sits at 3.50%–3.75%, and well above where futures markets are broadly positioned. I want to be direct about why: the Fed is genuinely trapped between two distinct policy errors, and I don’t think the market has fully priced how narrow that path actually is.
The Risk of Cutting Too Early
If the Fed eases before the sticky components of inflation have actually resolved, inflation expectations risk becoming less anchored, financial conditions ease prematurely, demand and asset prices reaccelerate together, and any subsequent energy or supply shock becomes materially harder to absorb without a second inflation wave. This is the central bank capitulation scenario we’ve written about in detail elsewhere, rate cuts delivered because political or market pressure demands them rather than because the data actually supports them.
The Risk of Holding Too Tight for Too Long
The opposite error carries its own real cost. Corporate defaults increase, particularly among highly leveraged companies that lose access to affordable refinancing. Bank and credit stress intensifies. Unemployment rises further than necessary. And a recession that could have been mild becomes severe purely because policy stayed restrictive past the point where it was still doing useful work.
The Fed’s actual challenge in H2 2026 isn’t choosing between a good outcome and a bad one. It’s balancing two distinct forms of risk against each other in real time, with imperfect data and a lag between action and effect that makes the balancing act genuinely difficult even for a well-run institution, a dynamic we cover from the policy-tool side in How Central Banks Respond to Recessions.
What Would Cause Inflation to Fall Quickly?
I want to be honest about something markets tend to gloss over: rapid disinflation from here would probably not be a benign development. The conditions that would actually deliver it are a severe recession, a genuine collapse in demand, liquidity stress in credit markets, and unemployment rising above 4.5%.
It’s worth drawing a sharp line between two things that can both produce a falling CPI print but mean entirely different things for markets. Healthy disinflation happens when productivity and supply improve while growth continues, more capacity, better logistics, easing input costs, all while people keep spending. Recessionary disinflation happens when prices slow because households and businesses simply can no longer spend, full stop. Both show up as the same number on the same chart. They produce completely different outcomes for equities, credit, and employment, which is exactly why the “why” behind a falling CPI print matters as much as the number itself.
What the Market May Be Getting Wrong
A return to 2% is not automatic. The last stage of any disinflation is consistently the hardest, precisely because what remains by that point, services, shelter, structural costs, is the stuff that resists moving quickly by construction.
Rate cuts are not necessarily bullish. Cuts delivered because of recession or financial stress can coincide with falling earnings and widening credit spreads at the same time policy is nominally becoming more accommodative, the market’s reflexive “cuts are good” instinct breaks down precisely when the cut is a symptom rather than a cure.
Energy is still a macro variable, not a sector story. Investors frequently treat oil as an energy-sector-specific issue rather than something that touches inflation, monetary policy, transportation costs, sovereign balances, and consumer demand simultaneously, the Brent transmission chain above is the clearest illustration of why that framing is too narrow.
Lower headline CPI can hide sticky internal components. Cooling goods prices, the part of the basket that moves fastest and gets the most media attention, can mask persistent services and shelter inflation sitting quietly underneath a headline number that looks encouraging on its own.
Asset-Market Implications of the Inflation Outlook
This is scenario analysis based on our structural framework, not individualized investment advice.
Equities remain sensitive to the rate path in both directions, valuation multiples compress when yields stay elevated longer than expected, and margin pressure from sticky input and labor costs hits companies without real pricing power far harder than it hits those that can pass costs through. The gap between profitable, pricing-power businesses and unprofitable growth names dependent on cheap capital is likely to widen rather than narrow under our base case.
Government bonds split by duration. Short-duration bonds tend to benefit in a genuine recession scenario, as rate-cut expectations build. Long-duration bonds remain sensitive to both inflation risk and the sovereign-debt concerns we cover in Global Debt Risks 2026, falling policy rates do not automatically translate into falling long-term yields if the market is simultaneously worried about deficit financing.
Gold benefits from falling real yields, currency uncertainty, and geopolitical risk, and it’s one of the few assets in this framework that shows resilience across both the upside energy-shock scenario and the downside recession scenario, a genuinely useful property when the two tail risks pull in opposite directions for almost everything else.
Commodities split by type: energy and industrial metals benefit directly from supply shocks like the one currently unfolding in the Gulf, but remain vulnerable to demand destruction if the downside recession scenario materializes instead. Agricultural commodities carry their own separate weather and input-cost dynamics layered on top.
The U.S. dollar plays a genuinely dual role here. It can weaken if the Fed eventually eases policy meaningfully, but it can strengthen anyway during a genuine global liquidity crisis, when the dollar’s reserve-currency status and safe-haven demand dominate the simple interest-rate-differential story.
Era Analyst’s Perspective
From Nikolai Fainizkii, CEO & Senior Analyst, Era of Change
“The number everyone quotes is headline CPI, and it’s the number I trust least right now. Supercore services, services inflation excluding shelter, cooled to 3.1% year-over-year in June from 3.7% in May. That’s real progress, and I won’t pretend otherwise. But it’s still running roughly 50% above what’s consistent with the Fed’s actual target over time, and it’s the component that tells you what wages and service-sector pricing are actually doing beneath the goods-price noise.
The scenario I think is genuinely underpriced isn’t inflation running hot from strong demand. It’s inflation staying sticky while growth slows, and I’d point directly at what’s happening in the Strait of Hormuz right now as the mechanism. War-risk insurance on tanker transits has gone from a quarter of a percent of hull value to as much as ten percent inside a matter of months. Container rates on the China–U.S. East Coast route are running 75% above where they sat before the conflict. That’s not a headline story anymore. It’s a freight bill showing up on invoices right now, and it takes three to four months to fully show up in core CPI from here.
If the Fed reads a falling headline number in Q3 and treats it as license to cut aggressively, while services stay sticky and energy costs are still working their way through the system, that’s exactly the setup for the second inflation wave I’ve flagged before. I’d rather the Fed hold at 5.00% into early 2027 than cut prematurely and have to reverse course six months later. The second move is always more expensive than the first one would have been.”
— Nikolai Fainizkii, CEO & Senior Analyst, Era of Change
How Era Builds Its Inflation Forecast
We don’t extrapolate a single CPI trend line forward and call it a forecast. What we actually track is a cluster of interacting indicators: headline and core CPI, supercore inflation, shelter and real-time rent indicators, wage growth and employment costs, M2 and credit growth, energy and commodity prices, shipping and freight costs, market-implied inflation expectations, credit spreads, yield-curve dynamics, and geopolitical risk, synthesized continuously through the Era CrisisMeter. The full methodology behind how these indicators interact, and how much weight judgment carries relative to the underlying models, is laid out in Era Forecasting Methodology.
The distinction that matters is this: a forecast built from a single trend line breaks the moment one input changes, an oil shock, a surprise Fed decision, a labor-market inflection. A forecast built from interacting indicators can absorb that kind of shift and tell you which direction the range should move, rather than simply being wrong.
Indicators That Would Change the Forecast
Signals that would lower the forecast: a sustained decline in supercore inflation beyond June’s improvement, faster shelter disinflation than the current 12-to-18-month lag implies, weakening wage growth, falling energy and freight costs as the Hormuz situation genuinely stabilizes, unemployment rising materially, credit contraction, and M2 weakening again after its recent stabilization.
Signals that would raise the forecast: Brent holding above $90 for an extended period, renewed or broader supply-chain disruption beyond the current Gulf shipping situation, premature Federal Reserve easing that reaccelerates demand, accelerating M2 or bank-credit growth, rising inflation expectations in market-based measures, dollar weakness that raises import costs, and new tariffs or trade restrictions layered on top of the deglobalization pressure already in the system.
Forecast Accountability
This forecast was published in July 2026, with data reviewed through July 20, 2026, covering a 12-month horizon. Era will review it publicly against subsequent CPI, energy, labor-market, and policy outcomes in the monthly Forecast Scoreboard. Material revisions will be dated and explained at the time they’re made, not applied retroactively without disclosure, the same standard we hold every forecast to.
Frequently Asked Questions
What is the U.S. inflation forecast for the rest of 2026?
Era’s 12-month U.S. inflation forecast is a range of 3.0% to 3.8%, based on persistent services inflation, gradually easing but still-elevated shelter costs, and energy prices that spend meaningful stretches of H2 2026 above the $90 Brent threshold given the ongoing Strait of Hormuz situation.
Will inflation fall to 2% in 2026?
Our base case does not have U.S. inflation reaching 2% within 2026. The final stage of disinflation, moving from roughly 3% down to 2%, is structurally harder than the earlier decline from much higher peak inflation, because the remaining components, particularly shelter and services, are the ones that resist moving quickly.
What is the CPI forecast for H2 2026?
Era expects headline CPI to remain within a 3.0%–3.8% range through H2 2026 under the base case, with the specific level within that range depending heavily on how the Brent crude and Strait of Hormuz situation develops over the period.
Why is services inflation still high?
Services inflation is labor-intensive and wage-linked, which makes it slower to decline than goods prices. June’s supercore reading, services excluding shelter, came in at 3.1% year-over-year, down from May’s 3.7%, but still running well above the pace consistent with 2% headline inflation over time.
What is supercore inflation?
Supercore inflation measures services inflation excluding shelter, stripping out both goods-price volatility and the reporting lag built into official shelter measures. It’s a supplementary indicator, not a replacement for headline or core CPI, that helps reveal underlying wage- and service-sector pressure more directly.
How would oil above $90 affect inflation?
Era’s model estimates that sustained Brent crude above $90 raises transportation costs by approximately 12% to 15% and contributes an estimated 0.4 to 0.6 percentage points to annual U.S. core CPI, with the effect reaching the broader economy on a lag of roughly three to four months as elevated freight and input costs work through to retail pricing.
Will the Federal Reserve cut interest rates in 2026?
Era’s forecast is that the Fed’s policy rate ends 2026 near 5.00%, above the current 3.50%–3.75% range, reflecting persistent inflation pressure that limits the Fed’s room to ease. This forecast is conditional and would change materially if inflation cools faster than our base case or if financial-stability conditions deteriorate.
What could cause inflation to fall quickly?
Rapid disinflation from current levels would most likely require a severe recession, a genuine collapse in consumer demand, liquidity stress in credit markets, and unemployment rising above 4.5%. This kind of recessionary disinflation is a materially different, and worse, outcome for markets than healthy disinflation driven by improving supply and productivity.
What is the inflation outlook for Europe?
Era forecasts eurozone inflation in a range of 2.5% to 3.2%, informed by June’s 2.8% reading. The eurozone’s greater exposure to imported energy makes it structurally more vulnerable to the same Gulf shipping disruption affecting the U.S. outlook, which is part of why the ECB raised rates in June rather than continuing to ease.
Is China facing inflation or deflation?
China’s problem is closer to persistently weak inflation than acceleration. June CPI rose just 1.0% year-over-year, with food prices actually declining, even as producer prices jumped 4.1% year-over-year, the fastest pace since mid-2022, reflecting elevated energy costs that Chinese producers are largely absorbing rather than passing on to already-weak consumer demand.
About Era of Change
Era of Change is an independent macroeconomic research and geopolitical intelligence firm providing institutional-quality analysis for investors worldwide. Its research combines macroeconomics, financial markets, blockchain analytics, artificial intelligence, and geopolitical risk within proprietary forecasting frameworks designed to identify structural market changes before they become broadly recognized.
Era's inflation outlook integrates consumer-price data with liquidity, credit conditions, energy markets, labor costs, monetary policy, and geopolitical developments, and forecast performance is reviewed publicly through the Era Forecast Scoreboard. Our full methodology, live index reading, and forecast archive are available at eraperemen.info/en.
The content published by Era of Change is for informational and educational purposes only and does not constitute financial, investment, legal, or tax advice. All views expressed are the personal analytical perspective of the author. Past forecast accuracy does not guarantee future results. Readers should conduct their own research and consult a qualified financial professional before making any investment decisions.
Sources
United States
- Bureau of Labor Statistics: The Employment Situation, June 2026
- Bureau of Labor Statistics: Measuring Price Change in the CPI — Rent and Rental Equivalence
- Federal Reserve: FOMC Statement, June 17, 2026
- Federal Reserve Bank of New York: The Measurement of Rent Inflation
- FRED: CPI for All Urban Consumers, Services Less Rent of Shelter
- PERC (Texas A&M): One-Third of CPI — How Shelter Shapes Inflation Trends
- Gianluca Benigno: US June-26 CPI Inflation Report
- FX.co: US Average Hourly Earnings Growth Edges Up to 3.5% YoY in June 2026
International Institutions
- Eurostat: Annual Inflation Down to 2.8% in the Euro Area
- European Central Bank: Monetary Policy Decision, June 11, 2026
- National Bureau of Statistics of China: Consumer Price Index, June 2026
Energy and Supply Chains
- CNBC: China Consumer Price Growth Weakens in June While Producer Inflation Rises to Near 4-Year High
- The National: Shipping Insurance Surges Again as Attacks Intensify Over Strait of Hormuz
- Bloomberg: Shipping Insurance Costs to Cross Hormuz Soar After Vessel Attacks
- Hormuz Strait Monitor: War Risk Insurance & Tanker Rates Explained
- Wikipedia: 2026 Strait of Hormuz Crisis
Internal Research
- Era Global Risk Index
- Era CrisisMeter Explained
- Era Forecasting Methodology
- What Causes Inflation?
- What Is Stagflation?
- M2 Money Supply Explained
- How Central Banks Respond to Recessions
- 2026 Mid-Year Global Outlook
- Global Debt Risks 2026
— Nikolai Fainizkii, CEO & Senior Analyst, Era of Change



