Executive Summary
Era currently estimates a 35 to 40 percent probability of a U.S. recession developing within the next 12 months. That figure is higher than most institutional consensus (Goldman Sachs ran at approximately 30 percent through the spring of 2026, and JPMorgan was at roughly 35 percent in April), but it reflects a deliberate judgment that headline economic data is masking distributional weakness beneath the surface, particularly among lower- and middle-income consumers whose pandemic savings were exhausted by mid-2025.
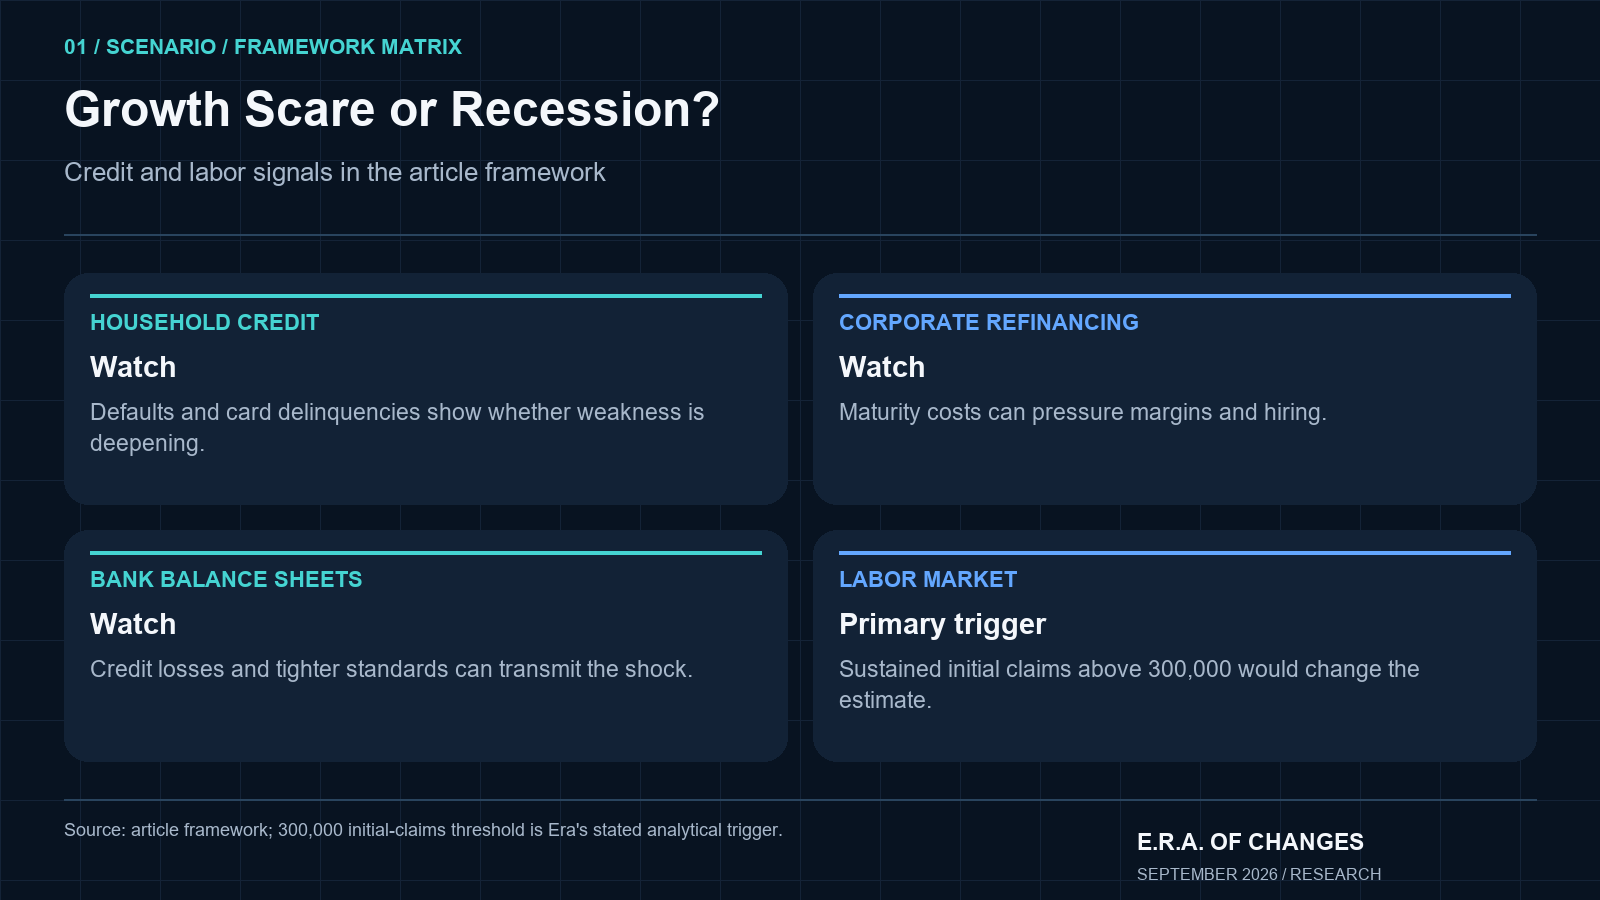
The current regime is a growth scare, not a confirmed recessionary transition. The distinction matters enormously. A growth scare can persist for quarters without becoming a recession if the consumer holds, credit losses stay manageable, and companies can refinance their obligations without material defaults. A recessionary transition occurs when those three pillars begin to crack simultaneously: when household defaults accelerate enough to damage bank balance sheets, when corporate refinancing access deteriorates, and when the labor market stops absorbing the shock.
None of those conditions are fully met as of September 2026. But the conditions for them to develop are in place. The single indicator I am watching most closely (sustained Initial Jobless Claims above 300,000) remains well below that threshold, with the week ending September 12 printing 196,000. That is the number that would force an immediate revision of this probability estimate upward.
Key Takeaways
- Era’s current 12-month U.S. recession probability is 35–40%, above institutional consensus and deliberately so.
- The economy is in a growth scare, not a recession. The critical transition from one to the other is not imminent but is not distant.
- Initial Jobless Claims sustained above 300,000 is Era’s primary labor-market trigger for revising the probability higher.
- Consumer credit deterioration is more important than weak PMI readings: the 90-plus-day credit card delinquency rate reached 13.12 percent in Q1 2026, the highest in 15 years.
- The refinancing wall in corporate debt and commercial real estate is Era’s primary fundamental recession trigger, not geopolitics.
- Higher-for-longer interest rates matter through duration, not just magnitude; debt rolled over at 2026 rates costs dramatically more than the debt it replaces.
- The Conference Board Leading Economic Index receives reduced weight in Era’s framework because its manufacturing-heavy composition produces systematic lag in a services-dominant economy.
- Era’s biggest internal risk is that the 35–40% estimate understates the true probability because fiscal liquidity and elevated asset prices are masking underlying consumer deterioration.
Introduction
Recession forecasts are almost always presented as binary. Either the economy is falling into contraction or it is not. Either the Fed has orchestrated a soft landing or it has failed. Either the recession camp is right or the soft-landing camp is right. This binary framing is analytically useless, because it skips the state the economy is actually in for most of the time that a recession risk cycle is active.
An economy can spend six, twelve, sometimes eighteen months in a zone that is not a recession and not a boom. Manufacturing surveys soften. Business confidence falls. Equity multiples compress. Financing costs bite. Consumer sentiment deteriorates. All of this can happen (and in the United States in 2026, it has) without crossing the threshold that separates slower growth from a self-reinforcing economic contraction.
The technical name for this state is a growth scare. The analytical challenge is that growth scares look identical to the early phase of a real recession until the key data diverges. What separates them is not weak survey data or declining confidence. What separates them is what happens to household credit, corporate refinancing access, and bank balance sheets when the pressure is sustained.
That is the question this report tries to answer honestly. Are the structural pressures currently in the system severe enough to force that transition, or do they stay contained at a level that produces a slow, uncomfortable expansion rather than a contraction? Era’s current answer is: contained, but only conditionally. The conditionality matters more than the headline probability.
Era’s Current U.S. Recession Probability
35–40% | Forecast Horizon: 12 months | As of September 2026
This is a probability, not a prediction. A 35 to 40 percent estimate means that based on the indicators Era currently tracks, recessionary conditions have a meaningful but non-dominant probability of developing within the defined horizon. It does not mean recession is the base case. It does not mean GDP has a 40 percent chance of contracting next quarter. It does not guarantee that a recession, if it occurs, begins at any specific month.
For context: Goldman Sachs ran at approximately 25 percent at the start of 2026, raised to around 30 percent following the Hormuz disruption and oil price surge in March, and has not materially revised that estimate since spring. JPMorgan stood at approximately 35 percent in April. Polymarket, which reflects the aggregated bets of thousands of participants, briefly touched 30 percent in April 2026.
Era’s estimate sits at the upper end of that range, and the reason is deliberate. I believe institutional consensus may be underweighting the distributional deterioration among lower-income consumers, and I believe the refinancing arithmetic in corporate credit and commercial real estate has not yet been fully absorbed into mainstream probability estimates. These are not fringe views. They are the structural underpinnings that will determine whether 2026 ends as a soft landing or as the beginning of something more serious.
The number that would change this estimate most rapidly, in either direction, is sustained Initial Jobless Claims. For the week ending September 12, 2026, initial claims printed at 196,000: the lowest since the 60-year low in July, and more than 100,000 below Era’s trigger threshold. That single data point is why the current regime is growth scare rather than recessionary transition.
Growth Scare vs. Recession: The Most Important Distinction
The most persistent analytical error I see in recession commentary is the conflation of warning signals with the recession itself. Falling PMI surveys, compressing equity multiples, weakening consumer confidence: these can all appear months before a recession and then quietly fade without one. They can also appear and then accelerate into the thing they warned about. The data alone cannot tell you which case you are in while you are in it.
The critical distinction is where the weakness is located. In a growth scare, surveys soften and sentiment falls, but households continue servicing their debts, corporate access to refinancing remains open, and credit losses stay within the range that bank balance sheets can absorb without tightening lending. The weakness is in confidence and valuation, not in the underlying credit structure.
A recessionary transition begins when the credit structure breaks. Specifically: household default rates rise fast enough that banks begin recording meaningful losses on consumer portfolios, credit-card charge-off rates accelerate to the point that lending standards tighten, corporate refinancing access deteriorates (meaning companies that need to roll debt encounter either unavailable capital or prohibitively expensive capital), and layoffs accelerate broadly enough that the initial claims trend breaks above critical thresholds.
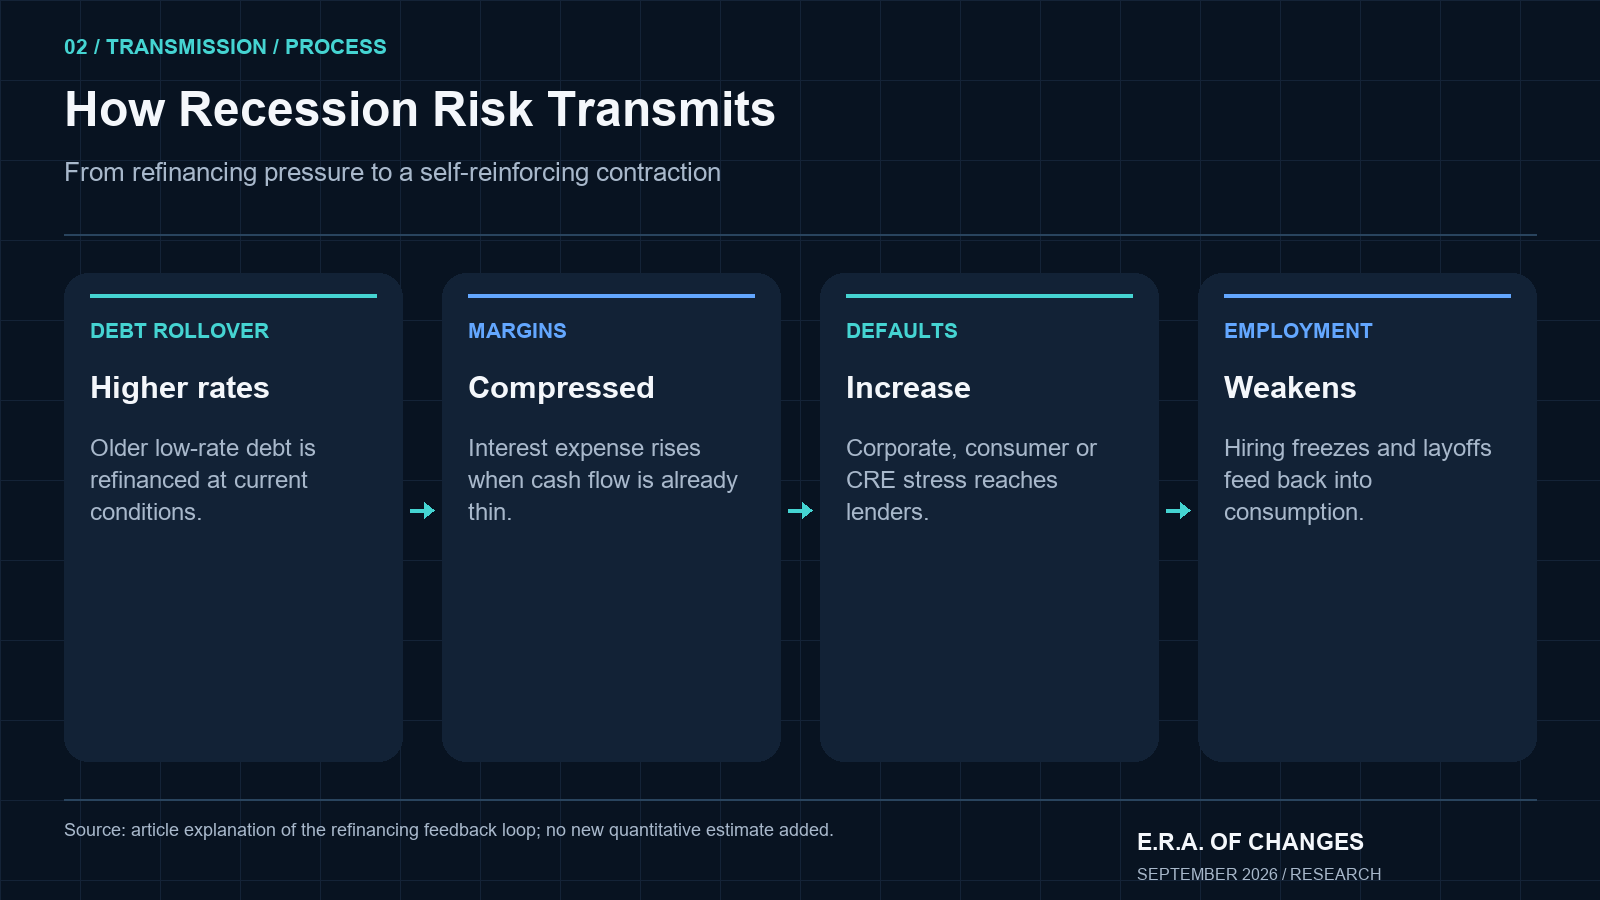
At that point, a feedback loop ignites. Higher rates push debt service costs up. Consumer defaults rise. Banks take credit losses. Lending standards tighten. Consumption weakens. Corporate revenues fall. Payrolls are cut. More defaults follow. The system enters what economists call a self-reinforcing contraction, and what everyone else calls a recession.
We are not in that feedback loop as of September 2026. But several of its input conditions are present in embryonic form. Credit card delinquencies at the 90-plus-day level reached 13.12 percent of balances in Q1 2026: the highest since 2010, according to the Federal Reserve Bank of New York. That is not a recessionary reading, but it is not a healthy one. It indicates that the share of consumers who have fallen significantly behind on debt service is at a 15-year high, even as the share falling newly delinquent at the 30-day level (currently 2.85 percent) has actually edged down from its 2024 peak.
The divergence between the 30-day and 90-day delinquency rates is itself a warning. It tells me that fewer new accounts are becoming delinquent, but those already in trouble are falling deeper into it, not catching up. That is not what a healing consumer credit picture looks like.
The Jobless Claims Trigger: Why 300,000 Is Era’s Line
Initial Jobless Claims are the most important high-frequency labor market signal in the U.S. economic data landscape, and they are the single indicator I watch most closely when evaluating whether the current growth scare is metastasizing into something worse.
The reason is straightforward. The Bureau of Labor Statistics publishes initial claims every Thursday, covering the week ending the prior Saturday. The data reflects real-time layoff activity: specifically, the number of workers filing for unemployment benefits for the first time. It is more current than the monthly payroll report by three to four weeks, more sensitive to deterioration at the margin, and historically among the first indicators to break before a recession becomes visible in GDP or the official unemployment rate. The How Recessions Are Measured article on this site explains in detail why GDP and NBER classifications are rear-view mirrors; initial claims is one of the few data series that can serve as a real-time lens.
Era’s threshold is 300,000 sustained over several consecutive weeks, not a one-week spike driven by seasonal anomalies or a specific industry event, but a structural shift in the trend that reflects broad-based layoff acceleration. Below that level, labor weakness remains contained enough that income continues supporting consumption and debt servicing. Above it, the conditions for a consumer credit feedback loop to ignite become materially more probable.
As of the week ending September 12, 2026, the seasonally adjusted initial claims figure was 196,000. The four-week moving average was approximately 206,000. Continuing claims stood at 1.73 million, the lowest since January 2024. The labor market is not signaling recession by this measure. It is signaling a healthy labor market that is the primary reason this cycle has not tipped from growth scare into contraction.
That can change. The refinancing wall has not yet crested. CRE maturities peak in 2027. A deterioration in corporate default rates (which rose to their highest full-year total since 2010 in 2025, with 785 large corporate filings) could begin transmitting into layoffs in sectors disproportionately exposed to zombie capital structures. I am watching this indicator weekly. The moment the trend breaks above 300,000 on a sustained basis, this probability estimate moves materially higher.
The Primary Fundamental Risk: The Refinancing Wall
The biggest recession trigger in the current environment is not geopolitical. It is not the trade war, not the Iran-Israel ceasefire negotiations, not the South China Sea. It is arithmetic. Specifically, it is the arithmetic of rolling over debt at 2026 interest rates when that debt was originally issued at 2019 or 2020 or 2021 rates.
Here is the mechanism. A company borrowed in 2021 at 4 percent on a five-year leveraged loan. That loan matures in 2026. To refinance it, the company must access capital markets today, where investment-grade borrowing costs are closer to 5.5 to 6 percent and speculative-grade borrowing costs are materially higher. Despite high-yield spreads being relatively compressed at approximately 270 basis points over Treasuries as of September 2026, the underlying Treasury yield is substantially above 2021 levels. The company’s interest expense jumps. Its margins compress. If cash flow was already thin, and for many companies in the lower-quality credit universe, it was, the company cannot service the new debt comfortably.
S&P Global estimates that debt maturities for U.S. companies are running at nearly $3 trillion in 2026, up sharply from approximately $2 trillion in 2024. The S&P 1500 alone has $586 billion in debt coming due this year. For investment-grade companies with strong cash flows and wide refinancing windows, this is manageable. For the estimated 2,000 zombie companies in the U.S. (firms whose operating earnings are insufficient to comfortably cover their interest costs and who have survived through years of cheap refinancing), the wall is existential. Large U.S. corporate bankruptcies hit 785 filings in 2025, the highest since 828 were recorded in 2010, and rose for the third consecutive year.
The sequence matters: debt matures, refinancing costs jump, margins collapse, hiring freezes, defaults rise, and then layoffs follow. That sequence takes months to develop and even longer to appear in headline labor data. It is operating right now, below the surface, in the leveraged and low-quality tiers of the corporate credit market. My attention is on whether the current HY spread compression (which reflects a market that is not yet pricing significant default acceleration) holds or begins to widen as actual default events accumulate through the fourth quarter of 2026.
Commercial Real Estate: The Delayed Channel
Commercial real estate operates on a longer clock than most of the economic transmission channels I monitor. CRE loans run for five to ten years. Problems in the sector often become visible only when loans mature and the refinancing mathematics fail. The loans originated in 2017 and 2022 are maturing now. The maturities peak in 2027.
Approximately $930 billion in commercial real estate mortgages mature in 2026, according to Vitti Capital research. The delinquency rate on CRE loans at major banks (those with assets exceeding $250 billion) was 4.06 percent in Q4 2025. That is down from a peak of 4.99 percent in Q3 2024, but it is seven times the pre-pandemic average of approximately 0.58 percent. Multifamily loan delinquencies (a segment many assumed would be resilient due to housing demand) reached 1.47 percent in Q1 2026, with delinquent balances hitting $9.78 billion.
The structural problem is office. Hybrid work has permanently altered utilization rates in major metros. Vacancy rates in the 15 percent to 25 percent range in markets like San Francisco, Chicago, and Washington have compressed the value of office collateral well below the loan balances it was underwriting. When those loans mature, the math fails: the property cannot support the debt at current valuations and current rates. The owner can inject equity, sell at a loss, or default. Many are defaulting.
The transmission mechanism to a broader recession runs through banks. Small and mid-sized banks hold disproportionate CRE exposure relative to their capital. The FDIC’s 2026 Risk Review identified CRE concentration as one of the primary systemic vulnerabilities in the U.S. banking sector. If CRE losses accelerate from their current pace, the transmission into tighter lending standards and reduced credit availability is direct. Credit contraction from that channel (combined with consumer credit stress and corporate refinancing pressure) is the combination that could convert a sustained growth scare into the real thing.
The Indicator Era Trusts Least Right Now
The Conference Board Leading Economic Index produced continuous recession signals for more than eighteen months from 2022 into 2024, during a period when the U.S. economy was expanding. The index declined month-over-month in most readings during that stretch, and the Conference Board itself warned of near-term recession at several points. No recession occurred.
The LEI declined again in August 2026 (edging down 0.1 percent to 99.5) after a modest recovery in July. It is now showing a six-month rate of decline of -0.1 percent, a significant improvement from the -0.6 percent pace of the prior six months. The Conference Board’s own economic forecast is for 1.9 percent real GDP growth in 2026, not contraction.
My concern with the LEI is structural, not cyclical. The index was built for a manufacturing-heavy industrial economy. It carries significant weights on manufacturing new orders, building permits, and average hours in manufacturing. The modern U.S. economy generates approximately 70 percent of its output from services, a share that has grown consistently for decades. The LEI’s composition does not adequately reflect that shift. The result is a systematic tendency to produce false positive recession signals when manufacturing and goods production slow, even when the services economy, the labor market, and consumer spending remain intact.
This is not a claim that LEI is broken as a concept. It is a claim that Era currently assigns it reduced weight relative to the labor, consumer credit, and corporate refinancing indicators described above. When manufacturing-sensitive indicators and credit-market indicators diverge, I trust the credit-market indicators. They reflect realized behavior (actual debt service, actual defaults, actual lending conditions) rather than survey-based expectations that can reflect sentiment without reflecting action. For the full context of how Era weights its indicator hierarchy, see Era Forecasting Methodology.
The Two-Speed Consumer
Era Analyst’s Perspective
The recession probability debate in the United States is, at its core, a debate about which consumer you are looking at. The data at the aggregate level tells one story. The data at the distribution tells another.
Households with significant equity market exposure (roughly the top 40 percent by wealth) have seen balance sheets supported by an equity market that, despite the 37 percent correction from Bitcoin’s October 2025 peak and the broader risk-asset volatility, remained historically elevated by the end of Q2 2026. The S&P 500 housing wealth effect is real. For this cohort, higher yields on savings also provide meaningful income support. They are not in distress.
The cohort I am concerned about is the household earning $40,000 to $80,000 annually. This group exhausted its pandemic-era savings buffer (built on the $2,000 stimulus checks and enhanced unemployment benefits of 2020 and 2021) by mid-2025, according to the San Francisco Fed’s analysis of excess savings depletion. Their credit-card utilization rate has risen. Their 90-plus-day delinquency rate, at 13.12 percent of balances in Q1 2026, is the highest since the 2008–2010 crisis period. They are not defaulting at crisis rates. But they are financing consumption with credit at a pace that is not sustainable if rates remain elevated and income growth slows.
The analytical question is whether deterioration in this cohort can become large enough to affect aggregate spending and bank credit losses. At current rates, it has not. But the trend is in the wrong direction, and headline data (which captures the full distribution) is showing the resilience of the top cohort more than the fragility of the bottom.
— Nikolai Fainizky, CEO & Senior Analyst, E.R.A. OF CHANGES
The structural risk from the two-speed consumer is not that lower-income households will trigger a recession on their own. It is that aggregate economic data systematically understates the underlying vulnerability because high-income households with substantial equity wealth are disproportionately driving the resilience that shows up in aggregate consumption, confidence, and employment figures.
Fiscal liquidity compounds this. U.S. government deficits have been running at historically elevated levels well into the expansion: the Congressional Budget Office projected the 2026 deficit at approximately 6 percent of GDP as of its spring update. That level of fiscal injection supports household income, corporate revenue, and employment in ways that partially offset the tightening effects of Fed policy. It is one of the primary reasons a 500 basis-point Fed hiking cycle has not produced the recession that prior cycles of similar magnitude almost invariably did.
But fiscal support delays the impact of monetary tightening without eliminating the refinancing mathematics. Zombie companies still face loan maturities. CRE still faces refinancing cliffs. Lower-income consumers still face higher debt service costs. The fiscal buffer buys time. It does not restructure balance sheets.
From U.S. Recession Risk to Global Recession Risk
The United States represents approximately 26 percent of global GDP. A U.S. recession would not produce a global recession automatically, but the transmission channels are sufficiently wide that a meaningful domestic slowdown becomes a meaningful global headwind through several simultaneous paths.
U.S. consumer demand is the largest single engine of global export growth. A domestic demand contraction reduces imports, which reduces export revenue for economies from Germany to Mexico to South Korea whose growth models depend on selling goods to American consumers. Dollar liquidity tightening (which typically accompanies a risk-off environment in a U.S. slowdown) reduces the availability of trade finance and raises funding costs for countries that borrow in dollars. Commodity demand weakening affects exporters from Brazil to Saudi Arabia to Australia disproportionately. Capital flows shift toward safety, which in practice means U.S. Treasuries, draining investment from emerging markets at precisely the moment those economies need it most. For full context on the emerging market transmission, see Emerging Market Investment Risks.
Europe is the most directly exposed major economy after the U.S. The eurozone is already running at weak growth momentum (Germany contracted in 2025), and any significant softening in U.S. demand would reduce both export volumes and the animal spirits that have kept European business investment from contracting further. The European Central Bank’s ability to respond is constrained by inflation that, while declining, has not fully returned to target.
China faces a different set of pressures. Its domestic property sector remains in a multiyear adjustment. Export demand for manufactured goods (the backbone of its growth model) depends directly on American and European consumer spending. Domestic stimulus has partially offset the property deflation, but Beijing’s tolerance for large deficit spending has limits. A U.S. slowdown that reduces Chinese export revenue while the property adjustment is still underway would create a challenging simultaneous pressure in both external and internal demand.
The critical analytical point the outline says to preserve: I am not assigning a numerical probability to a global recession. That would require regional probability estimates that Nikolai has not supplied, and I am not going to invent them. What I can say is that a U.S. recession at the structural severity implied by the refinancing-wall and consumer credit channels described above would almost certainly produce a synchronized global slowdown that met most practical definitions of a global economic contraction.
Three Scenarios for the Next 12 Months
Scenario 1: Growth Scare Contained (Soft Landing)
This is Era’s base case. Initial Jobless Claims remain below 300,000 on a sustained basis. Consumer defaults increase only gradually and stabilize as the lower-income cohort works through elevated delinquency balances. Corporate refinancing continues at elevated but manageable cost, with defaults concentrated in the lowest-quality credit tier but not spreading systemically. CRE distress remains a regional bank problem rather than a systemic crisis. GDP grows in the 1.5 to 2 percent range in 2026 and 2027.
Implication: Volatile equities, sector dispersion between quality growth and leveraged value, a gradual Fed easing path that does not signal emergency, no broad credit crisis. Gold and short-duration quality credit continue to benefit from structural demand. The Era Scenario Planning for Investors framework covers the portfolio implications in detail.
Scenario 2: Standard Recession
Triggered by one or more of the following converging: initial claims crossing 300,000 sustainably, consumer defaults accelerating faster than the current trend line implies, corporate refinancing access deteriorating as high-yield spreads widen above 500 basis points, or CRE defaults beginning to damage regional bank lending capacity in a measurable way. GDP contracts in at least one quarter. The NBER eventually dates the start of a recession to Q4 2026 or Q1 2027.
Implication: Earnings contraction of 15 to 25 percent, equity drawdown of similar magnitude, meaningful Fed rate cuts beginning earlier than the current forward curve implies, defensive sector rotation, higher HY defaults. For the central bank’s response mechanics, see How Central Banks Respond to Recessions.
Scenario 3: Credit-Led Hard Landing
The refinancing wall breaks in a nonlinear way: a cluster of high-profile corporate defaults in Q4 2026 or Q1 2027 triggers a risk-off repricing in credit markets, HY spreads widen sharply, refinancing access deteriorates rapidly for speculative-grade issuers, regional banks with concentrated CRE exposure face meaningful capital pressure, and lending standards tighten sharply across the board. Consumer defaults surge as layoffs accelerate. GDP contracts by 2 to 3 percent or more.
Implication: The Fed responds with emergency rate cuts. Government bond yields compress sharply. Gold and USD benefit from flight-to-safety dynamics. High-yield and leveraged loan markets experience significant spread widening and default spikes. This scenario does not require a geopolitical trigger. It requires only that the refinancing mathematics break in a concentrated and cascading way.
Scenario probabilities beyond the 35–40% headline U.S. recession estimate will be provided when Era’s next quarterly review establishes a scenario split. The headline probability reflects the combined probability of Scenarios 2 and 3.
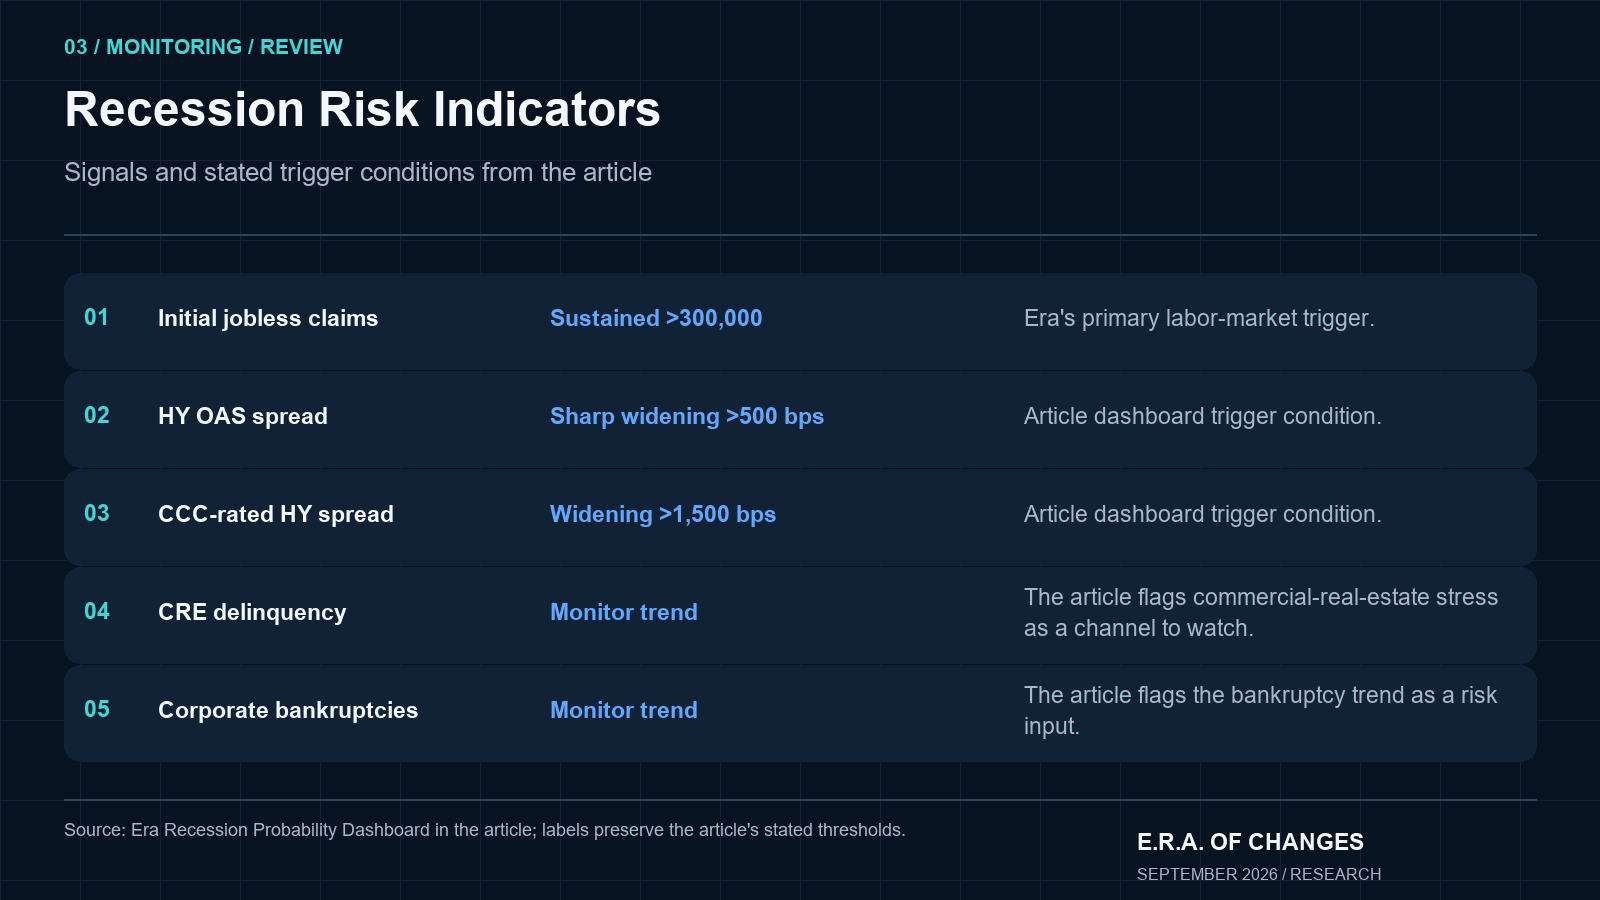
Era Recession Probability Dashboard
Current as of September 19, 2026. Updated with each quarterly report.
Indicator | Current Reading | Era Recession Trigger | Era Status |
|---|---|---|---|
Initial Jobless Claims | 196,000 (week of Sept 12) | Sustained >300,000 | Green |
4-Week Claims Average | ~206,000 | Sustained >300,000 | Green |
HY OAS Spread | ~270 bps | Sharp widening >500 bps | Green |
CCC-Rated HY Spread | ~1,064 bps | Widening >1,500 bps | Amber |
CC Delinquency (30+ day) | 2.85% (Q2 2026) | Accelerating >4% | Amber |
CC Delinquency (90+ day) | 13.12% (Q1 2026) | At 15-year high | Red |
CRE Delinquency (Major Banks) | 4.06% (Q4 2025) | Rising, 7x pre-pandemic | Amber |
Corporate Bankruptcies | 785 in 2025, rising | Third consecutive annual rise | Amber |
Conference Board LEI | -0.1% (Aug 2026) | Reduced weight in framework | Amber |
Legend: Green = Within normal expansion range. Amber = Elevated, requires monitoring. Red = At historically stressed level; not yet triggering recessionary probability revision.
Note: Initial Jobless Claims is the single indicator whose movement above 300,000 on a sustained basis would trigger an immediate revision of this probability estimate. All other indicators inform the overall assessment; this one alone can move the headline number.
What Would Change Era’s Probability Estimate
Signals that would lower the 35–40% estimate toward 20–25%:
A sustained decline in initial claims toward the 175,000 to 185,000 range, demonstrating continued labor market resilience rather than fragility. Real wage growth accelerating meaningfully above inflation for the median worker. Credit-card 90-day delinquency rates stabilizing and reversing. High-yield spreads staying contained below 300 basis points through the fourth quarter. CRE delinquency rates plateauing and beginning to trend down at major banks. Federal Reserve communications signaling a willingness to ease ahead of any labor deterioration.
Signals that would raise the 35–40% estimate toward 55–65%:
Initial Jobless Claims exceeding 300,000 on three or more consecutive weekly readings. Credit-card charge-off rates at major banks accelerating meaningfully above Q2 2026 levels. High-yield spreads widening above 450 basis points as credit markets begin pricing higher default expectations. A cluster of high-profile corporate defaults in Q4 2026 that signals the refinancing wall is breaking rather than being managed. CRE distress beginning to visibly impair the capital ratios of regional banks. Fed communications becoming more urgently dovish in tone, which often signals that officials are seeing deterioration not yet visible in lagged public data.
What a Recession Would Mean for Key Asset Classes
This section is scenario-based, not a recommendation. Asset prices reflect many factors beyond recession probability alone.
Equities in a standard recession typically face 15 to 25 percent earnings compression alongside multiple contraction as forward estimates are revised down. The equity decline in a credit-led hard landing scenario would likely be larger (35 to 50 percent in line with 2008 and 2001 precedents), though the severity depends heavily on the Fed’s response speed.
U.S. Treasuries would benefit in a flight-to-safety scenario, with 10-year yields compressing sharply as the Fed cuts rates. Inflation dynamics complicate this: if recession accompanies persistent service-sector inflation above 3 percent, the Treasury rally would be more constrained than historical recession analogues suggest. For the full interest rate transmission mechanism, see How Do Interest Rates Affect the Stock Market?
Gold benefits from a combination of Fed rate cuts, financial stress, and currency uncertainty that tends to appear during credit-led contractions. It is the asset I regard as most directly positioned for the downside scenario, for the reasons elaborated in the de-dollarization and reserve management work Era has published this year.
Bitcoin and crypto assets face conflicting dynamics. Initial stress phases in a recession tend to produce liquidity-driven selling across risk assets, including crypto. Later phases (after Fed rate cuts begin and financial conditions ease) tend to produce recovery and often outperformance relative to equities for Bitcoin specifically. The cycle analysis is covered in Bitcoin Cycles Explained.
Frequently Asked Questions
What is the probability of a U.S. recession in 2026?
Era estimates a 35 to 40 percent probability over the next 12 months as of September 2026. This is higher than the Goldman Sachs estimate of approximately 30 percent and at the top of the JPMorgan range of approximately 35 percent. Era’s estimate reflects the judgment that distributional consumer weakness and the corporate refinancing wall represent larger structural risks than institutional consensus currently prices.
What is the difference between a growth scare and a recession?
A growth scare is a period of slowing growth, weak sentiment, and compressed financial conditions that does not cross into a self-reinforcing economic contraction. The distinguishing characteristic is whether household credit deteriorates badly enough to damage bank balance sheets, whether corporate refinancing access breaks down, and whether the labor market begins shedding jobs on a broad and sustained basis. In a growth scare, PMI surveys fall and equity multiples compress, but households continue servicing their debts and companies continue accessing refinancing. In a recession, the credit system breaks, and weakness becomes self-reinforcing through the feedback loop between defaults, lending, consumption, and employment.
What indicator would cause Era to change its recession probability?
The single most important trigger is sustained Initial Jobless Claims above 300,000. As of September 12, 2026, claims printed at 196,000, well below that threshold. Secondary triggers include credit-card charge-off acceleration, high-yield spread widening above 450 to 500 basis points, and visible impairment of regional bank capital ratios from CRE losses.
What is the Conference Board Leading Economic Index and why does Era give it less weight?
The LEI is a composite index combining ten leading indicators designed to anticipate turning points in the business cycle. Era assigns it reduced weight because its component structure is heavily weighted toward manufacturing and goods production (including manufacturing new orders, building permits, and industrial hours worked) in an economy where services represent roughly 70 percent of output. This composition produced continuous false positive recession signals from late 2022 through 2024 while the labor market and consumer spending remained intact. Era trusts direct credit and labor market data over the LEI as a primary signal.
Why is the corporate refinancing wall Era’s top structural recession risk?
Because it is arithmetic, not narrative. Debt issued at 2020 and 2021 rates of 3 to 5 percent is maturing in 2026 and 2027. Refinancing that debt at current rates costs materially more in annual interest expense. For companies with thin margins or negative free cash flow (the roughly 2,000 zombie companies estimated to operate in the U.S. public markets), the incremental interest cost can be the difference between solvency and default. S&P 1500 companies alone have $586 billion in debt maturing in 2026. Large corporate bankruptcies hit a 15-year high of 785 in 2025. The wall is operating now.
How does commercial real estate connect to recession risk?
CRE operates on a delayed clock. Loans issued in 2016 to 2021 are maturing in 2026 and 2027. For office properties in particular, the combination of structural vacancy (hybrid work permanently reduced utilization), lower valuations, and higher refinancing rates means many loans cannot be refinanced at their current principal balance without injecting equity. When they cannot be refinanced, defaults follow. Banks, especially regional banks with CRE concentrations, record losses. Lending standards tighten. Credit contraction from that channel can be recessionary even when the headline economy appears healthy.
Is the U.S. consumer in trouble?
At the aggregate level, no. At the distributional level, the bottom half of the income distribution faces measurable stress. The 90-day credit card delinquency rate (13.12 percent in Q1 2026) is the highest since 2010. Pandemic savings that buffered lower-income households through the 2022 and 2023 inflation spike were largely exhausted by mid-2025. Auto loan stress is rising. The aggregate data looks resilient because higher-income households with equity wealth continue spending. The question is whether deterioration in the lower cohort becomes large enough to affect aggregate bank credit losses. Era’s current answer is: not yet.
Why does higher-for-longer matter more than the peak rate?
Because debt must be refinanced at the rate prevailing when it matures, not the rate that was discussed at the Fed’s peak hiking meeting. A company that borrowed in 2021 does not care that the Fed raised to 5.25 to 5.5 percent in 2023. It cares that when its loan matures in 2026, the refinancing rate it faces reflects current conditions, which remain materially above the 2019 to 2021 baseline. The duration of elevated rates determines how much of the corporate, consumer, and real estate debt stock must be refinanced at above-pandemic-baseline rates. The longer rates stay elevated, the larger that share becomes. This is why Era’s primary recession mechanism is refinancing rather than the peak rate itself.
Will there be a global recession in 2026?
Era is not publishing a numerical global recession probability because that would require regional estimates not yet established in our framework. What the analysis supports is the statement that a U.S. recession at the structural severity implied by the refinancing wall and consumer credit channels would very likely produce a synchronized global slowdown through trade, dollar liquidity, commodity demand, and capital flow channels. Europe’s manufacturing sector is already contracting. China’s property adjustment is ongoing. Emerging markets face dollar funding pressure in a risk-off environment. The global margin for error is thin.
How does Era calculate recession probability?
Era combines four categories of indicators in a framework described in detail at Era Forecasting Methodology: labor market conditions (initial claims, payrolls, unemployment), consumer credit health (delinquencies, defaults, charge-offs), corporate credit conditions (high-yield spreads, default rates, refinancing access), and financial system stress (CRE delinquencies, bank lending standards, funding markets). The Era CrisisMeter, updated daily from 24 structural indicators, serves as a real-time systemic stress monitor alongside the quarterly recession probability estimate.
What is the biggest risk to Era’s 35–40% estimate?
That it understates the true probability. The primary reason Era may be underestimating recession risk is that fiscal liquidity (the U.S. running deficits near 6 percent of GDP in an expansion) is masking the deterioration in the marginal consumer’s balance sheet. High asset prices are also supporting aggregate wealth data in ways that disguise the distributional fragility of the bottom 40 to 50 percent of households by income. If the recession, when it comes, is triggered by a sudden deterioration in the consumer credit metrics that are currently masked by fiscal support and asset price effects, it will arrive faster and with less warning than the current probability estimate implies.
How should investors interpret Era’s recession probability?
As a framework for thinking about risk-reward rather than a prediction of a single outcome. A 35 to 40 percent probability means there is a 60 to 65 percent probability of the growth scare resolving without a recession. Investors should calibrate their portfolios for a range of outcomes rather than positioning binary for either a soft landing or a hard one. The Scenario Planning for Investors framework explains how to structure portfolios that remain functional across the probability distribution rather than being optimized for the single most likely case.
About Era of Change
Era of Change is an independent macroeconomic research and geopolitical intelligence firm providing institutional-quality analysis to investors worldwide. Our research combines macroeconomics, financial markets, blockchain analytics, and geopolitical risk into proprietary forecasting frameworks designed to identify structural market trends before they become consensus. The Era Global Risk Index (updated daily from 24 structural indicators) serves as the foundation of our analytical methodology, providing a forward-looking measure of systemic financial stress grounded in structural economic evidence rather than market sentiment. Our full methodology, live index reading, and forecast archive are available at eraperemen.info/en.
The content published by Era of Change is for informational and educational purposes only and does not constitute financial, investment, legal, or tax advice. All views expressed are the personal analytical perspective of the author. Past forecast accuracy does not guarantee future results. Readers should conduct their own research and consult a qualified financial professional before making any investment decisions.
— Nikolai Fainizky, CEO & Senior Analyst, E.R.A. OF CHANGES
Sources
- U.S. Department of Labor: Unemployment Insurance Weekly Claims
- FRED: Initial Jobless Claims (ICSA)
- Verified Investing: Initial Jobless Claims Sept 5, 2026: 206,000
- FRED: ICE BofA US High Yield Index OAS (BAMLH0A0HYM2)
- FRED: ICE BofA CCC & Lower HY Index OAS (BAMLH0A3HYC)
- Federal Reserve Bank of New York: Household Debt Balances Q2 2026
- Federal Reserve Bank of New York: Liberty Street Economics: How Distressed Are Consumers? August 2026
- Credit and Collection News: 13.12% of Balances 90+ Days Delinquent Early 2026
- S&P Global: Corporate Bankruptcy Filings Accelerate in December 2025
- S&P Global: Credit Trends: Global Refinancing Maturity Wall
- Vitti Capital: Refinancing the 2026–27 Maturity Wall
- Alpha Pulse: Corporate Debt 2026: Maturity Wall, AI Boom & Risk
- FDIC: Risk Review 2026
- FRED: Delinquency Rate on CRE Loans, All Commercial Banks
- CRE Daily: Bank Multifamily Delinquencies Hit 13-Year High
- Conference Board: LEI for the U.S. Edged Down in August 2026
- Conference Board: Economic Forecast for the US Economy
- Goldman Sachs: U.S. GDP Growth Projected to Outperform Forecasts in 2026
- Fortune: Goldman Raises Recession Odds to 30% on Higher Inflation, Lower GDP Outlook
- J.P. Morgan Research: Probability of a Recession
- Era Global Risk Index
- Era CrisisMeter Explained
- Era Forecasting Methodology
- How Recessions Are Measured
- How Central Banks Respond to Recessions
- Yield Curve Explained
- How Do Interest Rates Affect the Stock Market?
- Global Debt Risks 2026
- Inflation Forecast 2026: U.S. CPI Outlook
- Emerging Market Investment Risks
- Scenario Planning for Investors
- Bitcoin Cycles Explained
- Mid-Year Market Outlook 2026



