Executive Summary
For most of the post-Bretton Woods era, it was reasonable to treat “global inflation” as a coherent analytical concept. Commodity shocks, synchronized monetary cycles, and deeply integrated supply chains meant that major economies tended to move through inflation regimes in rough parallel. When the Fed tightened, it mattered everywhere. When Chinese manufacturing capacity expanded, it suppressed goods prices globally for a generation.
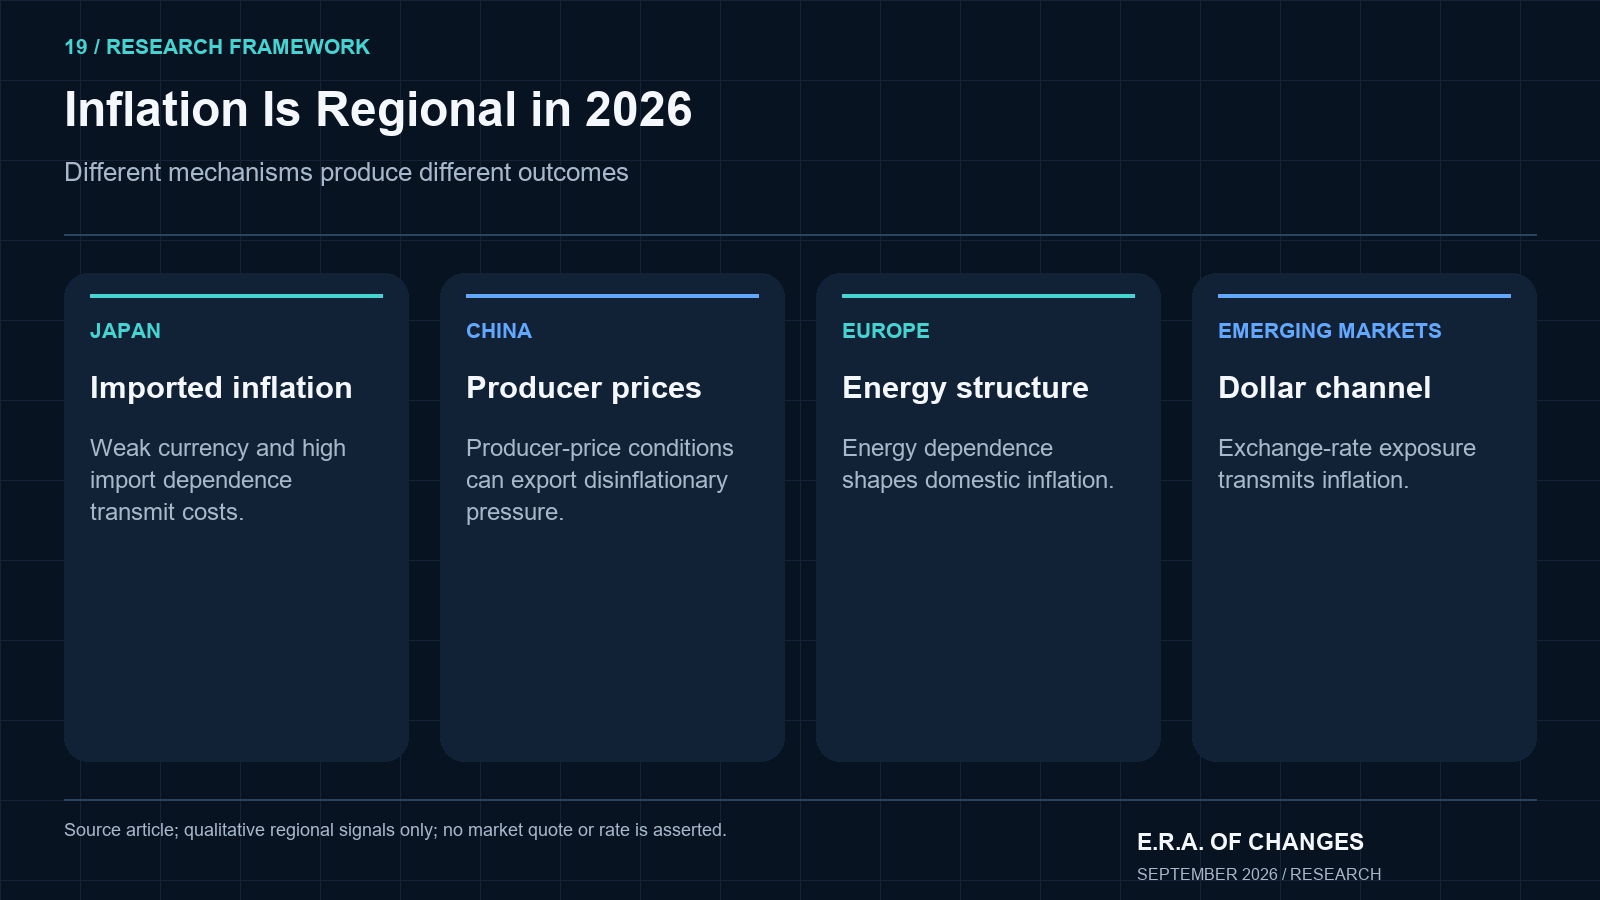
In 2026, that framework requires serious revision. Global inflation is fracturing into regional regimes driven by fundamentally different mechanisms, and the divergence is structural, not temporary. Japan’s Bank of Japan raised rates to 1.25% on September 18, a 31-year high, fighting inflation that is primarily imported through a weak yen rather than driven by domestic excess demand. China presents a mixed price picture in the latest data available as of September 30: August CPI rose 0.8% year-on-year and PPI rose 3.8%, while some producer-goods categories remained in decline. That combination does not support describing current Chinese headline producer prices as deflationary. Europe faces inflation tied primarily to energy dependence and industrial cost structure. Emerging markets absorb inflation through dollar exchange-rate channels that have little to do with their own monetary policy.
Era’s central thesis for 2026: investors who manage global portfolios by tracking Federal Reserve policy as the primary inflation signal are operating with an increasingly incomplete framework. The relevant inflation regime is determined by the macro zone, not by one global policy cycle.
Key Takeaways
- There is no longer one clean synchronized global inflation cycle.
- Japan’s inflation is structurally different from the U.S.: currency-driven imported inflation through a yen trading at 157 to the dollar, with the BOJ at its highest policy rate since 1995.
- China’s latest available August 2026 readings show CPI up 0.8% and PPI up 3.8% year-on-year, alongside declines in some producer-goods categories: a mixed price picture rather than headline PPI deflation.
- Deglobalization and friendshoring are embedding a structural “geopolitical resilience premium” into manufactured goods costs that the world has not yet fully priced.
- Energy fragmentation means the same oil price produces different domestic inflation outcomes in Dallas, Frankfurt, Tokyo, and Jakarta.
- The Fed remains the most important central bank in the world, but tracking it alone cannot explain or predict inflation in a fragmented global economy.
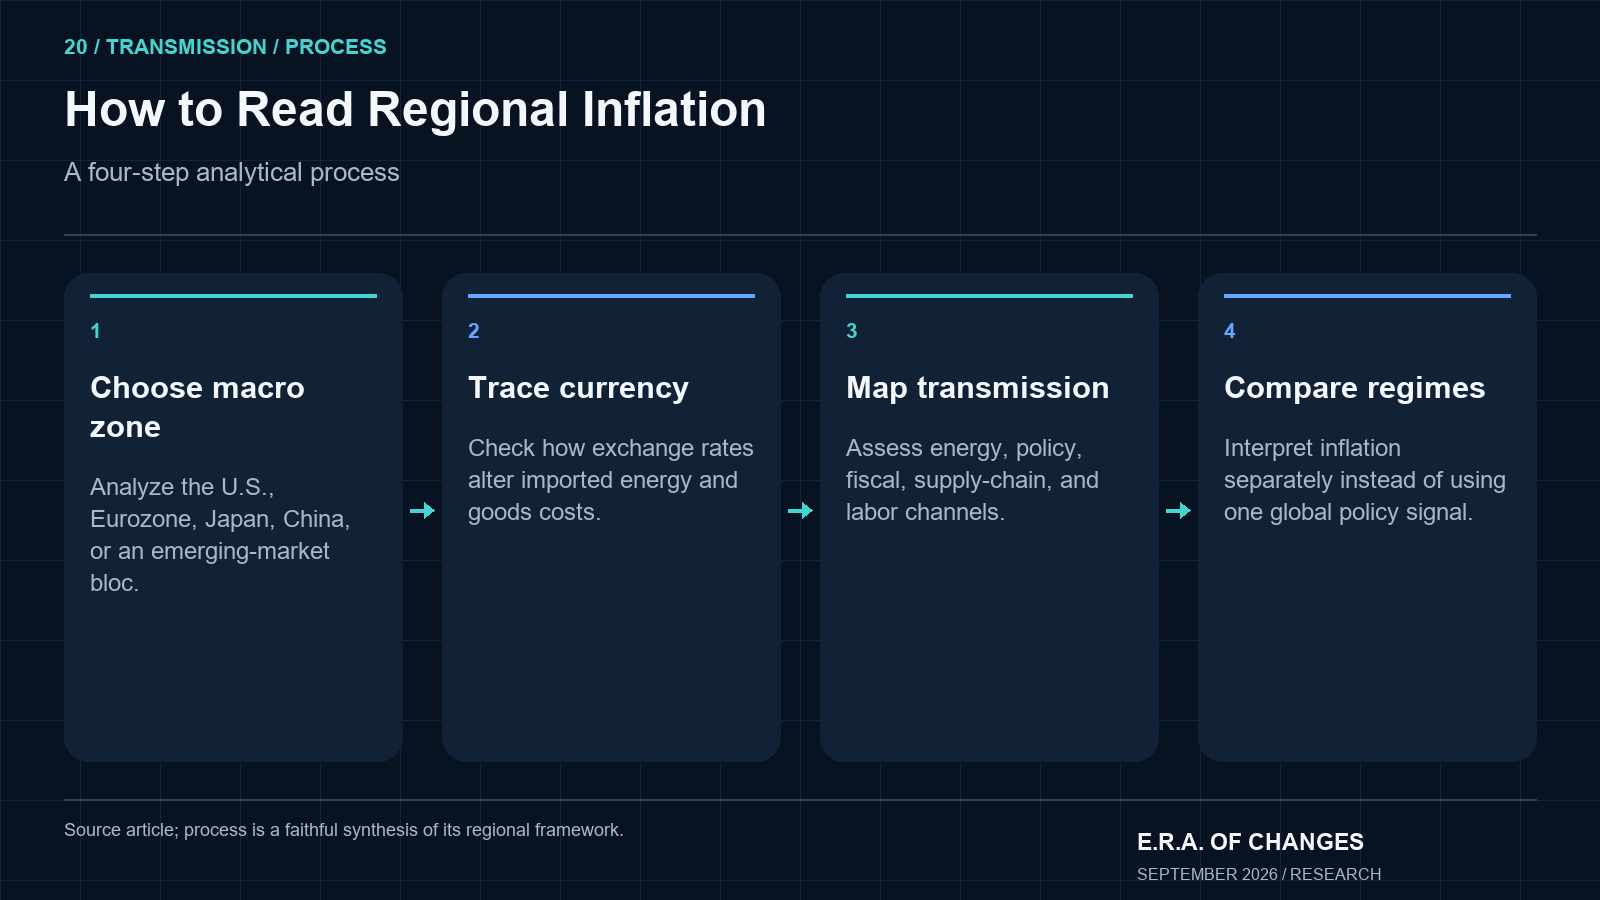
- Investors need to analyze inflation separately across the U.S., Eurozone, Japan, China, and key emerging-market blocs.
The Framework That No Longer Holds
For several decades, investors could build a reasonably reliable mental model of global inflation: global demand rose, commodity prices followed, central banks tightened in broadly coordinated fashion, and inflation returned toward target. The transmission mechanisms were straightforward because the underlying architecture was increasingly integrated: supply chains optimized relentlessly for cost efficiency, capital moved freely across borders, and China’s manufacturing expansion functioned as a permanent disinflationary force in tradeable goods.
That architecture has been unwinding for years. What is different in 2026 is that the consequences are now fully legible in the data. The same international crude price, trading near $85 per barrel in late September, produces materially different domestic inflation outcomes in the United States, Germany, Japan, and Indonesia, because energy production structures, currency dynamics, and pass-through mechanisms differ fundamentally across these economies. The same Federal Reserve rate decision lands differently in an economy running a current account surplus with strong domestic manufacturing than in one financing external deficits in dollar-denominated instruments.
Inflation can be accelerating in Japan while price pressures in China remain mixed, simultaneously, in the same calendar quarter. Understanding what causes inflation at the national level has always required attention to currencies, energy, fiscal structure, and supply chains. What has changed is that analyzing global inflation now requires doing this separately for each major macro zone rather than applying one synchronized framework.
Why Global Inflation Is Diverging: Six Structural Drivers
The divergence is not a temporary aberration. Six structural forces that have been building for years are now expressing themselves simultaneously, and each one operates differently across economies.
Currency divergence is the most immediate mechanism. A weak currency imports inflation through the cost of energy, commodities, and traded goods priced in foreign currency, even when domestic demand is entirely subdued. The yen at 157.26 to the dollar as of September 29, 2026, down 6.3% over the past twelve months, is the clearest current example. A strong dollar, by contrast, can keep imported goods prices lower for the U.S. even when global commodity prices rise.
Energy exposure is the second structural driver. Energy importers and exporters experience the same oil shock through entirely different domestic price mechanisms. The United States, which now produces significant domestic crude, is partially insulated from global price volatility in ways that Japan (which imports approximately 97% of its crude oil) or Germany, which rebuilt its energy import infrastructure after severing Russian pipeline supply, simply cannot replicate.
Monetary policy divergence is the third factor. The Bank of Japan raised its policy rate to 1.25% on September 18, 2026 (the highest level since 1995), while the Federal Reserve sits at a restrictive 3.75–4.00% range. Two central banks running fundamentally different policy postures create fundamentally different domestic financial conditions, exchange-rate dynamics, and credit availability. This is not fine-tuning at the margin; it is a categorical difference in monetary regime. The Fed range was set on September 16, 2026 (FOMC statement).
Fiscal policy is the fourth driver. Government deficits can support household and corporate demand even as central banks tighten, partially offsetting the disinflationary effect of monetary restriction. The U.S. fiscal deficit running at $2.1 trillion for FY2026, or 5.8% of GDP, represents fiscal stimulus that competes directly with the Fed’s restrictive stance. Europe’s fiscal consolidation pressure and Japan’s own fiscal trajectory create different domestic demand paths that produce different inflation outcomes.
Supply-chain fragmentation is the fifth mechanism, and in Era’s view it is the most persistently underestimated. The deliberate redesign of global supply chains toward political alignment rather than cost efficiency (what the policy community calls friendshoring) is embedding what Era calls a “geopolitical resilience premium” into the cost structure of manufactured goods. This is addressed in a dedicated section below.
Domestic labor and services inflation is the sixth and most purely regional driver. Wage dynamics, rental markets, healthcare, and local service prices reflect local labor market conditions, demographic pressure, and productivity trends that differ substantially across economies. Services inflation in the U.S. has proven far stickier than goods inflation precisely because it reflects these local dynamics rather than tradeable global price signals that respond to central-bank tightening.
Japan: The Most Important Inflation Divergence Case
If I had to identify one economy where the old “global inflation” framework fails most completely, I would choose Japan without hesitation.
Japan’s inflation regime in 2026 cannot be understood through the same analytical lens as U.S. or European inflation. Japan’s headline CPI stood at 1.90% year-on-year in August 2026, which sounds moderate by post-pandemic standards. But the mechanism producing that number is entirely different from what drives inflation in the United States, and the distinction matters enormously for how investors should interpret Japanese monetary policy, the yen, and the global leverage implications of BOJ decisions.
Japan imports approximately 97% of its crude oil and roughly 70% of its food. When the yen weakens (and USD/JPY sat at 157.26 as of September 29, down 6.3% against the dollar over the past twelve months), the domestic yen cost of every dollar-priced import rises proportionally. This is not demand-driven inflation. Household spending in Japan is not running hot. The domestic economy is not overheating in any conventional sense. Prices are rising because the currency is weak and Japan’s external energy dependence transmits that weakness directly into import costs. The chain is mechanical: yen weakens, dollar-priced oil and gas cost more in yen, importers raise prices, businesses pass through costs, household purchasing power declines.
The Bank of Japan raised rates to 1.25% at its September 18 meeting (a 7-2 split vote, which itself reflects genuine internal disagreement about the pace of normalization), marking the highest policy rate since 1995. The BOJ explicitly cited yen depreciation, rising crude oil costs, and the pass-through of wage increases into selling prices as the primary inflation drivers. Bloomberg’s survey of BOJ-watchers shows the next hike may come as early as January 2027. Japan is moving, slowly and with visible internal tension, toward monetary policy normalization after three decades of near-zero rates. That transition carries consequences that extend well beyond Japan’s domestic economy.
The Yen Carry Trade and Its Global Leverage Risk
The most important reason global investors need to track Japanese monetary dynamics is not Japanese domestic inflation. It is the yen carry trade and its potential to transmit BOJ policy changes into cross-border deleveraging.
The mechanism is straightforward. For decades, Japan offered the cheapest funding rates in the developed world. Investors could borrow in yen at near-zero rates, convert into higher-yielding currencies (the U.S. dollar, Australian dollar, emerging-market currencies) and deploy those proceeds in higher-returning assets globally. As long as the yen stayed weak and Japanese rates stayed low, the carry was attractive and positions compounded. The estimated stock of yen-funded carry positions runs into hundreds of billions of dollars, though precise measurement is inherently difficult because the trade is distributed across thousands of institutional and hedge-fund strategies.
When the equation changes (when Japanese rates rise and rate differentials with the rest of the world narrow), the unwind can be rapid and disorderly. We saw a partial demonstration of this in August 2024, when a BOJ rate signal combined with a sudden yen strengthening triggered a violent multi-day deleveraging across equities, credit, and emerging-market assets. That event was a warning, not the main event. The current BOJ tightening trajectory, gradual but consistent, creates the conditions for a more sustained carry unwind over the coming twelve to eighteen months if the yen begins strengthening as rate differentials compress. Assets potentially affected include global equities, high-yield credit, emerging-market currencies, and crypto, all of which have shown sensitivity to global liquidity conditions that is partly explained by yen-funded positioning.
I want to be clear about the conditionality here. The size and severity of a carry unwind depends on how much leverage is actually in the system, how quickly the BOJ moves relative to expectations, and whether the yen strengthens sharply or gradually. A gradual, well-telegraphed tightening path gives carry traders time to reduce positions without the forced-selling cascade. What makes the current situation analytically important is not that a violent unwind is certain: it is that the directional exposure is unambiguous, and it connects Japanese monetary policy to global risk assets through a channel that the standard “watch the Fed” framework completely misses.
The Geopolitical Resilience Premium: Deglobalization and Friendshoring
The second structural inflation driver I identified in this analysis is one that receives far less attention than it deserves, probably because it operates slowly and distributes its costs across thousands of individual corporate sourcing decisions rather than appearing in any single economic statistic.
Globalization, at its most efficient, was a massive and sustained cost-reduction machine. Produce where labor is cheapest, ship where infrastructure is best, source where regulatory barriers are lowest. For more than two decades following China’s WTO accession in 2001, this logic put downward pressure on manufactured goods prices and restrained inflation across the developed world. The Chinese manufacturing expansion was an important disinflationary force during that period.
The logic is now reversing. Companies are no longer asking only “where can we produce this most cheaply?” They are asking “where can we produce this such that a geopolitical disruption, a sanctions regime, a shipping route closure, or an adversarial trade policy does not stop our production?” Those are fundamentally different optimization problems, and they do not produce the same answer. The result is friendshoring: the deliberate relocation or expansion of supply chains toward politically aligned or strategically safer jurisdictions, reducing dependence on China and building redundant capacity in Vietnam, Mexico, India, Poland, and domestically in the United States and Europe.
That redundancy has economic value. It also has a direct economic cost. Building a second factory where one previously sufficed raises fixed costs. Maintaining larger inventories as insurance against supply disruption raises working capital. Complying with multiple trade regimes raises administrative costs. Paying higher labor rates in allied economies rather than lowest-cost jurisdictions raises variable costs immediately. Economists estimating full reshoring of critical manufacturing categories have placed the consumer price impact at one to three percentage points in affected sectors. Friendshoring (a partial rather than complete relocation) imposes a smaller premium while delivering superior geopolitical risk diversification, but the cost premium is still positive and measurable.
The CHIPS Act and Inflation Reduction Act in the United States, and equivalent industrial policy initiatives in the European Union and Japan, are deliberately subsidizing precisely this kind of politically motivated, economically suboptimal supply-chain restructuring. The subsidies partially offset the premium for domestic producers. They do not eliminate the premium for the global system. Era’s framing for this force is the “geopolitical resilience premium”: a structural cost embedded in manufactured goods that reflects the price of supply security rather than production efficiency. This premium has not yet worked its way fully through to consumer prices, because supply-chain relocation takes years to execute at scale. It is structural inflation in slow motion.
China: Mixed Price Pressures and Uneven Producer Trends
China is not currently a simple mirror image of Japan. The latest official data available as of September 30, 2026 cover August: consumer prices rose 0.8% year-on-year and 0.4% month-on-month, while the producer price index rose 3.8% year-on-year and 0.4% month-on-month. Core CPI, excluding food and energy, increased 1.0% year-on-year. These readings indicate rising aggregate consumer and producer prices, not current headline deflation.
The aggregate figures also conceal differences among producer categories: producer prices for consumer goods fell 0.5% year-on-year, while prices for processing industries rose 3.1%. Such variation can reflect uneven demand, capacity, and cost conditions across industries, but the reported PPI is a measure of domestic producer prices—not a direct measure of export prices. The current evidence therefore supports a mixed picture, not a claim that China is presently exporting aggregate deflation. See our China Debt Crisis Risk Analysis for Era’s analysis of deleveraging dynamics; it should be read separately from these latest inflation readings.
China’s Mixed Price Signals vs. the West’s Higher Cost Pressures
This is, in my view, the most analytically interesting inflation question of the current cycle, and it is one that most economic commentary has not yet fully articulated.
Two forces can operate simultaneously, pointing in different directions. Western deglobalization, friendshoring, and supply-chain restructuring can raise the structural cost floor for manufactured goods. Meanwhile, China’s August data show rising aggregate producer prices but declines in some producer-goods categories. Whether category-level Chinese price pressure reaches global goods markets depends on actual export pricing, trade flows, exchange rates, and market-specific barriers; domestic PPI alone does not establish that transmission. The inflation outcome is therefore likely to vary across sectors.
Solar equipment, batteries, semiconductors, pharmaceuticals, and defense-related components each have different capacity, trade, and localization dynamics. Chinese production scale may influence international competition in some categories, while Western localization agendas may raise costs in others. The latest aggregate PPI cannot determine which force dominates in a particular export market; that requires category-specific trade and price evidence.
Era’s summary thesis on this structural tension: global inflation in 2026 is increasingly a battle between excess industrial capacity and geopolitical inefficiency. Predicting the net outcome requires sector-by-sector and trade-route-by-trade-route analysis rather than one unified macro framework.
Europe: Energy Dependence and the Stagflation Constraint
Europe’s inflation dynamic deserves its own section because it is structurally distinct from both the U.S. and Japan, and because it represents one of the cleaner structural paths toward a specific outcome investors should monitor.
The Eurozone’s inflation challenge is shaped primarily by energy dependence. LNG from the United States and Qatar has partially replaced Russian pipeline supply since 2022, but at significantly higher cost and with greater logistical exposure to global LNG market conditions and shipping route disruptions. When energy prices rise, European industrial competitiveness is hit simultaneously from multiple angles: higher input costs for energy-intensive manufacturing, higher transport costs, and higher household energy bills that compress real wages and consumer spending even without aggressive monetary tightening.
The combination of rising energy costs and weak domestic demand growth is the structural precondition for stagflation: the scenario where monetary policy offers the least relief, because tightening to fight inflation further suppresses already-weak demand without addressing the supply-side cost pressure driving prices. This is not a prediction for 2026. It is a structural vulnerability that distinguishes Europe’s inflation risk profile from the United States in a way that matters for cross-regional portfolio positioning. The same external shock (an oil price spike, a shipping disruption, a Middle East escalation) lands differently in Frankfurt than in New York because the energy import dependency is structurally different.
Emerging Markets: Where the Dollar Does the Damage
In many emerging economies, the dollar is the inflation mechanism. An economy financing its deficits or its trade in U.S. dollars, with significant dollar-denominated debt on corporate or sovereign balance sheets, experiences dollar strength as a direct domestic inflation driver, because every energy import, every debt-service payment, and every commodity purchase becomes more expensive in local currency terms.
This is why a restrictive Federal Reserve (maintaining high U.S. rates to fight domestic inflation) can paradoxically export inflation to emerging markets even as it suppresses it at home. The dollar strengthens as capital flows toward higher U.S. yields. Emerging-market currencies weaken. Import costs rise. Local central banks face the impossible choice between tightening to defend the currency, risking recession, or easing to support growth and accepting further inflation. For investors managing global exposure, this dynamic reinforces the case for regional analysis over a Fed-centric global framework. Our Emerging Market Investment Risks covers the currency and external debt dimensions of this in detail, including the differential exposure across current account deficit and surplus emerging economies.
Why “Watch the Fed” Is No Longer Enough
I want to be precise about what I am not saying here. The Federal Reserve remains the most systemically important central bank in the world. Fed policy sets the global benchmark for dollar-denominated funding, influences capital flows and emerging-market conditions, and moves through global markets with gravitational force that no other institution matches. Nothing in Era’s framework minimizes this reality.
What I am saying is that Fed policy alone cannot explain inflation in a world where the underlying structural forces are fragmenting by region. An investor who tracks only the federal funds rate and the U.S. CPI print will miss Japan’s monetary normalization and its carry-trade global leverage implications. They will miss China’s mixed consumer and producer price trends, including the contrast between rising aggregate August prices and declines in some producer-goods categories. They will miss Europe’s structural energy vulnerability. They will miss the emerging-market currency dynamics that transmit Fed policy into local inflation through mechanisms often more powerful than domestic monetary decisions. They will miss the slow-moving but structurally significant cost increases embedded in supply-chain restructuring.
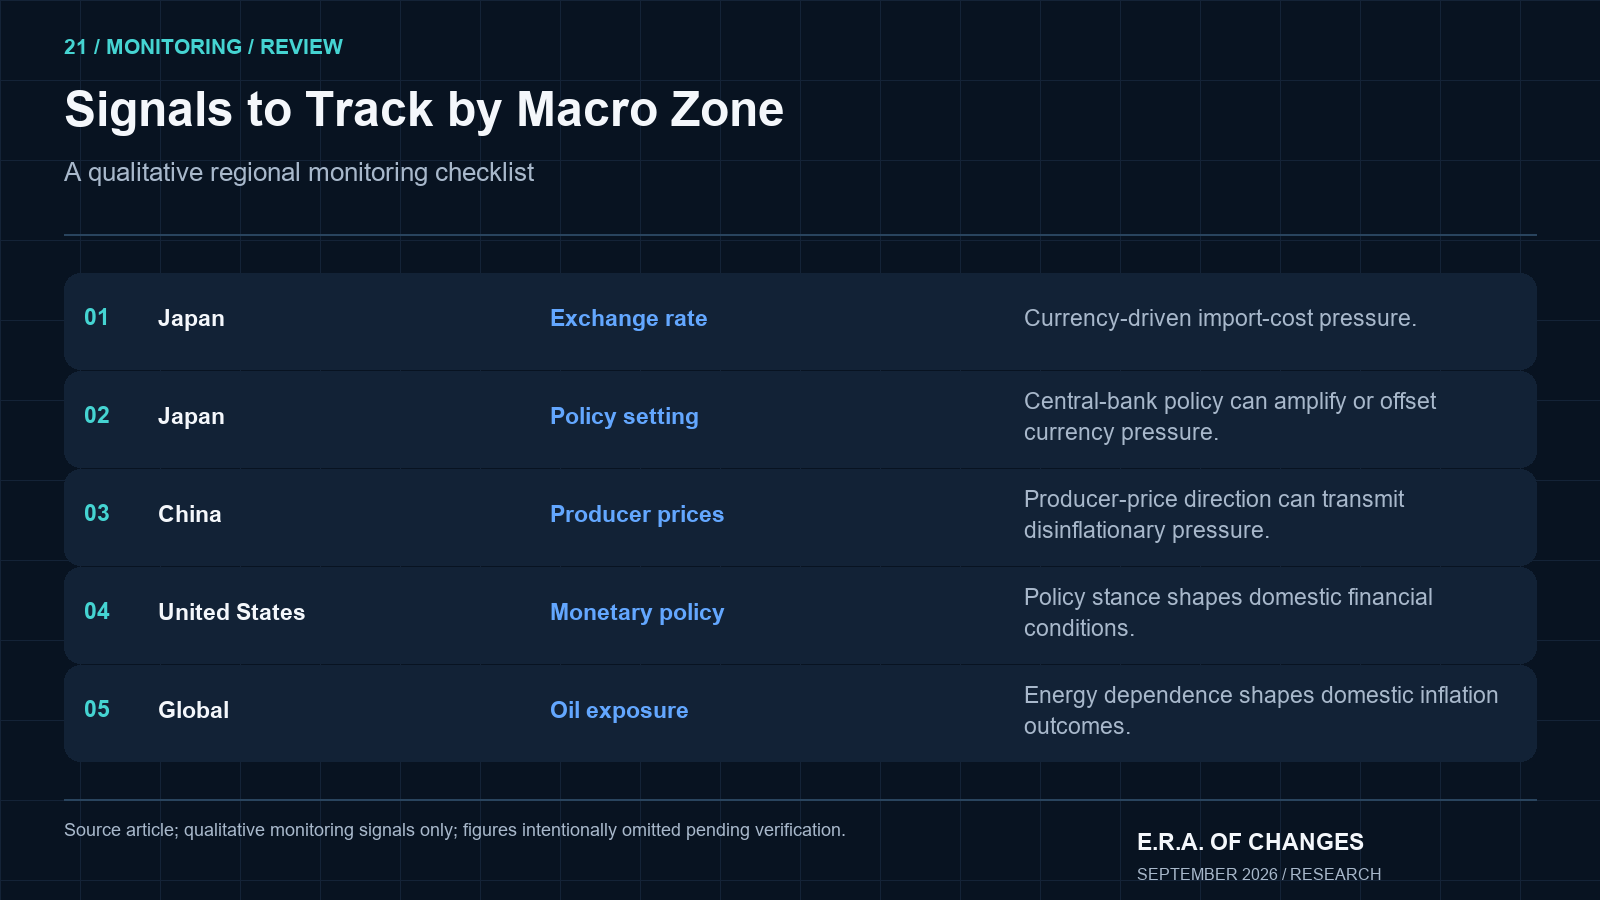
The de-dollarization trend Era has tracked across four months of published research is itself partly a response to this fragmentation: central banks are diversifying reserves partly because the dollar-centric framework no longer maps cleanly onto the reality of regional economic blocs, regional monetary regimes, and regional energy systems operating with increasing independence. The relevant inflation regime is determined by the macro zone. That requires monitoring the ECB, the BOJ, the PBOC, and key emerging-market central banks (alongside currencies, energy pricing, trade policy, and fiscal conditions in each region) in addition to the Fed.
Era’s Regional Inflation Driver Matrix
Region | Primary Inflation Drivers | Current Trend | Key Risk |
|---|---|---|---|
United States | Services, wages, housing, fiscal demand, real rates | Slowly decelerating | Fiscal dominance re-accelerates core CPI |
Eurozone | Energy imports, wages, industrial costs, fiscal consolidation | Sticky, energy-sensitive | Energy shock triggers stagflation pathway |
Japan | Yen weakness, imported energy, wages, BOJ normalization | Rising (CPI 1.90% Aug 2026, imported) | Yen carry unwind transmits globally |
China | Consumer and producer prices rising overall; declines in some producer-goods categories | Mixed price pressures | Domestic PPI does not by itself establish export-price transmission |
Emerging Markets | FX depreciation, food, energy imports, dollar debt, capital outflows | Divergent by country | Strong dollar → currency crisis pathway |
Era’s Global Inflation Dashboard (September 2026; China data through August)
Region | CPI Trend | Currency | Energy Risk | Wage Pressure | Policy Bias |
|---|---|---|---|---|---|
United States | Slowly Falling | Strong | Lower (domestic production) | Moderate | Restrictive (3.75–4.00%) |
Eurozone | 3.2% Aug 2026 y/y (final) | Moderately Weak | High (LNG-dependent) | Rising | Restrictive (deposit rate 2.50% from Sep 16) |
Japan | Rising, imported | Weak (−6.3% YoY vs. USD) | Very High (97% crude import-dependent) | Rising, wages passing through | Tightening (1.25%, 31-year high) |
China | Rising (Aug CPI +0.8%, PPI +3.8% y/y); core CPI +1.0% y/y | Managed | Moderate | Flat | Easing |
Key EMs | Divergent | Mostly Weak vs. Dollar | High (importers) | Varies | Mixed |
Goods Inflation vs. Services Inflation: The Divergence Within Economies
Even within a single national economy, the inflation story now runs in two separate tracks, and they respond to monetary policy on different timescales.
Goods inflation is exposed to supply chains, commodity prices, freight costs, tariff regimes, and international pricing, including Chinese export prices. When global supply chains healed after the post-COVID disruptions, goods inflation in the U.S. fell sharply (from above 9% at the peak toward near-zero) because the underlying cost pressures were largely external and temporary. Goods prices can be affected by both sides of the China tension described above: tariffs raise the cost of some imports, while reshoring raises the cost of domestically produced alternatives. China’s aggregate domestic PPI should not be treated as a proxy for its export prices.
Services inflation reflects wages, rents, healthcare, and local demand. It is driven by labor market tightness, demographic trends, and household spending capacity rather than global supply chains. Services inflation has proven significantly stickier than goods inflation in the U.S. precisely because it reflects local conditions that do not respond quickly to interest rate policy. A rate hike can slow mortgage lending and cool asset prices; it cannot directly compress the cost of a hospital visit, a haircut, or an insurance premium. The implication: falling goods inflation can coexist with persistent services inflation, producing an aggregate CPI that looks benign while the composition remains inflationary for the sectors and assets most exposed to services costs.
Structural Inflation vs. Cyclical Inflation: Why the Floor Is Higher
One of the most analytically important distinctions in the current environment is between cyclical inflation and structural inflation, and specifically the question of whether deglobalization and demographic pressure are raising the structural floor beneath the cyclical trough.
Cyclical inflation responds to the business cycle: demand rises, inventories tighten, prices rise; demand falls, inventories build, prices fall. Central banks manage this cycle reasonably well, which is why inflation declined from its 2022 peaks as the Fed tightened. That was primarily cyclical inflation responding to cyclical tightening.
Structural inflation is driven by longer-duration forces: demographic shifts shrinking the working-age labor supply, energy transition investments that require enormous capital before delivering cost savings, defense spending increases driven by geopolitical fragmentation, and industrial policy mandates that deliberately prioritize security over economic efficiency. None of these respond to a rate hike. They are the reasons Era believes the underlying inflation floor in 2026 is meaningfully higher than the pre-pandemic era, even when cyclical forces are producing disinflation at the headline level. The M2 money supply dynamics underlying the current cycle further support this structural case: the monetary base expansion of 2020-2022 does not simply reverse because rates have risen.
Era Analyst’s Perspective
The August 2026 Chinese data complicate the earlier deflation-export framing: both headline CPI and PPI rose year-on-year, even as selected producer-goods prices remained lower. The separate structural argument is that tariffs, trade restrictions, and supply-chain localization can raise costs for Western buyers or redirect sourcing. Whether those policies outweigh price competition from Chinese suppliers must be assessed with market-specific import-price and trade data; it cannot be inferred from China’s aggregate PPI. The geopolitical resilience premium remains Era’s interpretation of those supply-chain costs, not a measured component of a single CPI release.
Three Global Inflation Scenarios for the Remainder of 2026
The structural forces above do not resolve into one forecast. They create a genuine range of plausible outcomes depending on how specific triggers develop. No probabilities are assigned.
Scenario 1: Continued Regional Divergence
U.S. inflation continues its slow deceleration. Japan remains sensitive to yen dynamics and BOJ signaling. China’s current data show positive headline CPI and PPI inflation alongside declines in some producer-goods categories; the mix may continue to vary by sector. Europe remains sticky but not re-accelerating. Emerging markets diverge by country depending on dollar strength and commodity exposure. No synchronization occurs in either direction; global inflation averages become less analytically meaningful as regional outcomes continue to diverge. This is the scenario in which regional analysis is most valuable and Fed-centric global frameworks are most misleading.
Scenario 2: Renewed Global Inflation Shock
A supply-side trigger creates temporary re-synchronization: a sustained Strait of Hormuz disruption, a Red Sea shipping spike re-running 2024’s freight cost surge, a significant OPEC+ supply reduction, or a currency crisis in a systemically important emerging economy. These shocks transmit broadly: raising energy costs for European and Japanese importers, raising import costs across emerging markets through currency channels, and potentially reaccelerating goods inflation in the U.S. See Top 10 Geopolitical Hotspots in 2026 for the specific geographic risk points Era monitors most closely, including the Hormuz and Red Sea chokepoint risk. The role of economic sanctions in creating and maintaining these chokepoints is addressed in detail in that companion article.
Scenario 3: Global Disinflation/Deflation Shock
A credit event or severe demand contraction overwhelms the structural inflation floor. Chinese price pressures reverse and producer-price declines deepen or spread more broadly as trade barriers erode under economic pressure. Commodity prices fall sharply as global demand weakens. The credit cycle turns down faster than structural forces can sustain the inflation floor; see our Global Recession Probability Report for Era’s current assessment of that risk. This scenario would validate the argument that monetary policy is already too restrictive. It is the scenario least consistent with Era’s structural thesis, but honest risk management requires including it given current credit and labor market signals, and given the history of structural inflation narratives being overwhelmed by cyclical demand shocks.
What Global Inflation Divergence Means for Financial Markets
The fragmentation of the global inflation cycle creates different transmission channels across asset classes that matter for portfolio construction.
For bonds, inflation divergence means real yields differ substantially across developed markets even when nominal yields appear comparable. A Japanese Government Bond at roughly 1.0% nominal yield with 1.90% headline inflation implies a negative real yield. A U.S. Treasury at 4.96% with decelerating but still elevated inflation implies a significantly positive real yield. These are different assets from an inflation-adjusted return perspective, even as the nominal yield gap is narrowing. How interest rate hikes affect markets varies significantly by the real rate context in each jurisdiction.
For equities, persistent services inflation raises discount rates and compresses multiples for long-duration growth stocks even when goods inflation is falling. Pricing-power sectors with direct exposure to commodity pass-through can benefit from certain inflation configurations. Regional equity markets face different cost structures: a European industrial stock carries a different energy-input inflation risk than a U.S. technology company or a Japanese consumer staples name.
For gold, real rates and fiscal confidence are the primary inflation-related variables, more so than headline CPI. Gold at $4,314 as of September 23, 2026, trading at multi-decade highs while 10-year TIPS yields sit at 2.63% (their highest level in approximately eighteen years), is demonstrating that structural central-bank reserve demand and fiscal confidence concerns can override the traditional inverse relationship between real yields and gold pricing. Our Gold Market Outlook 2026 covers this analytical tension in full detail.
What Would Make Era Change the Structural Inflation Thesis?
Era would reconsider the case for a structurally higher inflation floor if friendshoring costs declined faster than expected: for instance, if robotics and AI automation made reshored manufacturing dramatically cheaper within a compressed timeframe rather than over a decade. A sharp AI-driven productivity acceleration reducing unit labor costs across both goods and services sectors could simultaneously undermine the labor-shortage component of services inflation and reduce the cost premium of localized manufacturing. Energy abundance (from a faster-than-expected energy transition, significant expansion of domestic natural gas production, or a sharp fall in global LNG prices) would remove one of the most consistent structural inflation inputs for European and Japanese importers. If regional inflation began genuinely re-converging rather than diverging further, Era’s analytical framework would require updating.
The thesis strengthens if trade barriers increase further, if supply-chain fragmentation accelerates, if defense and industrial spending continues rising as a percentage of GDP across multiple major economies, and if labor shortages persist as demographic headwinds intensify through the 2030s. The current trajectory on most of these variables points toward structural inflation pressure building, not receding.
Common Analytical Errors in Global Inflation Analysis
Treating all inflation as demand-driven misses the supply-side and currency channels that are dominant in Japan and key emerging markets. Assuming one central bank controls the global inflation cycle applies the pre-2019 framework to a world that has structurally changed. Watching CPI without tracking currency dynamics misses the entire imported-inflation mechanism. Ignoring energy geography conflates U.S. energy-exporter dynamics with European or Japanese energy-importer dynamics. Treating friendshoring as cost-neutral ignores the geopolitical resilience premium. Assuming Chinese domestic producer prices directly reveal export-price trends overstates what aggregate PPI can show: China’s August CPI and PPI both rose year-on-year, while some producer-goods categories fell. And confusing disinflation with deflation misidentifies the policy challenge: falling-but-positive inflation and genuinely negative inflation require entirely different responses.
Frequently Asked Questions
What is driving global inflation in 2026?
Global inflation in 2026 is not driven by one mechanism: it is driven by several structural forces operating simultaneously and differently across regions. In the United States, services, wages, housing, and persistent fiscal demand are primary. In Japan, currency depreciation and energy import costs dominate: the yen at 157 to the dollar raises the domestic yen cost of every dollar-priced energy import substantially. In China, the latest available August data show CPI up 0.8% and PPI up 3.8% year-on-year, with core CPI up 1.0%; selected producer-goods categories still declined. In Europe, energy dependence and industrial cost pressure dominate. In emerging markets, dollar strength and external debt dynamics are the primary inflation transmission mechanism.
What are the main global inflation trends?
The overarching trend is regional divergence: major economies are no longer moving through inflation cycles in synchrony. Japan is tightening monetary policy for the first time in thirty years (BOJ at 1.25% as of September 2026). China’s August CPI and PPI were rising year-on-year, though some producer-goods categories remained in decline. The U.S. is decelerating from elevated inflation. Europe faces sticky energy-sensitive inflation. Emerging markets experience currency-driven inflation pressures tied to dollar dynamics. Global averages obscure this divergence rather than illuminating it, and it is the divergence itself that carries the most important implications for investors managing cross-regional portfolios.
Why is inflation different across countries?
Because the structural drivers of inflation differ fundamentally across countries. Currency strength or weakness determines the cost of imported goods and energy. Energy dependence shapes how commodity price movements transmit domestically. Monetary policy timing and aggressiveness differ. Fiscal policy either offsets or amplifies monetary tightening. Supply-chain structure determines exposure to reshoring costs. Labor market tightness and wage dynamics are highly local. All of these variables produce different domestic outcomes even when the external environment is identical, which is the analytical foundation for Era’s regional-divergence thesis.
Why is Japan’s inflation different from U.S. inflation?
Japan’s inflation is predominantly imported: rising because the yen has depreciated and Japan imports nearly all its energy. U.S. inflation is predominantly domestic: driven by services, wages, housing, and fiscal demand. The same nominal CPI rate in Japan and the U.S. represents entirely different economic phenomena and requires entirely different monetary policy responses. The Bank of Japan raised rates to 1.25% in September 2026, its highest level since 1995, specifically to address conditions driving imported inflation: yen weakness, energy cost pass-through, and wages beginning to rise persistently for the first time in decades.
What is imported inflation?
Imported inflation occurs when a country’s domestic price level rises because goods and energy purchased from abroad become more expensive, either because global prices rise or because the domestic currency weakens, raising the local-currency cost of foreign-priced imports. Japan is the clearest example in 2026: a weaker yen means that dollar-priced oil, gas, and food cost more in yen even when global commodity prices are stable. The inflation is transmitted from outside through the currency and import basket, not generated by domestic excess demand.
What is friendshoring?
Friendshoring is the deliberate relocation of supply chains toward countries considered politically aligned or strategically safe, reducing dependence on potential adversaries or geopolitically exposed jurisdictions. The explicit economic tradeoff: friendshored supply chains are typically more expensive than lowest-cost alternatives. Economists estimate comprehensive manufacturing reshoring adds one to three percentage points to consumer prices in affected product categories. This is what Era calls the “geopolitical resilience premium”: a structural cost embedded in goods prices that reflects the price of supply security rather than production efficiency.
Does deglobalization increase inflation?
Deglobalization creates structural upward pressure on goods prices by replacing cost-optimized global supply chains with resilience-optimized regional ones. This is not necessarily permanent: over time, new factories scale, automation reduces labor costs, and new suppliers compete. But the initial phase of supply-chain restructuring is more expensive than the prior system. Tariffs and trade restrictions can alter the prices Western consumers face, but the August 2026 Chinese PPI increase does not establish a current deflationary export trend or quantify its effect abroad. The deglobalization effect on goods prices may therefore be inflationary at the structural margin even when cyclical goods-price inflation is subdued.
How does the yen carry trade affect global markets?
The yen carry trade involves borrowing in yen at Japan’s historically low rates and investing those funds in higher-yielding assets globally. When Japanese monetary conditions tighten (as they are currently, with the BOJ at 1.25% and potentially hiking again in early 2027), the attractiveness of the trade diminishes and investors who have built carry positions may unwind them. The unwind puts selling pressure on the assets those carry positions were funding: global equities, credit, emerging-market currencies, and risk assets broadly. We saw a partial version of this dynamic in August 2024. The current BOJ tightening trajectory creates the conditions for a more sustained, if gradual, version of the same process.
Does China’s latest inflation data show it is exporting deflation?
Not by themselves. The latest official data available as of September 30 cover August 2026: CPI rose 0.8% year-on-year, core CPI rose 1.0%, and PPI rose 3.8%. Some producer-goods categories still recorded declines, including consumer goods at -0.5% year-on-year, while processing industries rose 3.1%. These domestic producer-price figures do not directly measure export prices or prove how Chinese prices affect foreign consumers. Assessing that transmission requires export-price, trade, and market-specific evidence. A future reversal or broader producer-price decline remains a possible scenario, not the current headline reading.
Can AI reduce inflation?
Potentially, over a medium- to long-run timeframe. AI-driven automation can reduce unit labor costs in services (the most stubborn inflation component in the current cycle) and improve logistics, capacity planning, and supply-chain optimization in ways that reduce costs across sectors. Era’s gold analysis addresses this scenario directly: AI productivity generating genuine structural disinflation without recession is one of the two conditions that would most credibly undermine the structural case for hard assets. That outcome remains possible but is not Era’s primary case for 2026, given the early stage of broad AI productivity adoption in services at sufficient scale to move aggregate inflation indicators.
Why is watching the Fed alone no longer enough?
Because the forces driving inflation in major economies outside the U.S. (the BOJ’s rate normalization and its yen carry implications, China’s mixed consumer and producer price trends, Europe’s structural energy cost exposure, emerging-market currency channels) are not determined by Federal Reserve policy. An investor managing global portfolio exposure needs to track monetary policy divergence across the Fed, ECB, BOJ, and PBOC; currency dynamics and their transmission to import costs; energy pricing and geopolitical risks to supply routes; and fiscal policy in each major economy. Fed policy remains the single most influential variable in global financial markets. It is no longer sufficient as a standalone global inflation framework.
What indicators should investors monitor for global inflation?
Era’s recommended framework combines CPI and core CPI for major economies separately (not as a global average); currency exchange rates for the yen, euro, and key emerging-market currencies; central-bank policy rates and forward guidance across the Fed, ECB, BOJ, and PBOC; energy prices and LNG market conditions; China’s CPI and PPI by category, while distinguishing domestic producer prices from export prices; and freight rates for supply-chain transmission. CPI alone is the rear-view mirror of macroeconomics: it confirms where prices have been, not where inflation regimes are heading. Combining CPI with leading currency, credit, and commodity signals provides earlier warning of regime shifts. Our Top 5 Macro Indicators Every Investor Should Watch covers Era’s specific monitoring framework in full.
What is the relationship between global inflation trends and gold?
Gold’s relationship to inflation is often oversimplified as an “inflation hedge,” which implies it rises when CPI rises. The relationship is more nuanced and more interesting. Gold’s primary sensitivity is to real interest rates (nominal rates minus inflation expectations) and to fiscal confidence. Gold trading at $4,314 as of September 23, 2026, while 10-year TIPS yields sit at 2.63% (an 18-year high that should theoretically suppress gold), tells investors that central-bank reserve diversification and concerns about sovereign debt sustainability are currently more powerful than the traditional real-rate mechanism. Regional inflation divergence matters for gold specifically because it creates the fiscal and monetary conditions (elevated deficits, currency dilution, sovereign debt pressures) that drive the structural demand for hard assets. Our Gold Market Outlook 2026 covers this in detail.
About E.R.A. OF CHANGES
E.R.A. OF CHANGES is an independent macroeconomic research and geopolitical intelligence firm providing institutional-quality analysis to investors worldwide. Our research combines macroeconomics, financial markets, blockchain analytics, and geopolitical risk into proprietary forecasting frameworks designed to identify structural market trends before they become consensus. The Era Global Risk Index (updated daily from 24 structural indicators) serves as the foundation of our analytical methodology, providing a forward-looking measure of systemic financial stress grounded in structural economic evidence rather than market sentiment. Our full methodology, live index reading, and forecast archive are available at eraperemen.info/en.
The content published by E.R.A. OF CHANGES is for informational and educational purposes only and does not constitute financial, investment, legal, or tax advice. All views expressed are the personal analytical perspective of the author. Past forecast accuracy does not guarantee future results. Readers should conduct their own research and consult a qualified financial professional before making any investment decisions.
Sources
Global Inflation and Macroeconomic Data - IMF: World Economic Outlook - Bank for International Settlements: Quarterly Review - World Bank: Global Economic Prospects - OECD Economic Outlook
Japan - Bank of Japan: September 2026 Monetary Policy Decision (boj.or.jp) - Al Jazeera: Bank of Japan raises rates to 31-year high of 1.25%, September 18, 2026 - CNBC: Bank of Japan raises benchmark rates to highest in 30 years - Bloomberg: BOJ Watchers See Follow-Up Hike by January 2027 - Statistics Bureau of Japan: Consumer Price Index
China (latest available as of September 30, 2026; August release) - National Bureau of Statistics of China: August 2026 Consumer Price Index (English, September 10, 2026) - National Bureau of Statistics of China: Interpretation of August 2026 CPI (Chinese, September 9, 2026) - National Bureau of Statistics of China: August 2026 Producer Price Index (English, September 10, 2026) - People’s Bank of China
United States - Bureau of Labor Statistics: Consumer Price Index - Federal Reserve: FRED Database - Congressional Budget Office: Budget Outlook
Europe - Eurostat: Euro Area Inflation - European Central Bank
Supply Chains and Deglobalization - Bank of America Institute: Reshoring vs. Friendshoring - Schroders’ The 3D Reset: Deglobalization - WTO: Global Trade Statistics - UNCTAD: Trade and Development Report
Energy - International Energy Agency: World Energy Outlook - EIA: U.S. Energy Information Administration - OPEC: Monthly Oil Market Report
Internal Era Research - Inflation Forecast H2 2026: U.S. CPI Outlook - What Causes Inflation? - How Interest Rates Affect Markets - What Is Stagflation? - Emerging Market Investment Risks - De-Dollarization Report - Top 10 Geopolitical Hotspots in 2026 - How Sanctions Affect Global Trade - What Is M2 Money Supply? - Era Forecasting Methodology - Era Global Risk Index - Gold Market Outlook 2026 - Global Recession Probability Report - China Debt Crisis Risk Analysis - Top 5 Macro Indicators Every Investor Should Watch



