.
The defining characteristic of geopolitical risk in 2026 is not that it arrived: it is how quickly it transmitted into commodity prices, shipping costs, and financial market conditions once it did. The Strait of Hormuz, which carries approximately 20 percent of the world’s daily petroleum flows, was effectively restricted following Israeli and U.S. strikes against Iran in late February. The Red Sea resumed disruption in June as Houthi attacks restarted when the Iran-Israel conflict reignited. Ukraine’s Black Sea grain corridor was functionally frozen by Russian strikes in July. India and Pakistan conducted their most significant military exchange since 2019. Chinese coast guard vessels extended patrols into Taiwan’s eastern waters for the first time.These are not scenarios. They are events that happened in the first eight months of this year.
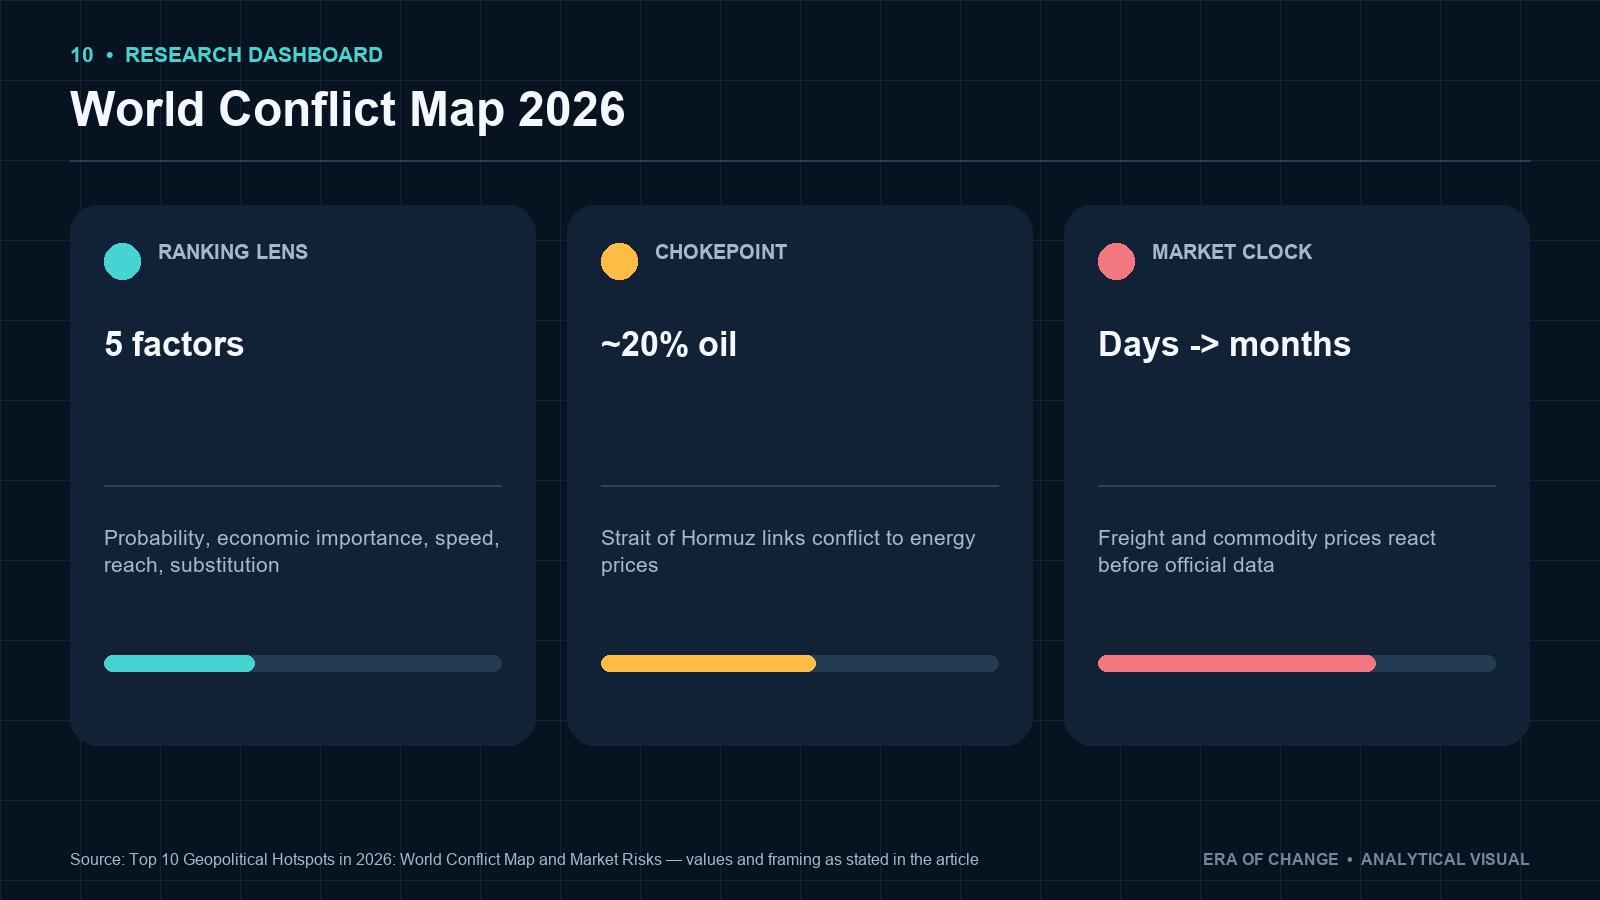
Era’s ranking of geopolitical hotspots follows a five-factor framework: probability of further escalation, economic importance of the affected region, transmission speed into markets, systemic reach beyond the immediate geography, and difficulty of substitution. The result is a list ordered not by political drama but by financial risk: which regions, if they deteriorate, would most rapidly and most deeply affect the markets investors actually hold.
The purpose of this ranking is not to predict wars. It is to identify where a change in conditions could have disproportionate consequences for the global economy and financial markets.
Key Takeaways
- Conventional armed conflict is only one form of geopolitical escalation: gray-zone pressure, infrastructure attacks, and shipping disruption can transmit faster and more deeply into markets than battlefield developments.
- Maritime chokepoints (the Strait of Hormuz, the Red Sea/Bab el-Mandeb, and the Taiwan Strait) represent the single highest-concentration geopolitical risk to global market stability in 2026.
- The Middle East is Era’s highest-probability escalation hotspot over the next 12 months, validated by the Iran-Israel exchange of February–June 2026 and continuing Iranian pressure on Hormuz shipping.
- Taiwan’s more relevant near-term risk may be gray-zone maritime quarantine rather than an immediate full-scale military invasion. Chinese coast guard excursions into Taiwan’s eastern waters increased from a few days per month in 2024 to nine days in June 2026.
- Baltic infrastructure disruption is a recurring rather than episodic risk: at least 11 subsea cables have been damaged or cut in the region since October 2023.
- Freight rates, war-risk insurance premiums, energy futures, vessel routing data, and infrastructure incident reports provide more actionable early signals than political rhetoric.
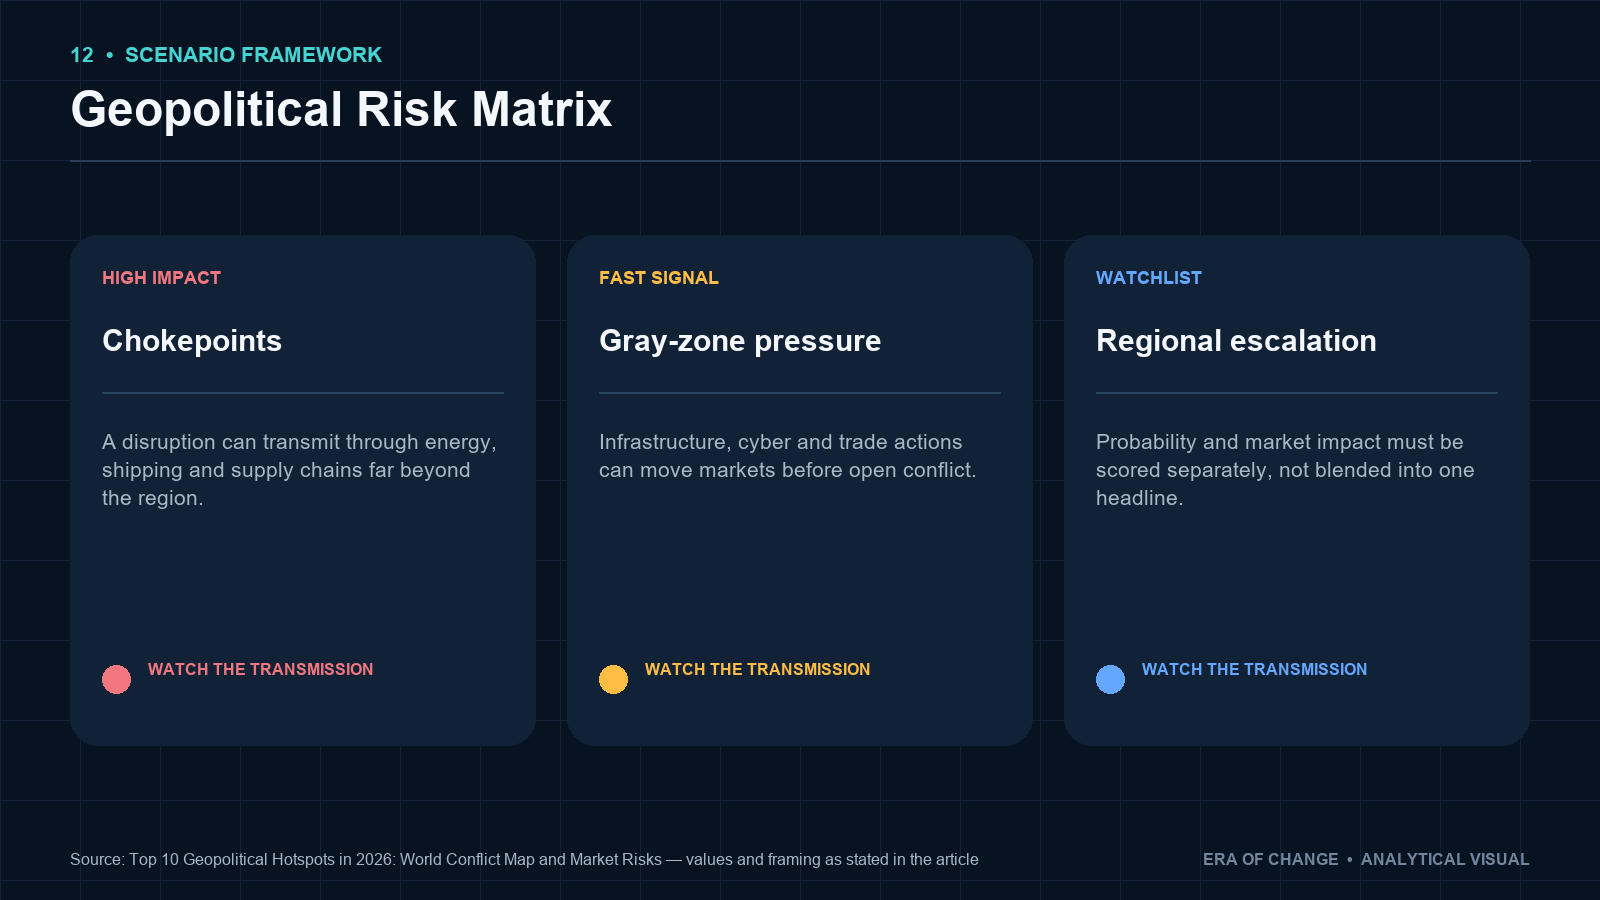
- Investors should separate probability of escalation from magnitude of market impact: some low-probability risks can be catastrophic, while high-probability risks may remain economically contained.
Introduction
Most geopolitical analysis confuses geographic importance with financial relevance. A conflict in a populated country with a large army generates enormous media coverage. Whether it affects oil prices, shipping costs, semiconductor supply, or sovereign credit depends on an entirely different set of variables: the infrastructure involved, the substitutability of what flows through or near it, and whether disruption can be routed around.
The way I think about geopolitical risk at Era is through transmission, not location. I ask not “where is something happening?” but “what happens to markets if it escalates, through what channel, in what timeframe, and how hard is it to bypass?” That question produces a ranking that sometimes diverges from what leads the news cycle, and that divergence is often where the analytical value is.
What made 2026 unusual is how many of the highest-transmission hotspots activated simultaneously. As I write this in August 2026, the Hormuz shipping situation is stabilizing but has not normalized. The Black Sea grain corridor has been functionally shut for weeks. Houthi attacks on Red Sea shipping resumed in June. The India-Pakistan military exchange of May (Operation Sindoor, in which India struck nine sites inside Pakistan) was the most significant cross-border military action between two nuclear-armed neighbors in years. These developments did not emerge from nowhere. They were identifiable from structural indicators months before they reached the news cycle. That is precisely what the Era framework is designed to surface.
How Era Ranks Geopolitical Hotspots
Before presenting the ranking, the methodology matters. Not all geopolitical risks are equivalent, and ranking them by probability alone systematically underweights low-probability catastrophic risks while overweighting high-probability risks that remain economically contained.
Era’s five-factor framework scores each hotspot on the following dimensions:
Probability of escalation measures how likely further deterioration is over the next 12 months, using observable operational indicators rather than diplomatic rhetoric as primary inputs.
Economic importance assesses whether the region or affected infrastructure involves energy, trade corridors, semiconductor supply chains, food production, financial infrastructure, or commodity extraction.
Transmission speed distinguishes how quickly disruption reaches markets: hours for energy and shipping, days for inflation expectations, weeks to months for supply chains and credit conditions.
Systemic reach measures whether consequences would remain regional or spread globally, affecting multiple asset classes and countries simultaneously.
Difficulty of substitution is perhaps the most underweighted variable in conventional analysis: can markets quickly find alternative sources, routes, or technologies if the affected resource or corridor is disrupted? A conflict affecting an easily substitutable commodity is economically different from one affecting a uniquely critical chokepoint.
Era World Conflict Map 2026: Summary Table
| Rank | Hotspot | Era Risk Level | Primary Mechanism | Key Escalation Signal | Principal Markets Exposed |
|---|---|---|---|---|---|
| 1 | Middle East: Iran / Israel / Hormuz | Critical (Active) | Energy infrastructure + maritime chokepoint | Iranian interdiction of Hormuz tankers; Brent risk premium | Crude, LNG, refined products, airlines, inflation |
| 2 | Taiwan Strait | High | Gray-zone maritime quarantine | CCG commercial vessel inspections; eastern waters deployments | Semiconductors, Asian equities, shipping, electronics |
| 3 | Baltic Corridor | High | Hybrid infrastructure attacks | Subsea cable/pipeline incidents; GPS jamming expansion | European energy, telecoms, insurance, defense |
| 4 | Red Sea / Bab el-Mandeb | High (Active) | Asymmetric drone/mine warfare | SCFI/FBX freight rates; war-risk insurance premiums | Container shipping, European input costs, retail margins |
| 5 | Ukraine / Black Sea | High (Active) | Maritime blockade of grain and energy | Shipping suspended; grain corridor closed | Wheat, corn, Black Sea shipping, European sovereign risk |
| 6 | India–Pakistan | High (Contained, monitoring) | Cross-border military exchange | Nuclear signaling; air base strikes | INR/PKR, regional equities, South Asian trade flows |
| 7 | South China Sea | Medium-High | Maritime confrontation + US treaty activation | State-to-state vessel collision; US treaty response | Asian shipping, ASEAN equities, energy, insurance |
| 8 | Korean Peninsula | Medium | Nuclear/missile signaling; DPRK provocations | Missile tests above Japan/Pacific; allied force deployments | KRW, KOSPI, semiconductors, risk sentiment |
| 9 | Pakistan–Afghanistan | Medium | Cross-border escalation; state instability | Border closure; military exchanges | Regional trade, sovereign risk, China infrastructure exposure |
| 10 | Sahel / West Africa | Medium | Security fragmentation + resource disruption | Insurgent territorial gains; commodity corridor closures | Uranium, gold, food commodities, regional sovereign risk |
Scores reflect Era Geopolitical Risk Framework as of August 2026.
#1 – Middle East: Iran, Israel and the Strait of Hormuz
This is the highest-ranking hotspot, and by August 2026 it is no longer a forward-looking scenario: it is a rear-view mirror that shows us exactly what a Hormuz disruption looks like when it happens.
On February 28, Israel and the United States initiated strikes against Iran targeting its nuclear program and ballistic missile infrastructure. By March 4, Iranian forces had declared the Strait of Hormuz closed and began attacking vessels attempting transit. The WTO/AXSMarine tracker records shipment-volume indicators for crude oil and LNG against its January–March 2025 baseline. These are AIS-visible shipments for defined commodity and country coverage, not a complete count of every tanker transit; the tracker warns that vessels with AIS disabled may be missed. The observed disruption remains a serious energy-market risk, but an exact percentage reduction in all tanker traffic should not be inferred from these indicators. A memorandum of understanding was signed in June, but Iran has continued to threaten and harass commercial ships in the Strait since the formal agreement, seeking to extract transit fees from vessels using routes it designates. The UAE’s state energy company has estimated that full Hormuz flows will not resume until 2027.
What this tells me is that the risk I had placed at the top of this list as a forward scenario is now, in practice, a partially realized scenario, and the residual risk is that the current unstable equilibrium breaks again. The MoU of June 2026 is not a peace agreement. It is a ceasefire with enforcement ambiguities. Iranian domestic politics are volatile following the leadership change. Hezbollah’s posture in Lebanon has shifted. And the regional incentive structure that produced the February escalation has not been fundamentally altered.
The key escalation indicators I continue to watch are the physical transit rate through Hormuz (the floor of what’s currently moving) alongside the Brent geopolitical risk premium relative to forward contracts, real-time maritime insurance rates for Gulf routes, and any military deployment activity in or near the Kharg Island oil terminal off Iran’s southwestern coast. Kharg handles roughly 90 percent of Iran’s oil exports. An attack on it, or a credible threat of one, would immediately reprice energy markets globally.
For investors, the exposure is not limited to energy. Airlines with Middle East route exposure, petrochemical manufacturers dependent on Persian Gulf feedstocks, European energy utilities running on LNG supply that was temporarily disrupted: these were all affected during the peak disruption window. The transmission from maritime closure to consumer inflation in energy-importing economies can operate within weeks.
#2 – Taiwan Strait: The Gray Zone That’s Already Moving
The public debate about Taiwan tends to center on one question: will China invade? I find that question somewhat less useful than the one it crowds out: what is already happening, and what does it tell us about where things are going?
The answer, as of August 2026, is that China’s gray-zone campaign around Taiwan has shifted meaningfully. Chinese coast guard vessels began conducting patrols in Taiwan’s eastern waters (not just the strait between the island and mainland China, but the Pacific-facing side) in a pattern that increased from a few days per month in 2024 to as many as nine days in June 2026 alone, according to CommonWealth Magazine’s tracking data. The fleet is not composed only of obvious military vessels. It includes an ecosystem of maritime militia fishing boats, commercial cargo ships operating through opaque ownership structures, sand dredgers, and logistics vessels: all deniable, all posturing as civilian operations, all serving a coordinated strategic function. When these vessels issue demands to commercial ships to change course or accept inspections, the market effect begins before any formal conflict declaration: insurance premiums rise, shipowners adjust routes, shippers hedge.
The key indicator I have defined for Taiwan is not a military mobilization announcement. It is the deployment of Chinese coast guard vessels in commercial sea lanes surrounding the island under a customs or inspections rationale, without formally declaring a military blockade. That action impairs arbitrage. It does not declare war. It simply makes ships uncertain about whether they can reach Taiwan unimpeded. That uncertainty, at scale, is enough to affect semiconductor supply chains, freight routing, and risk premiums across Asian markets.
The transmission from Taiwan gray-zone escalation into global markets would operate primarily through semiconductors, where Taiwan Semiconductor Manufacturing Company’s fabs are responsible for the majority of the world’s advanced chip capacity. Electronics manufacturers (particularly those running just-in-time inventory practices) would face a combination of supply uncertainty and freight disruption that cannot be quickly resolved by geographic diversification. Building equivalent fab capacity in alternative locations requires years and hundreds of billions in capital, not weeks.
The Taiwan Scenario the Media May Be Overpricing
The scenario most financial media models is a large-scale Chinese amphibious assault on Taiwan: a WWII-style landing operation requiring substantial naval and air mobilization, visible for weeks in satellite imagery before the first soldier sets foot on a beach.
I think the more economically relevant near-term scenario is considerably less cinematic. An amphibious assault at scale requires China to absorb catastrophic economic losses (trade sanctions, financial system cutoffs, destruction of technology transfer relationships) alongside the military costs of projecting force across a 100-mile strait against a defended island. The strategic costs of that scenario outweigh the near-term benefits for every planning horizon shorter than multi-decade. China’s leaders understand this.
What does not require that level of commitment is economic strangulation. Maritime inspections that create uncertainty without a formal act of war. Customs enforcement applied selectively to vessels trading with Taiwan. Airspace pressure that raises costs for carriers. Cyberattacks on infrastructure that plausibly deniable actors can claim responsibility for. Financial sanctions applied to Taiwanese firms operating in China. Each of these tools imposes cost without triggering the mutual destruction thresholds that an overt invasion would. The less cinematic scenario (sustained, deniable, incremental pressure) may be both more probable in the near term and, paradoxically, more disruptive to markets than a dramatic attack that might actually accelerate Western economic decoupling from China. For the full context of how political events transmit into financial conditions, see How Political Events Affect Financial Markets.
#3 – Baltic Corridor: The Infrastructure War That Doesn’t Make Front Pages
The Baltic is a different category of geopolitical risk from what most people associate with “conflict.” There are no tank columns. There are no casualty reports. There are vessels (some operating under flags of convenience, some with opaque ownership structures, several later identified as belonging to Russia’s shadow fleet) dragging anchors across fiber-optic cables that link European economies to each other and to the transatlantic internet.
Since October 2023, at least eleven subsea cables in the Baltic Sea have been damaged or cut. On December 31, 2025, Finnish special forces boarded a cargo vessel, the Fitburg, suspected of deliberately dragging its anchor across submarine cables between Finland and Estonia, the latest in a documented series. On February 5, 2026, the European Commission amended the Connecting Europe Facility Digital Work Programme to allocate €347 million to strategic submarine-cable projects and introduced a Cable Security Toolbox. In January 2026, thirteen European nations and Iceland issued a joint warning on GPS jamming and spoofing in Baltic and North Sea shipping lanes, citing threats to maritime safety and global commerce. Source.
The escalation indicators I watch in this region are additional cable incidents, damage to gas interconnectors between Baltic countries, expansion of GPS interference zones into new geographic areas, and any increase in the frequency or scale of port access disruption. The current situation is hybrid warfare operating at a tempo that does not trigger NATO Article 5 thresholds (each incident is individually ambiguous enough to claim as an accident) while systematically degrading the infrastructure that European communication, energy transfer, and maritime navigation depend on.
For markets, the transmission runs from communication disruption and navigation interference into shipping costs, energy pricing, and European risk premiums. Defense spending across NATO’s eastern flank has already accelerated, and the Baltic incidents have been one of the structural factors driving defense sector equity outperformance in 2025-2026. If incidents expand in scale or frequency, the credit spreads on Nordic and Baltic sovereigns would widen.
#4 – Red Sea and Bab el-Mandeb: The Underestimated Risk That Proved Itself
I identified the maritime disruption in the Red Sea and Strait of Hormuz as the most underestimated geopolitical risk going into 2026. The market consensus at the start of the year was that shipping disruption was a temporary inconvenience: a few months of elevated freight rates, some rerouting costs, and then normalization.
The data does not support that view. As of August 2026, Asia-to-Europe container rates remain approximately 25 to 40 percent above pre-crisis levels. Asia-to-U.S. East Coast rates are still 15 to 25 percent above baseline. The Cape of Good Hope routing (the 10-to-14-day longer alternative to the Suez Canal route) remains the default for most major carriers, not an exception. Industry estimates suggest that 5 to 7 percent of global container capacity has been permanently absorbed by longer routes, equivalent to removing 1.3 to 1.8 million TEU from the market. Forecasters who were projecting that diversions would end by mid-2026 are now extending those estimates through at least 2027.
Houthi attacks paused following the October 2025 Gaza ceasefire, then resumed in June 2026 when the Iran-Israel war reignited and Houthi forces aligned their operations with Iranian strategic interests. The shift in the nature of attacks (from targeted missile strikes toward asymmetric drone warfare and threats of maritime mining) represents precisely the escalation from intermittent disruption toward persistent route insecurity that I had described as the more dangerous trajectory.
The physical transmission chain from Red Sea disruption to European inflation is not abstract. When ships reroute around the Cape, fuel consumption per voyage rises by roughly 30 percent for the extra distance. Journey time extends by 10 to 14 days. Cargo insurance premiums incorporate war-risk surcharges for the region. Those costs appear first in freight invoices, then in import prices, then in retailer input costs, then in consumer prices, particularly in European markets where a large share of manufactured goods and components originate in East Asia. The companies I watch for early signals are major container shipping operators: their rate announcements and routing data lead the economic transmission by 6 to 8 weeks.
The key indicators are the Shanghai Containerized Freight Index and the Freightos Baltic Index for rate levels, war-risk insurance premium movements in Lloyd’s of London market data, actual vessel routing from maritime tracking platforms, and confirmed attack reports from the United Kingdom Maritime Trade Operations alerts.
#5 – Ukraine and the Black Sea: The Corridor That Closed Again
The Black Sea grain corridor (the export pathway through which Ukraine moves wheat, corn, and sunflower oil to global markets) was effectively frozen as of July 23, 2026. Russian drone and missile strikes in July alone targeted 57 Ukrainian and foreign-flagged merchant ships in ports and at sea, according to Ukraine’s government. Zero ships were transiting the corridor by late July. Ukraine’s agriculture ministry reduced its 2026-2027 grain export forecast from 43 million metric tons to 38 to 40 million tons, a loss of 3 to 5 million tons during the peak summer harvest export window.
The economic stakes are not limited to grain. Agriculture accounts for more than half of Ukraine’s export earnings: approximately $22 billion in 2025. When the maritime corridor shuts, those earnings disappear. The consequence is fiscal, not just agricultural: Ukraine’s capacity to finance reconstruction and defense spending tightens, which has downstream implications for European sovereign exposure to Ukrainian debt.
For global food markets, the impact is asymmetric. Ukraine’s wheat and corn export losses fall primarily on buyers in North Africa, the Middle East, and parts of Asia: markets that had already absorbed the commodity price shocks of 2022 and 2023. A second significant disruption compounds structural food-security stress in these regions. For European markets, the exposure is more indirect but real: through commodity input costs for food manufacturers and through the European sovereign risk premium on Ukraine-linked contingent liabilities.
The escalation indicator I watch here is whether the mutual targeting pattern (which has now expanded to both sides striking port infrastructure, loading equipment, and vessels) extends to Ukrainian Danube port access, which currently provides a partial alternative to Black Sea corridors. If the Danube route is similarly disrupted, Ukraine’s export capacity approaches near-zero for the autumn season.
#6 – India and Pakistan: Operation Sindoor and What Comes After
On May 6, 2026, India launched Operation Sindoor, striking nine sites in Pakistan and Pakistan-administered Jammu and Kashmir, following a deadly militant attack in Pahalgam, Indian-administered Kashmir. The targets ranged beyond Pakistani-administered territory into Pakistan’s Punjab heartland, and included both militant-organization infrastructure and military installations, including air bases. Pakistan responded with its own military operations. Both sides deployed advanced weapons systems and precision strikes.
This was the most significant military exchange between the two countries since 2019. Both are nuclear-armed. The introduction of domains (cyber, precision strikes, air-base targeting) that had not previously been included in bilateral exchanges raises the escalation threshold and simultaneously reduces the visibility of where each side considers that threshold to be. The situation de-escalated from its acute phase, but the structural tensions that produced it (domestic political dynamics in India, Pakistan’s continued hosting of militant organizations, disputed Kashmir status) have not changed.
The market transmission from an India-Pakistan conflict is primarily regional but has global reach through Indian equity markets, which attract substantial foreign institutional investment; the INR/PKR exchange rates; South Asian trade flows; and, at the tail risk end, any nuclear signaling that would produce a sharp global risk-off repricing across emerging market assets.
The near-term escalation indicator I watch is missile testing and air force deployment data, alongside any credible nuclear signaling from either side. The acute phase of Sindoor appears contained for now, but it demonstrated that kinetic escalation between these two states can move from a triggering incident to coordinated strikes in a matter of days, with very limited warning.
#7 – South China Sea: Three Clashes in One Week
In July 2026, China and the Philippines clashed three times within a single week at Scarborough Shoal and Second Thomas Shoal, prompting joint maritime exercises between the United States, the Philippines, and Japan. A Chinese and Philippine vessel collided near the Spratly Islands. Both sides accused the other of initiating the contact.
The South China Sea is a different risk category from the Taiwan Strait, though both involve Chinese maritime assertiveness. In the South China Sea, the principal counterparty is the Philippines, with which the United States has a mutual defense treaty: the 1951 Mutual Defense Treaty. The escalation risk is therefore not simply a bilateral China-Philippines confrontation but a question of whether an incident rises to the level of triggering U.S. treaty obligations. That question introduces an entirely new escalation pathway.
Approximately $3.4 trillion in global trade transits the South China Sea annually. The shipping lanes connecting East Asian manufacturing to global markets (Europe, North America, Australia) pass through or near the disputed waters. Any sustained disruption to commercial vessel passage would add transit uncertainty to the same supply chains already stressed by Red Sea and Taiwan Strait risks.
The Code of Conduct negotiations that ASEAN foreign ministers described as showing “significant progress” on July 24, 2026 represent a potential de-escalation pathway, but diplomatic processes in this region have a long history of moving slowly while tactical incidents accelerate. I treat diplomatic progress as a lagging indicator rather than a leading one.
#8 – Korean Peninsula: The Underweighted Nuclear Variable
The Korean Peninsula risk is structurally different from most others on this list because the principal escalation vector involves nuclear and ballistic missile capability rather than conventional military confrontation. North Korea’s missile program continued testing in 2025 and early 2026, with trajectories suggesting continued development of intercontinental ballistic missile capacity. Chinese influence on North Korean behavior (historically one of the primary constraints on Pyongyang’s escalation) has been complicated by broader U.S.-China tensions that reduce China’s incentive to act as a regional stabilizer.
The market exposure is primarily through South Korean equities, the Korean won, and the semiconductor and electronics sectors where South Korean companies (Samsung, SK Hynix, POSCO) are systemically important global suppliers. A significant escalation on the Korean Peninsula would also produce a sharp repricing of Japanese assets and a risk-off move across Asian equity markets. The probability of direct kinetic conflict is low relative to most other hotspots on this list. The probability of escalatory missile testing or provocative nuclear signaling is materially higher, and the market reaction to that signaling (even without actual conflict) can be significant in duration and magnitude.
#9 – Pakistan-Afghanistan: The Separate Risk
Pakistan and Afghanistan represent a distinct risk vector from the India-Pakistan axis: one that operates through cross-border military exchanges, insurgent activity, border closures, and the instability of Pakistani domestic politics that the Afghanistan situation amplifies. Current reporting through 2026 documents a sharp deterioration in Pakistan-Afghanistan relations, with Pakistan conducting strikes against positions in Afghanistan and Afghanistan responding with accusations of territorial violation.
The global market exposure to Pakistan-Afghanistan instability is more limited than most hotspots on this list: Pakistan’s equity market and the PKR are the primary financial transmission points. But the risk carries strategic significance as China’s Belt and Road infrastructure investments (particularly the China-Pakistan Economic Corridor) run through Pakistan, giving China a material economic interest in Pakistani stability that affects how Beijing approaches its relationships in the region.
#10 – Sahel and West Africa: Security Fragmentation and Resource Disruption
The Sahel risk is not a single conflict. It is the cumulative effect of security fragmentation across a region that hosts uranium deposits supplying approximately 5 percent of global nuclear power generation, gold mining operations, and oil infrastructure: all against a backdrop of military government expansion, insurgent territorial consolidation, and the exit of Mali, Burkina Faso, and Niger from ECOWAS in January 2024.
Since that exit, market fragmentation has pushed food prices in Sahelian cities up approximately 18 percent since the start of 2026, even as farmers receive lower prices, a compression that reflects collapsing trade infrastructure rather than simple commodity shortage. Nigeria’s government approved the recruitment of 28,000 military personnel in June 2026 to address security deterioration spreading from the Sahel corridor into its northern regions.
The primary global market exposure is through uranium (Niger was the world’s seventh-largest uranium producer before political disruption) and through gold, where West African operations represent significant production for several major mining companies. European governments, particularly France, carry sovereign and political exposure through historical trade relationships, active security commitments, and migration dynamics that the region’s instability affects directly.
The Most Underestimated Geopolitical Risk Is a Chokepoint, Not a Country
Era Analyst’s Perspective
The way most investors think about geopolitical risk is geographic: countries, armies, and borders. The way markets actually experience geopolitical risk is through infrastructure. And the piece of infrastructure that concentrates the most irreplaceable global trade in the smallest geographic space is not any individual country. It is the cluster of maritime chokepoints running from the Persian Gulf through the Arabian Sea to the Red Sea and the Suez Canal.
The Strait of Hormuz is 21 miles wide at its narrowest navigable point. Approximately 20 percent of global petroleum flows through it daily. The WTO/AXSMarine tracker indicates the disruption in observed crude and LNG shipment volumes, using a January–March 2025 baseline and AIS-visible vessel data. Its methodology cautions that AIS-dark transits are not captured, so the tracker is not a complete count of tanker movements. The episode illustrates how a chokepoint disruption can transmit into energy and shipping markets; the precise scale depends on the traffic measure and comparison period. The UAE’s ADNOC has stated that full flows will not resume before 2027, even under the current MoU. This is not a historical example. It is something that happened four months ago.
The Bab el-Mandeb, at the southern end of the Red Sea, is similarly irreplaceable. The alternative (routing container ships around the Cape of Good Hope) adds 10 to 14 days and 30 percent additional fuel cost per voyage. That calculus holds for every voyage, indefinitely, as long as the disruption lasts. The market absorbed this as a “freight rate issue.” I would describe it differently: it is a structural input-cost increase for European goods importers that feeds into corporate margins and consumer prices on a 6-to-12-week lag.
We are now 18 months into Red Sea disruption with no clear normalization timeline. We are 5 months past the peak of the Hormuz crisis with an unstable MoU and continuing Iranian interdiction. These are not tail risks being priced in for the first time. They are structural facts being underweighted because markets have normalized to them. The moment normalcy is questioned (by a new incident, a new escalation, a new sanctions measure), the repricing can be very fast.
How a Shipping Crisis Becomes an Inflation Shock
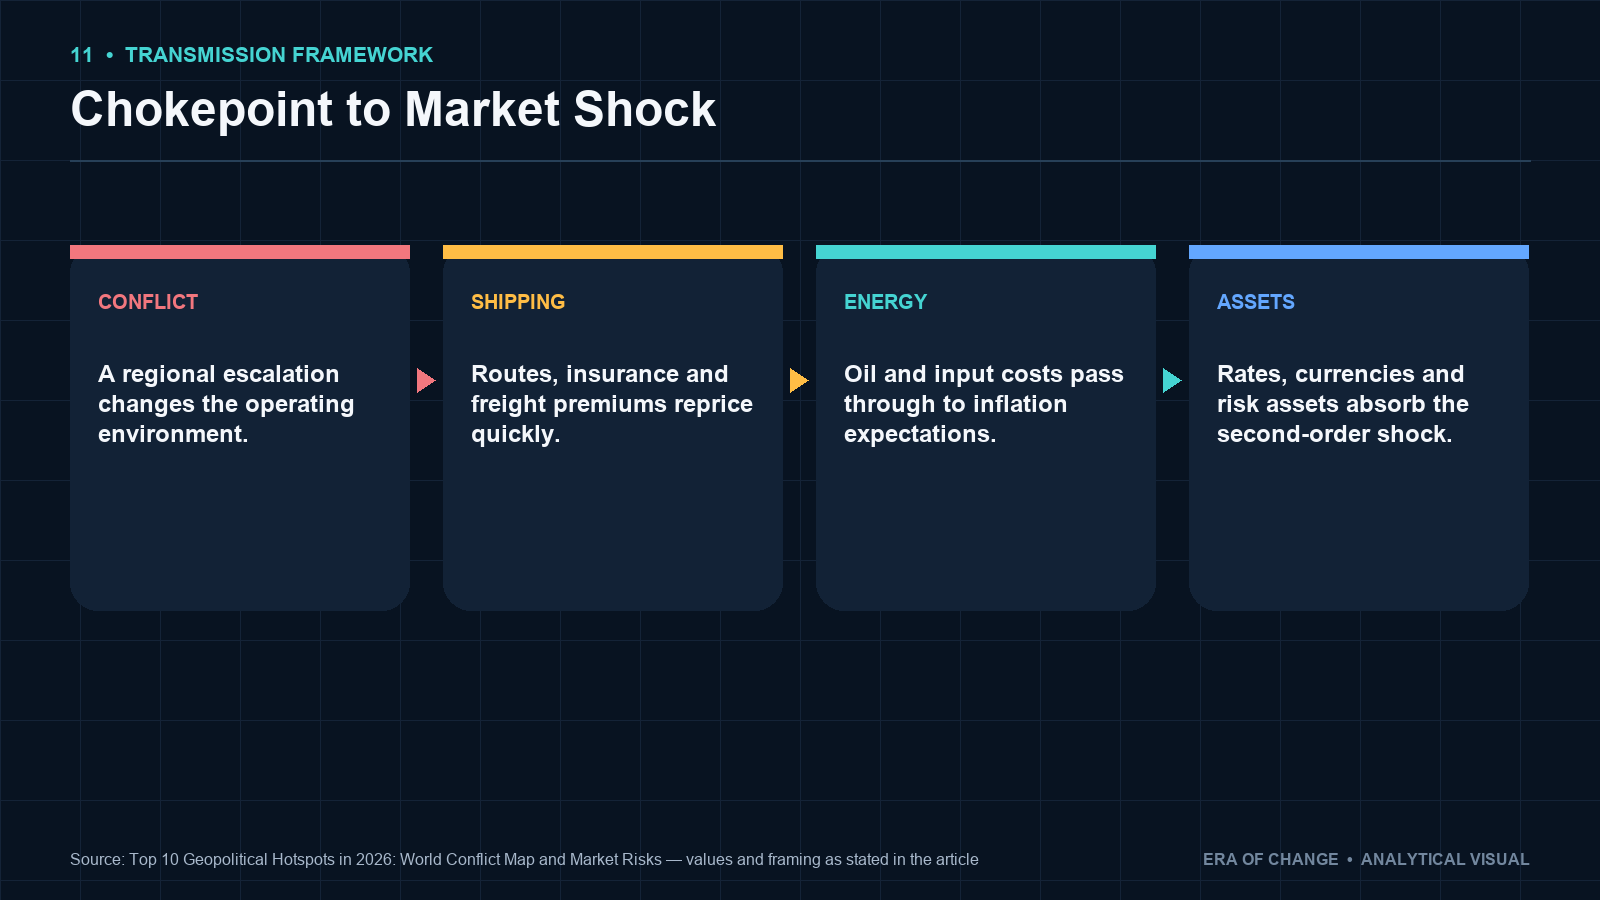
The transmission mechanism from maritime disruption to consumer prices follows a sequence that most market commentary collapses into a single phrase (“supply chain issues”) without explaining the causal chain. The sequence matters because each step carries a different lag, a different magnitude, and a different set of assets that react first.
A drone or mine threat emerges in a critical shipping lane. Within 24 to 48 hours, war-risk insurance premiums for vessels in that zone rise: Lloyd’s of London market rates and specialist marine insurers reprice in real time. Shipping companies, weighing the insurance cost against the route risk, begin rerouting within days. Voyage duration extends. Fuel consumption rises. The available container capacity on shorter routes tightens as ships are occupied for longer on alternative routes. Freight rates rise as available capacity falls. Inventory shipments are delayed. Import costs rise for the receiving economy, typically 6 to 8 weeks after the disruption begins, depending on average voyage lengths. Corporate margins in retail and manufacturing compress, or consumer prices rise, or both. Central banks receive conflicting signals (softer demand alongside renewed input-cost inflation) that constrain their ability to cut rates even as growth weakens.
That final link is the one that matters most for equity and bond investors: a shipping crisis that triggers renewed supply-side inflation is a structural constraint on monetary policy easing. It keeps real rates higher for longer. It extends the period of margin compression. It delays the consumer recovery. For the full framework on how inflation dynamics interact with financial markets, see Inflation Forecast 2026: U.S. CPI Outlook and What Causes Inflation?.
Probability Is Not the Same as Impact
One of the most reliable analytical errors in geopolitical risk is treating probability and impact as a single dimension. A conflict can be highly likely but economically contained. A different conflict can be improbable but catastrophic if it occurs. Conflating the two leads to systematically over-allocating attention to probable-but-contained risks and under-preparing for improbable-but-catastrophic ones.
Era ranks these dimensions separately. A useful framework:
| Lower Market Impact | Higher Market Impact | |
|---|---|---|
| Higher Probability | Frequent regional instability (Sahel, Pakistan-Afghanistan) | Priority hotspots (Middle East, Taiwan, Baltic, Red Sea) |
| Lower Probability | Background monitoring risks (Korean Peninsula nuclear use) | Tail/systemic risks (full Hormuz closure, Taiwan semiconductor supply chain) |
The cell that receives the least analytical attention but deserves the most is the bottom-right: low probability, high market impact. A full and sustained Hormuz closure (not the partial disruption of early 2026 but a months-long shutdown) falls in that cell. A Taiwan gray-zone escalation that disrupts TSMC production capacity falls in that cell. A Baltic infrastructure campaign that takes out a critical European energy interconnector falls in that cell. The probability of any of these is low in any given quarter. The consequences if they materialize are not low at all.
Which Hotspots Matter Most for Financial Markets
| Hotspot | Energy | Trade | Inflation | Technology/Semis | Financial Risk |
|---|---|---|---|---|---|
| Middle East / Hormuz | Critical | High | Critical | Medium | High |
| Taiwan Strait | Low | Critical | High | Critical | Critical |
| Baltic Corridor | High | Medium | Medium | Medium | High |
| Red Sea | Medium | Critical | High | Low | Medium |
| Ukraine / Black Sea | Medium | High | High | Low | Medium |
| India–Pakistan | Low | Medium | Low | Medium | High |
| South China Sea | Medium | High | Medium | Medium | Medium |
| Korean Peninsula | Low | Medium | Medium | High | Medium |
| Pakistan–Afghanistan | Low | Low | Low | Low | Low |
| Sahel / West Africa | Medium | Low | Low | Low | Low |
Which Indicators Should Investors Monitor
Energy: The most actionable leading indicator for Middle East escalation is the Brent crude geopolitical risk premium, the spread between front-month futures and forward contracts that reflects risk beyond supply fundamentals. Regional physical premiums for Gulf Cooperation Council crude, LNG spot prices for Asian delivery, and actual Hormuz transit rates from maritime tracking services all provide earlier signals than political news flow.
Shipping: The Shanghai Containerized Freight Index and the Freightos Baltic Index are the primary rate benchmarks. Vessel routing data from platforms tracking AIS signals shows real-time rerouting decisions before rate increases appear. War-risk insurance premiums from the Lloyd’s market lead rate changes by 24 to 48 hours. Actual delivery time extensions tracked by logistics platforms measure realized disruption rather than sentiment.
Market Risk: The VIX measures fear, not systemic risk, and historically runs late. More actionable signals include credit spreads in high-yield markets (which widen before equity markets price geopolitical stress), gold price movements as a flight-to-safety proxy, dollar funding costs, and sovereign credit spreads on energy-importing emerging markets that are disproportionately exposed to commodity price shocks.
Infrastructure: Cable disruption reports from infrastructure operators and European maritime authorities, pipeline pressure and flow data, GPS interference tracking from aviation and maritime authorities, and port access restriction announcements all provide data ahead of market pricing.
Era Indicators: The Era Global Risk Index synthesizes 24 structural indicators updated daily and includes a dedicated geopolitical-risk component. The Era CrisisMeter provides a forward-looking measure of systemic financial stress. For context on Era’s track record across geopolitical forecasts, see the Forecast Scoreboard: July Review.
Era’s Geopolitical Escalation Framework
The framework Era uses to track escalation follows a five-stage sequence that focuses on observable facts rather than political rhetoric. In order: political tension generates statements and diplomatic signaling; operational preparation produces observable military, logistical, or maritime deployments; physical or economic restriction begins to impair actual flows of goods, energy, or capital; market transmission occurs as asset prices respond to realized or credibly anticipated disruption; and financial system response follows as central banks, sovereign credit markets, and funding conditions adjust to the new environment.
The important principle is that observable changes in logistics, capital flows, military posture, insurance pricing, and market structure matter more than statements. Politicians speak for domestic political purposes. Ships are routed for economic ones. When those two are diverging (when the political tone is conciliatory but the shipping lanes are emptying), the ships are right. For the full methodology behind how Era applies this sequence, see Era Forecasting Methodology.
What Would Change This Ranking
A hotspot should move up in severity if military mobilization visibly accelerates, airspace is restricted or closed, commercial shipping is interdicted in a new geographic area, critical infrastructure attacks increase in frequency, war-risk insurance premiums in the affected region rise, commodity markets begin pricing physical shortages rather than futures risk, sanctions regimes expand in scope, or diplomatic channels collapse without alternative mechanisms.
A hotspot should move down in severity if forces begin visible demobilization, shipping routes normalize as measured by commercial traffic data, formal monitoring agreements with enforcement mechanisms emerge, insurance premiums in the affected region fall materially, physical trade flows return to pre-disruption levels, and diplomatic processes produce verifiable changes in behavior rather than announcements alone.
This ranking is explicitly dynamic. Era updates the assessment when observable indicators shift materially, not on a fixed calendar schedule. The five events I watch most closely for ranking changes over the next 90 days are the pace of Hormuz shipping normalization relative to the June MoU commitments, Chinese coast guard activity intensity in Taiwan’s eastern waters, Baltic infrastructure incident frequency, the India-Pakistan military posture following Operation Sindoor, and the trajectory of Black Sea grain corridor reopening discussions.
For the broader geopolitical risk context in which this ranking sits, see Top 5 Global Geopolitical Risks in 2026, De-Dollarization Report, Global Economic Outlook 2026, and Mid-Year Market Outlook 2026.
Frequently Asked Questions
What are the biggest geopolitical hotspots in 2026?
Era’s ranking places the Middle East (specifically the Iran-Israel-Hormuz axis) as the highest-priority hotspot, followed by the Taiwan Strait, the Baltic critical infrastructure corridor, the Red Sea and Bab el-Mandeb, and Ukraine’s Black Sea grain corridor. These five represent the highest combination of escalation probability, economic importance, transmission speed, and difficulty of substitution. India-Pakistan, the South China Sea, the Korean Peninsula, Pakistan-Afghanistan, and the Sahel complete the top ten.
Where are the world’s major conflicts in 2026?
Active conflicts as of August 2026 include the Russia-Ukraine war (now with a functional Black Sea blockade), the Iran-Israel confrontation (currently under an unstable ceasefire MoU after the February-June escalation), Houthi attacks on Red Sea shipping, the India-Pakistan military exchange following Operation Sindoor in May, ongoing China-Philippines confrontations in the South China Sea, and security fragmentation across the Sahel. The Baltic corridor is experiencing hybrid-warfare infrastructure attacks that do not constitute armed conflict in a formal sense but have measurable economic consequences.
What is a geopolitical hotspot?
A geopolitical hotspot is a region or situation where political, military, or strategic tensions have elevated to a level that creates a meaningful probability of escalation, and where that escalation could have material consequences for economic activity, market pricing, or the supply of key commodities, infrastructure, or trade flows. Not every conflict qualifies. A conflict in a geographically or economically isolated region with easily substitutable resources may receive significant media attention while carrying relatively limited financial risk. A disruption in a critical maritime chokepoint with no viable alternative routes carries high financial risk even if the underlying conflict is small in military scale.
Where can I see a world conflict map?
Era’s World Conflict Map is embedded at the top of this page, presenting all ten hotspots with their risk level, primary mechanism, key escalation signals, and asset exposures. For real-time incident monitoring, the Council on Foreign Relations Global Conflict Tracker and the International Crisis Group CrisisWatch are among the most comprehensive publicly available resources.
Which geopolitical risks are most likely to escalate further?
Based on Era’s five-factor framework as of August 2026, the Middle East remains the highest-probability escalation risk over the next 12 months, with the Hormuz situation in an unstable equilibrium under the June MoU. Taiwan gray-zone activity is accelerating in observable maritime data. Baltic infrastructure incidents have been rising in frequency since October 2023. The India-Pakistan post-Sindoor environment requires close monitoring, as the triggers that produced that exchange have not been structurally resolved.
What is the biggest geopolitical risk to financial markets?
The combination of Hormuz restriction and Red Sea disruption represents the single highest-impact realized geopolitical risk to global financial markets in the current cycle, because it simultaneously affects energy supply, shipping capacity, and import-cost inflation across multiple major economies. The Taiwan Strait represents the largest latent risk: if gray-zone pressure escalates to genuine commercial shipping disruption, the semiconductor supply chain effect would be more severe and harder to substitute than any other scenario on this list.
Could the Taiwan conflict escalate in 2026?
The risk of a sudden large-scale Chinese military invasion of Taiwan within the next 12 months is, in Era’s assessment, lower than the media attention devoted to that scenario would suggest. The more relevant near-term risk is continued escalation of gray-zone pressure (commercial vessel inspections, coast guard deployments in new geographic zones, cyber operations, and incremental economic coercion) that impairs Taiwan’s trade without formally crossing the threshold into armed conflict. Chinese coast guard excursions into Taiwan’s eastern waters increased from a few days per month in 2024 to nine days in June 2026. That trend, if it continues, is the signal to watch.
Why is the Strait of Hormuz important?
The Strait of Hormuz is the world’s most critical maritime chokepoint for energy. Approximately 20 percent of global petroleum and 20 percent of global LNG flows through its 21-mile navigable corridor daily. There is no viable alternative route for Gulf energy exports at anything approaching comparable cost: the only alternative would be massive expansion of pipeline capacity across Saudi Arabia, UAE, or Oman to non-Gulf export terminals, a multi-year and multi-hundred-billion-dollar undertaking. When the Strait is disrupted, the energy markets of Europe, Asia, and North America feel it within days.
Why does the Red Sea matter to global trade?
The Red Sea and Suez Canal together form the shortest maritime route between Asia and Europe. Approximately 12 to 15 percent of global trade by volume transited this route before Houthi attacks began in late 2023. The alternative (the Cape of Good Hope route around the southern tip of Africa) adds 10 to 14 days to the voyage, 30 percent additional fuel cost, and proportionally higher crew, insurance, and port costs. The economic consequence compounds across every voyage, for every carrier, on every affected lane, for as long as the disruption lasts. At 18 months and counting as of August 2026, the cumulative cost has been substantial.
How do geopolitical conflicts affect inflation?
The primary transmission channels are energy and trade. An energy shock from a Middle East or Hormuz disruption raises oil and gas prices globally within days, feeding into transportation and input costs within weeks, and into consumer prices within one to three months depending on the economy’s energy import dependence. A trade disruption from maritime chokepoint closure raises freight costs, extends delivery times, and reduces the effective supply of goods available in receiving markets, producing the specific combination of higher costs and lower output that is most challenging for central banks to address through monetary policy alone.
How should investors monitor geopolitical risk?
The most reliable leading indicators are operational rather than political: vessel routing data, maritime insurance premiums, energy futures curve shape, and infrastructure incident reports all provide earlier signals than official statements or news flow. Era recommends monitoring freight indices (SCFI, FBX), Brent geopolitical risk premium, war-risk insurance rates, and the Era Global Risk Index geopolitical component as a baseline monitoring dashboard. Political rhetoric is a lagging indicator. Shipping companies, insurers, and commodity traders (whose capital is directly at stake) provide more reliable signals than governments, whose statements serve political rather than analytical purposes.
What indicators signal geopolitical escalation?
The indicators that most reliably precede escalation are: sudden movements in physical commodity premiums above futures prices (which indicate local shortage rather than paper hedging); rises in war-risk insurance premiums for specific geographies (which indicate that underwriters with direct financial exposure are recalibrating risk); shifts in maritime vessel routing on AIS tracking data (which indicate that commercial operators are responding to actual rather than perceived risk); and military deployment patterns visible in satellite imagery and defense industry procurement data. Political announcements and media coverage reliably lag these indicators. For the full analytical framework, see Era CrisisMeter Explained and Era Forecasting Methodology.
About E.R.A. OF CHANGES
E.R.A. OF CHANGES is an independent macroeconomic research and geopolitical intelligence firm providing institutional-quality analysis to investors worldwide. Our research combines macroeconomics, financial markets, blockchain analytics, and geopolitical risk into proprietary forecasting frameworks designed to identify structural market trends before they become consensus. The Era Global Risk Index (updated daily from 24 structural indicators) serves as the foundation of our analytical methodology, providing a forward-looking measure of systemic financial stress grounded in structural economic evidence rather than market sentiment. Our full methodology, live index reading, and forecast archive are available at eraperemen.info/en.
The content published by E.R.A. OF CHANGES is for informational and educational purposes only and does not constitute financial, investment, legal, or tax advice. All views expressed are the personal analytical perspective of the author. Past forecast accuracy does not guarantee future results. Readers should conduct their own research and consult a qualified financial professional before making any investment decisions.
Sources
Middle East / Hormuz - 2026 Iran War – Britannica - Israel/US-Iran Conflict 2026: Strait of Hormuz – UK Parliament House of Commons Library - 2026 Strait of Hormuz Campaign – Wikipedia
Red Sea - Red Sea Shipping Disruption 2026: Status & Cost Impact – The Middle East Insider - Red Sea Shipping Crisis 2026: Impact on Your Supply Chain – Suaid Global - Houthi Militia Ceasing Attacks: Impact on Freight Rates – Xeneta
Taiwan Strait - How Taiwan’s First Island Chain Allies Counter China’s Gray-Zone Playbook – CommonWealth Magazine, August 2026 - Why China’s Gray-Zone Campaign Extended to Eastern Taiwan – CommonWealth Magazine, August 2026 - Signals in the Swarm: Data Behind China’s Maritime Gray Zone Campaign – CSIS - China’s Grey-Zone Fleet Is Eroding Taiwan’s Control at Sea – ASPI Strategist
Baltic Corridor - Q2 2026 Undersea Cables Risk Report – Windward AI - Seabed Zero: Baltic Sabotage and Global Risks – Bulletin of the Atomic Scientists, February 2026 - Baltic States on High Alert After Fresh Subsea Cable Damage – Splash247
Ukraine / Black Sea - Russia-Ukraine War: Black Sea Shipping Crisis – Foreign Policy, August 2026 - Russian Strikes Revive Black Sea Blockade – Washington Times, August 2026 - Russia-Ukraine War Disrupting Black Sea Grain – Farm Policy News, August 2026
India–Pakistan - CFR Global Conflict Tracker – India-Pakistan - India-Pakistan Conflict Escalates – CFR
South China Sea - China-Philippines South China Sea Dispute Enters Dangerous Phase – China-Global South Project, August 2026 - Between Talks and Tensions: Why the South China Sea Won’t Stabilise in 2026 – Fulcrum
Sahel / West Africa - Rising Subversion, Chaos & Insecurity in West Africa and the Sahel – ICAIE, August 2026 - IMF Regional Economic Outlook: Sub-Saharan Africa 2026 – IMF
Era Research - Era Global Risk Index - Era CrisisMeter Explained - Era Forecasting Methodology - Top 5 Global Geopolitical Risks in 2026 - How Political Events Affect Financial Markets - De-Dollarization Report - Global Debt Risks 2026 - Mid-Year Market Outlook 2026 - Global Economic Outlook 2026 - Inflation Forecast 2026: U.S. CPI Outlook - Scenario Planning for Investors - Geopolitics Reports



