Executive Summary
July continued Era's commitment to reviewing both successful and unsuccessful forecasts in public, on the same terms. The strongest result this period came from timely capital reallocation, not from a new prediction, the decision not to wait for a fully exhausted move in one position before shifting capital toward instruments with stronger relative upside given where the macro data actually stood. The least accurate assumption we carried into this period was an underestimation of the resilience of the U.S. consumer. Fiscal support and accumulated household liquidity created a spending buffer thicker than what traditional models indicated, and in response we've increased the weight our process assigns to high-frequency transaction and credit-card data specifically.
Two new forecasts were formally published during this review period, and both remain classified as still developing, since their stated horizons run through the end of 2026. Nothing in this report inflates that count. Our methodology continues to perform strongest when evaluating quarterly macroeconomic trends and how inflation transmits into corporate margins. It remains comparatively weaker at forecasting short-term speculative squeeze movements generated by retail flows and information noise: a limitation I'd rather state plainly here than discover the hard way in a future report.
Long-term credibility in this business depends on process improvement and risk-adjusted outcomes, not a claim of perfect accuracy. This report is built around that standard.
Key Takeaways
- July's strongest decision was a timely reallocation of capital toward assets carrying greater relative upside, rather than holding a position past the point of diminishing return.
- Era underestimated the strength and duration of U.S. consumer resilience during this period.
- High-frequency spending and credit-card data will now carry greater weight in future consumer-demand forecasts.
- The framework continues to perform best over quarterly macroeconomic horizons.
- Inflation and corporate-margin analysis remain a core methodological strength.
- Short-term speculative squeezes remain a genuine weaker area for the framework.
- Forecast accuracy must be assessed across the complete published record, not a set of selectively chosen successful calls.
Introduction
Forecasting without public review is commentary. Forecasting with a dated, permanent public record becomes an accountable research process and that distinction is the entire reason this series exists.
July isn't built merely to highlight winning calls. Its purpose is to answer six specific questions honestly: what worked, what didn't, why the difference occurred, which assumptions changed as a result, how the methodology is actually improving, and where the framework remains genuinely unreliable. Every monthly report follows this same evaluation structure specifically so the results stay comparable to each other over time, rather than each report reinventing its own standard of success.
Why Era Publishes a Monthly Forecast Scoreboard
The industry problem this series is built to counter is a familiar one: selective reporting of winning calls, predictions quietly deleted or revised after the fact, deliberately vague language that can be read as correct under almost any outcome, evaluation dates that move once a forecast starts looking wrong, and a persistent confusion between a good market outcome and a genuinely sound forecasting process.
Our standard is that every material forecast carries an original publication date, a defined time horizon, a measurable expected outcome, stated assumptions, explicit invalidation conditions, and a final or current status reviewed publicly, on a fixed schedule, regardless of how the review reflects on us. Forecast transparency is only valuable when unsuccessful calls remain exactly as visible as successful ones. A track record that only shows the wins isn't a track record. It's marketing.
How Forecast Accuracy Is Measured
We use the same five status categories in every report, applied consistently rather than redefined month to month. Correct means the principal direction, time horizon, and core reasoning were substantially accurate. Partially correct means the main direction or structural thesis held, but timing, magnitude, or an important component was wrong. Incorrect means the principal expected outcome did not occur within the stated conditions or horizon. Still developing means the forecast horizon remains open and the outcome genuinely cannot be judged fairly yet. Invalidated means the original assumptions changed enough that the thesis was formally withdrawn before its horizon actually ended.
We do not retroactively change a forecast's wording or its evaluation window to improve how it reads in hindsight. What was published stands as published.
July Forecast Scorecard
Only forecasts that were actually published and dated during this review period appear here. We are not padding this table to make it look fuller than it is, a point I'll return to below.
| Forecast | Original Publication | Forecast Horizon | Expected Outcome | Actual or Current Outcome | Status |
| 2026 Mid-Year Global Outlook | July 2026 | Through December 31, 2026 | U.S. real GDP 1.2%–1.5%; CPI 3.2%–3.5%; Fed holds or cuts once; S&P 500 year-end range 5,400–5,500; CrisisMeter toward 75–80 | Horizon just opened; too early to assess | Still Developing |
| Inflation Forecast H2 2026 | July 2026 | 12 months | U.S. inflation 3.0%–3.8%; eurozone 2.5%–3.2%; China 0.5%–1.5%; Fed rate near 5.00% at year-end | Horizon just opened; too early to assess | Still Developing |
I want to address the obvious question directly: this table is short. Both forecasts published during July carry horizons that extend through year-end, which means neither can be honestly scored as correct or incorrect after only a few weeks. We could have padded this table with shorter-dated sub-calls to make July look more active. We chose not to, because a scorecard that manufactures resolvable-looking entries defeats the entire purpose of publishing one.
July Accuracy Summary
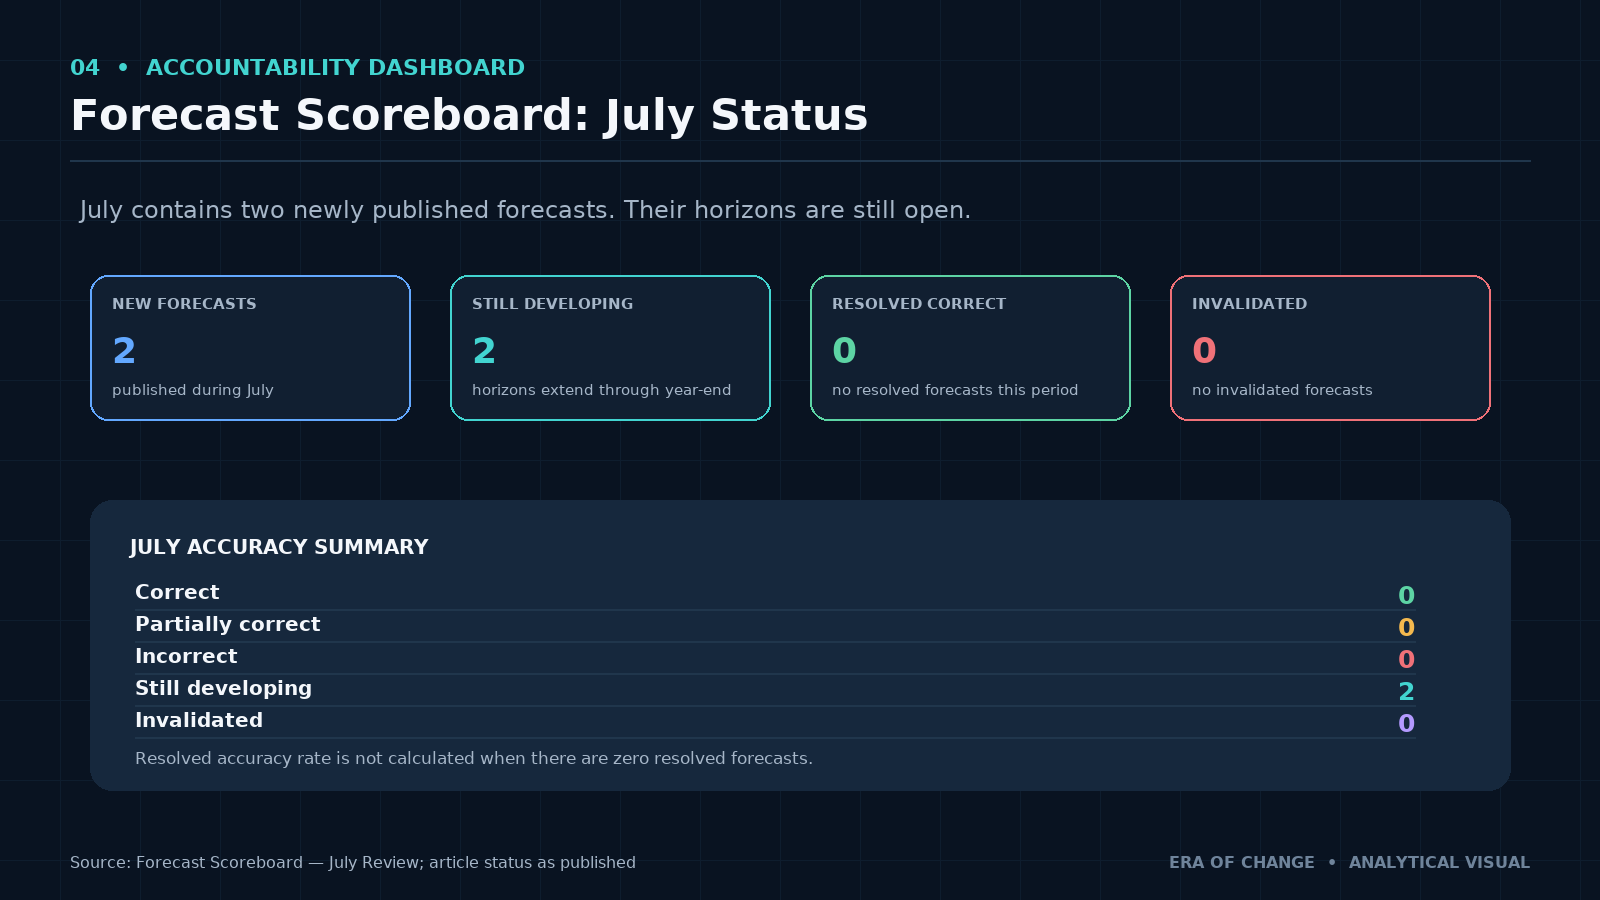
Forecasts newly published this period: 2. Correct: 0. Partially correct: 0. Incorrect: 0. Still developing: 2. Invalidated: 0.
Resolved accuracy rate = Correct forecasts ÷ Total resolved forecasts. With zero resolved forecasts this period, no accuracy percentage is calculable for July in isolation, and we're not going to manufacture one. Where a weighted score is used across a larger sample, correct is scored at 1.0, partially correct at 0.5, and incorrect at 0, the same weighting applied in the June report, held constant here.
Strongest Forecast of the Month: Timely Capital Reallocation
The strongest decision this period wasn't identifying a single asset that would rise indefinitely. It was recognizing when the expected remaining upside in an existing position had become less attractive than the opportunity sitting elsewhere.
The Original Decision
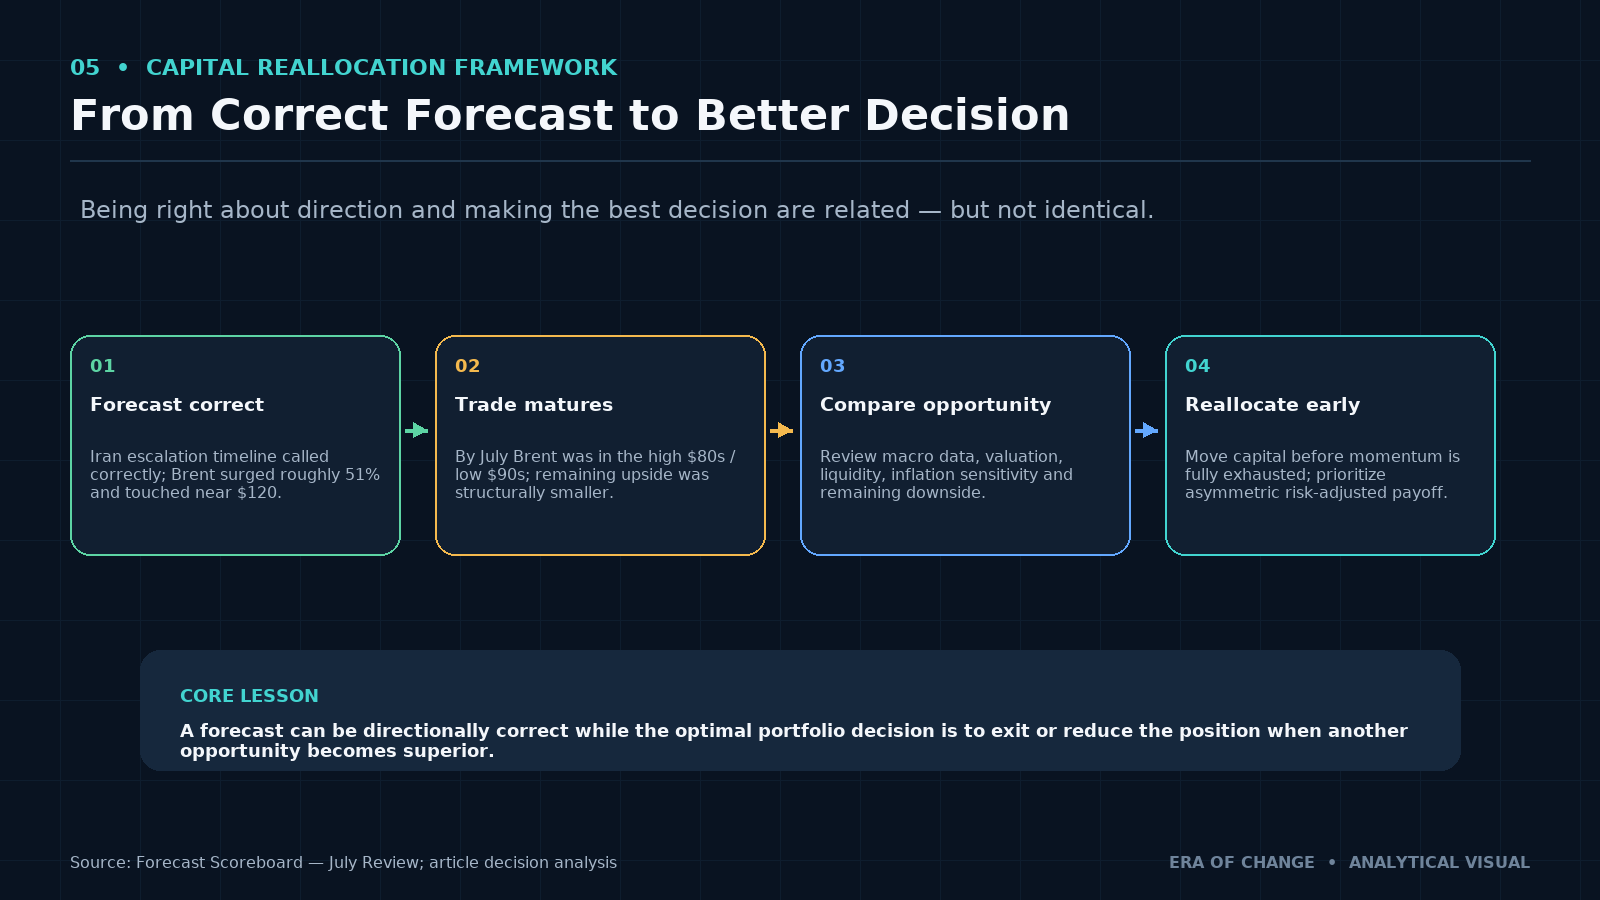
Our June Iran Escalation Timeline forecast was scored correct: we called the timing of full-scale hostilities, and the long-oil, short-S&P-500 position built around that call produced double-digit gains as Brent surged roughly 51% through March, briefly touching close to $120 a barrel. By the time we moved into July, the character of that trade had changed. Brent had already retraced substantially off its March peak: trading through the high $80s and low $90s by July, as the initial shock premium unwound and a ceasefire took hold before renewed regional tensions reintroduced volatility. The remaining upside in holding the original long-oil position at that point was structurally smaller than it had been in March, while liquidity conditions elsewhere in the macro data pointed toward better relative opportunities.
The Analytical Logic
The reallocation decision ran through the same inputs we apply to every position: current macroeconomic data, relative valuation across the alternatives under consideration, prevailing liquidity conditions, inflation sensitivity of each candidate exposure, sector and commodity positioning generally, and, the input that actually drove the decision, how much upside genuinely remained relative to the downside risk of staying put.
Why the Timing Worked
We did not wait to capture the final possible percentage point of upside out of the original oil position. Capital was moved before that sector's momentum was fully exhausted, not after the retracement had already erased the advantage of moving early. The decision prioritized opportunity cost and an asymmetric payoff profile over emotional attachment to a thesis that had already proven correct once, which is precisely the trap that turns a good call into a mediocre outcome if you hold it past its useful life.
What This Demonstrates About the Methodology
The lesson worth generalizing: a forecast can be directionally correct in full, and the optimal portfolio decision can still be to exit or reduce the position when another opportunity offers a genuinely superior risk-reward profile. Being right about direction and making the best decision with that rightness are related, but they are not automatically the same achievement.
Best Decision vs. Best Prediction
This distinction matters enough to state on its own. A best prediction identifies the future outcome accurately. A best decision produces the strongest risk-adjusted result using the information actually available at the time it had to be made. These are not always the same thing, and conflating them is a quiet, common source of poor portfolio outcomes even among investors who are directionally right more often than not.
A correct forecast can still lead to a poor decision if the instrument used to express it was too leveraged, the entry came too late to capture the move, the position was oversized relative to its actual conviction level, the potential remaining gain was small relative to the risk still being carried, or a better opportunity was sitting in plain sight and ignored out of attachment to the original thesis. Conversely, a forecast that turns out to be only partially correct can still produce a genuinely strong decision if the risk was appropriately limited from the outset and capital gets reallocated effectively once the picture changes. July's strongest result was a clean example of the second half of that principle in practice.
Least Accurate Forecast or Assumption: Underestimating the Resilience of the U.S. Consumer
The original assumption we carried into this period held that restrictive rates would weaken household spending more quickly than it actually has, that pandemic-era support and excess household savings were due to fade sooner, and that traditional aggregate models were correctly signaling a thinner consumer liquidity buffer than turned out to be the case.
What actually happened: consumer demand stayed measurably stronger than our working assumption anticipated. Fiscal and stimulus effects persisted longer than the standard models built into that assumption suggested they would. Household liquidity and available borrowing capacity supported continued spending. Headline consumption weakened, but on a materially slower timeline than we'd built into our positioning. I want to be precise about what I'm not claiming here: this isn't an assertion that the U.S. consumer is now permanently strong or immune to the restrictive-rate environment. The error was specifically about timing and the size of the buffer, not about the eventual direction.
Why the Consumer Forecast Was Wrong
Traditional data was too slow. Quarterly or monthly aggregate releases don't capture rapid shifts in actual spending behavior with the speed a live position requires.
The fiscal buffer was larger than expected. Government support and fiscal transfers built a more durable household cushion than the standard models we were weighting had priced in.
Consumer credit extended the cycle. Credit cards and revolving balances let spending stay elevated even as underlying real financial pressure on households was genuinely increasing.
Household conditions were uneven. Higher-income households likely stayed resilient considerably longer than lower-income consumers, who showed signs of stress earlier: an income-level divergence that aggregate consumption data structurally cannot show.
Labor-market strength delayed the adjustment. Continued employment and nominal wage growth supported consumption for longer than our working assumption had allowed for.
The lesson worth carrying forward: the error wasn't in eventually identifying consumer pressure as a real risk. It was in underestimating both the size of the buffer absorbing that pressure and the time genuinely required for it to erode.
Methodology Change After the Error
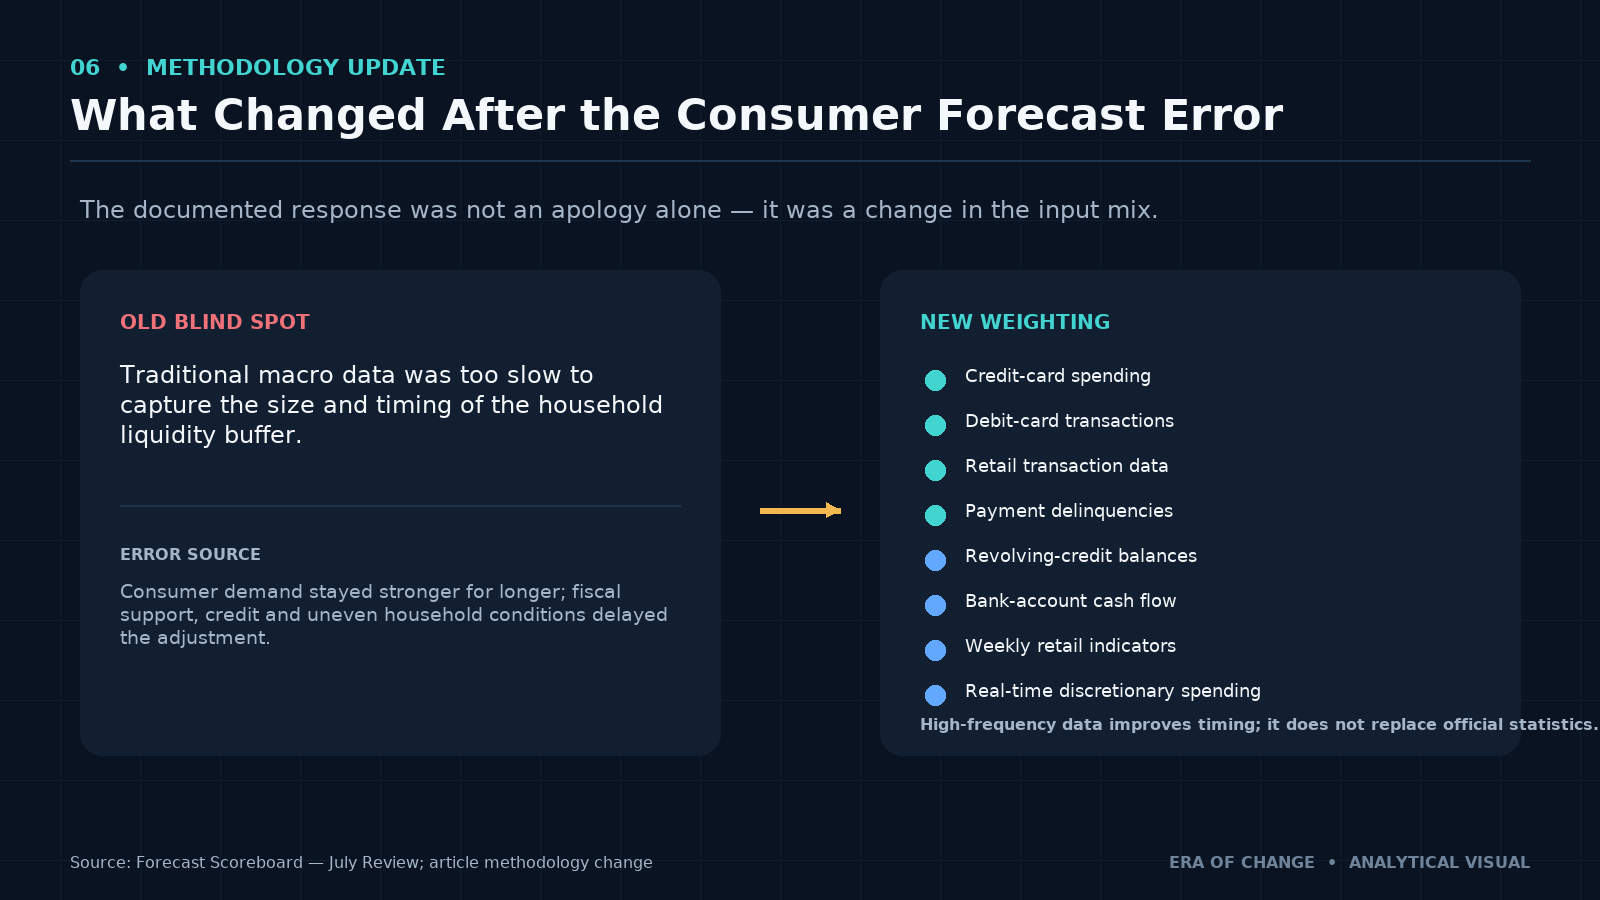
This is the accountability section that actually matters, because a documented model change is worth more than an apology. In direct response to this error, Era has increased the weight our process assigns to high-frequency consumer data.
The inputs receiving greater weight going forward include credit-card spending, debit-card transaction volumes, retail transaction data, payment delinquency trends, revolving-credit balances, bank-account cash-flow patterns, buy-now-pay-later activity, weekly retail indicators, consumer loan application volume, and real-time discretionary-spending trends where reliably available. Every one of these inputs is required to be legally sourced, appropriately aggregated, privacy-compliant, cross-checked against official government releases rather than treated as a replacement for them, and adjusted for seasonality wherever the underlying data structure allows it.
Why High-Frequency Data Matters
Traditional macro indicators carry real structural limitations: they're published with a lag, frequently revised after initial release, aggregated in ways that can obscure what's actually happening underneath the headline number, and generally unable to show income-level divergence within the population being measured.
High-frequency data can reveal a spending slowdown earlier than the official release cycle would, changes in average transaction size, increased reliance on credit to sustain a given spending level, a shift from discretionary toward essential spending categories, geographic or demographic divergence in how stress is actually distributed, and growing payment stress before it shows up in a formal delinquency statistic. It comes with real limitations of its own: the underlying data may cover only part of the population, provider methodology can be genuinely opaque, seasonal events can distort a short-term signal in ways that look like a trend, and nominal spending can rise purely from inflation even as real consumption is actually falling. The principle worth holding onto: high-frequency data improves timing. It does not replace official economic statistics, and we don't treat it as though it does.
Where the Era Methodology Was Strongest: Quarterly Macroeconomic Trend Analysis
The methodology continues to perform best when evaluating inflation direction, liquidity trends, credit conditions, overall economic momentum, sector-level margin pressure, and three-month macro transitions specifically.
This horizon works for a structural reason rather than a coincidental one: it's long enough for structural indicators to actually transmit through into observable outcomes, it filters out a meaningful share of daily market noise that would otherwise obscure the underlying signal, it aligns naturally with corporate reporting cycles and the cadence of official macroeconomic data, and it gives liquidity and policy effects genuine time to become visible in the data rather than judging them before they've had a chance to show up.
Inflation and Corporate Margin Analysis
This is a specific, identifiable strength worth calling out on its own. We evaluate how inflation affects corporate margins through energy costs, labor costs, freight, raw materials, financing costs, pricing power specifically, and currency movements, not through headline inflation treated as a single undifferentiated number.
Headline inflation alone is insufficient precisely because two companies facing the identical inflation rate can experience genuinely different outcomes depending on their actual ability to raise prices without losing customers, their existing debt structure, their supply-chain exposure, how labor-intensive their operations are, and how elastic customer demand actually is for what they sell. This is the exact framework we apply throughout What Causes Inflation?, and it's the connective thread running through both the Inflation Forecast H2 2026 and our broader stagflation analysis.
Where the Methodology Remains Weaker: Short-Term Speculative Squeeze Movements
I want to be direct about this rather than burying it. Short-term price moves can be driven by retail concentration in a single name, social-media narrative velocity, options gamma dynamics, short covering, low float, dealer hedging flows, algorithmic momentum, and sudden information cascades that have little meaningful relationship to earnings, macro data, liquidity fundamentals, or long-term valuation. A macro model can correctly identify genuine fundamental weakness in a position and still fail to predict a short-term squeeze moving directly against it.
Why Speculative Squeezes Are Difficult to Forecast
Reflexivity. Price increases attract additional buyers, which produces further price increases, a self-reinforcing loop with no fundamental anchor requiring it to stop at any particular level.
Nonlinear options effects. Dealer hedging flows can accelerate a move rapidly once certain strike levels are breached, independent of anything happening in the underlying business.
Retail coordination. Narratives can spread through social channels considerably faster than traditional market data updates, compressing the window available to react.
Extreme timing sensitivity. A structurally correct view can be overwhelmed entirely over the course of days or weeks by flows that have nothing to do with the thesis itself.
Incomplete positioning data. Short interest, options exposure, and off-exchange activity may not provide a genuinely complete picture of who's actually positioned which way.
How Era Will Address This Weakness
Potential adjustments under active consideration include greater monitoring of short-interest concentration, options open interest broken down by strike, gamma exposure specifically, retail options volume, social-media velocity as a leading indicator, volume and liquidity anomalies, borrowing costs for short positions, and estimated dealer positioning.
I want to state something clearly, because I think it's the more important point: Era should not attempt to turn a quarterly macro framework into a high-frequency squeeze-prediction system if doing so would weaken the core strengths that actually make this research valuable. A better response, and the one we're actually adopting, runs through smaller position sizes where squeeze risk is genuinely present, defined-risk options structures rather than unlimited exposure, wider timing ranges that don't assume precision we don't have, avoiding unlimited-risk short exposure in names with obvious squeeze characteristics, and, most importantly, keeping our macro forecasts genuinely separate from short-term trade timing rather than letting one discipline quietly degrade the other.
July Methodology Updates
| Area | Previous Approach | July Update | Purpose |
| Consumer demand | Greater reliance on traditional macro releases | Increased weight on high-frequency transaction and card data | Improve timing |
| Retail speculation | Limited direct weight | Added positioning and options-flow review | Identify squeeze risk earlier |
| Quarterly macro trends | Core model strength | Retained without change | Preserve structural focus |
| Inflation margins | Strong sector-level framework | Expanded company-level sensitivity review | Improve dispersion analysis |
| Position management | Thesis-led | Greater emphasis on opportunity-cost reallocation | Improve capital efficiency |
Only changes Era is genuinely adopting appear in this table.
Does the Strongest Forecast Validate the Entire Methodology?
No. One successful reallocation decision does not prove the underlying model is universally reliable, in the same way one earlier error, the S&P 500 technical-ceiling call that missed in June, did not invalidate the entire process either. The methodology has to be evaluated across multiple market environments, different asset classes, different time horizons, both bull and bear regimes, genuine geopolitical shocks, and full liquidity cycles against a sufficiently large sample of resolved forecasts, not a handful of favorable results pulled forward as proof.
Cumulative Forecast Performance
| Metric | June | July | Lifetime |
| Forecasts published | 2 | 2 | 4 |
| Resolved | 2 | 0 | 2 |
| Correct | 1 | 0 | 1 |
| Partially correct | 0 | 0 | 0 |
| Incorrect | 1 | 0 | 1 |
| Still developing | 0 | 2 | 2 |
| Invalidated | 0 | 0 | 0 |
| Resolved accuracy | 50% | N/A, no resolutions this period | 50% |
Forecasts published counts every formally dated forecast issued in that period. Resolved counts forecasts whose horizon has closed and can be scored. Resolved accuracy is correct forecasts divided by total resolved forecasts, using the weighting defined above. June and July are not directly comparable in difficulty or count: June resolved two shorter-horizon calls; July published two longer-horizon forecasts that haven't had time to resolve yet. We're stating that difference explicitly rather than letting the raw numbers imply something the underlying calls don't actually support.
Open Forecasts Still Developing
| Forecast | Published | Evaluation Date | Current Status | Key Confirmation Signal | Invalidation Signal |
| 2026 Mid-Year Global Outlook | July 2026 | December 2026 | Developing | Core inflation holds 3.0%+, Fed stays near current stance, CrisisMeter trends toward 75 | Core inflation falls meaningfully below 3% without a growth shock; broad market participation improves |
| Inflation Forecast H2 2026 | July 2026 | Mid-2027 (12-month horizon) | Developing | Supercore inflation stays elevated; Brent holds above $90 for sustained stretches | Sustained decline in supercore inflation; faster shelter disinflation than modeled |
Open forecasts are excluded from the resolved accuracy rate by design, scoring an unresolved thesis before its horizon has closed would produce a number that doesn't actually mean anything.
Era Analyst's Perspective
From Nikolai Fainizkii, CEO & Senior Analyst, Era of Change
"The result I'm proudest of this month isn't a prediction. It's a decision, recognizing that the oil position we correctly built around the Iran escalation call had already done most of its work by the time Brent retraced from $120 back into the high $80s, and moving capital before that retracement fully caught up with us rather than after. That's a different skill than forecasting, and I think it's the one that actually separates research firms that make money for people from ones that are just good at being right in print.
The mistake I want to own directly is underestimating the American consumer, again. We built our July positioning assuming restrictive rates would show up in spending data faster than they actually did, and the buffer: fiscal transfers, accumulated liquidity, continued wage growth held longer than our models weighted it to. So we changed the models. We're now weighting credit-card and debit-card transaction data more heavily specifically because quarterly aggregates arrive too slowly to catch this kind of resilience while it's still actionable information rather than a historical footnote.
What I won't do is pretend our framework is equally good at everything. We're strong on quarterly macro trends and margin analysis. We're weaker on retail-driven squeezes that have nothing to do with fundamentals. Saying that out loud costs us something in the short term. I think it earns more than it costs over the long term, which is the entire premise of publishing this series at all."
— Nikolai Fainizkii, CEO & Senior Analyst, Era of Change
What Era of Change Will Monitor in August
Based directly on this month's lessons, priority monitoring going into August includes high-frequency consumer spending data, credit-card balances and delinquency trends specifically, continued labor-market resilience, core and services inflation, corporate margin pressure across sectors, broad market breadth, retail options activity, short-interest concentration in vulnerable names, credit spreads, overall liquidity conditions, and Era CrisisMeter movement.
Forecast Accountability Checklist
Every forecast published in August will be required to state its exact publication date, forecast horizon, the specific asset or economic variable in question, the expected direction or range, an assigned confidence level, its core assumptions, the key risks to the thesis, explicit invalidation conditions, a stated evaluation date, and a direct link back to the original publication. This is the same discipline covered in full in Era Forecasting Methodology, applied consistently rather than selectively.
Frequently Asked Questions
What is forecast accuracy?
Forecast accuracy measures how often a research process's published predictions match actual observed outcomes, evaluated against the original stated direction, horizon, and reasoning, not against a revised or reinterpreted version of the forecast published after the fact.
How does Era measure forecast accuracy?
Era classifies every resolved forecast as correct, partially correct, or incorrect, with unresolved theses tracked separately as still developing or formally invalidated. Resolved accuracy is calculated as correct forecasts divided by total resolved forecasts, using a consistent weighting applied identically across every monthly report.
What was Era's strongest forecast in July?
The strongest result was a timely capital reallocation out of an oil position that had already delivered most of its expected gain following the correctly called Iran escalation timeline, moved into instruments with stronger relative upside before the position's remaining potential was fully exhausted.
What was Era's least accurate forecast?
The least accurate assumption underlying July positioning was an underestimation of U.S. consumer resilience: restrictive rates took longer to show up in household spending than traditional models indicated, due to a larger and more durable fiscal and liquidity buffer than expected.
Why did Era underestimate the U.S. consumer?
Traditional aggregate data updates too slowly to capture rapid shifts in spending behavior, the fiscal buffer supporting households proved larger than modeled, continued access to consumer credit extended the spending cycle, resilience was distributed unevenly across income levels in ways aggregate data can't show, and continued labor-market strength delayed the expected slowdown.
How will Era change its forecasting models?
Era is increasing the weight assigned to high-frequency consumer data (credit-card and debit-card transactions, retail volumes, delinquency trends, and revolving-credit balances), specifically to improve the timing of consumer-demand forecasts, while continuing to cross-check that data against official government releases.
What are high-frequency economic indicators?
High-frequency economic indicators are data sources (transaction-level spending data, weekly retail figures, real-time credit metrics) that update far more frequently than traditional monthly or quarterly government releases, allowing analysts to detect shifts in economic behavior earlier, though with real limitations around population coverage and methodology transparency.
Why are speculative squeezes difficult to predict?
Speculative squeezes are driven by reflexive price dynamics, nonlinear options-hedging effects, rapid retail coordination through social channels, and extreme timing sensitivity: factors with little direct connection to the fundamental, macro-driven data a quarterly forecasting framework is built to evaluate.
Is Era better at macro forecasts or short-term trades?
Era's methodology performs demonstrably better on quarterly macroeconomic trend analysis and inflation's effect on corporate margins than on short-term speculative squeeze prediction. This is stated directly rather than obscured, because it defines the appropriate use of the framework.
How are partially correct forecasts scored?
Partially correct forecasts are scored at 0.5 in Era's weighted accuracy calculation, positioned between a correct forecast at 1.0 and an incorrect forecast at 0, applied consistently across every monthly report to keep the resulting accuracy rate comparable over time.
Are open forecasts included in the accuracy rate?
No. Forecasts still classified as developing are excluded from the resolved accuracy calculation entirely, since scoring an outcome before its stated horizon has closed would not produce a meaningful or fair result.
Where can readers view the full forecast archive?
Era's complete forecast archive, including this report, the June review, and all underlying original research, is available at eraperemen.info/en.
About Era of Change
Era of Change is an independent macroeconomic research and geopolitical intelligence firm providing institutional-quality analysis for investors worldwide. Its research combines macroeconomics, financial markets, blockchain analytics, artificial intelligence, and geopolitical risk within proprietary forecasting frameworks designed to identify structural market changes before they become broadly recognized.
Era publicly reviews its forecasts each month, including successful calls, forecasting errors, unresolved theses, and changes made to its methodology as a result. The objective is to demonstrate long-term analytical discipline rather than selectively highlight favorable outcomes. Our full methodology, live index reading, and forecast archive are available at eraperemen.info/en.
The content published by Era of Change is for informational and educational purposes only and does not constitute financial, investment, legal, or tax advice. All views expressed are the personal analytical perspective of the author. Past forecast accuracy does not guarantee future results. Readers should conduct their own research and consult a qualified financial professional before making any investment decisions.
Sources
Original Era Research
- Forecast Scoreboard — June Review
- Era Global Risk Index
- Era CrisisMeter Explained
- What Causes Inflation?
- What Is Stagflation?
- 2026 Mid-Year Global Outlook
- Inflation Forecast H2 2026
- Era Forecasting Methodology
- Scenario Planning for Investors
Official Economic Data
— Nikolai Fainizkii, CEO & Senior Analyst, Era of Change



