Executive Summary
The first half of 2026 was defined by resilient asset prices, concentrated technology leadership, and a level of investor optimism that, in my view, has stopped pricing in the world we actually live in. The S&P 500 touched an all-time high of 7,621 in mid-June and remains near that level today. Markets absorbed a shooting war between the United States, Israel, and Iran, one that shut the Strait of Hormuz for months and sent Brent crude to $188 a barrel, and came out the other side making new highs within weeks of the ceasefire. That is not resilience. That is a market that has decided to stop pricing risk it cannot see on a chart.
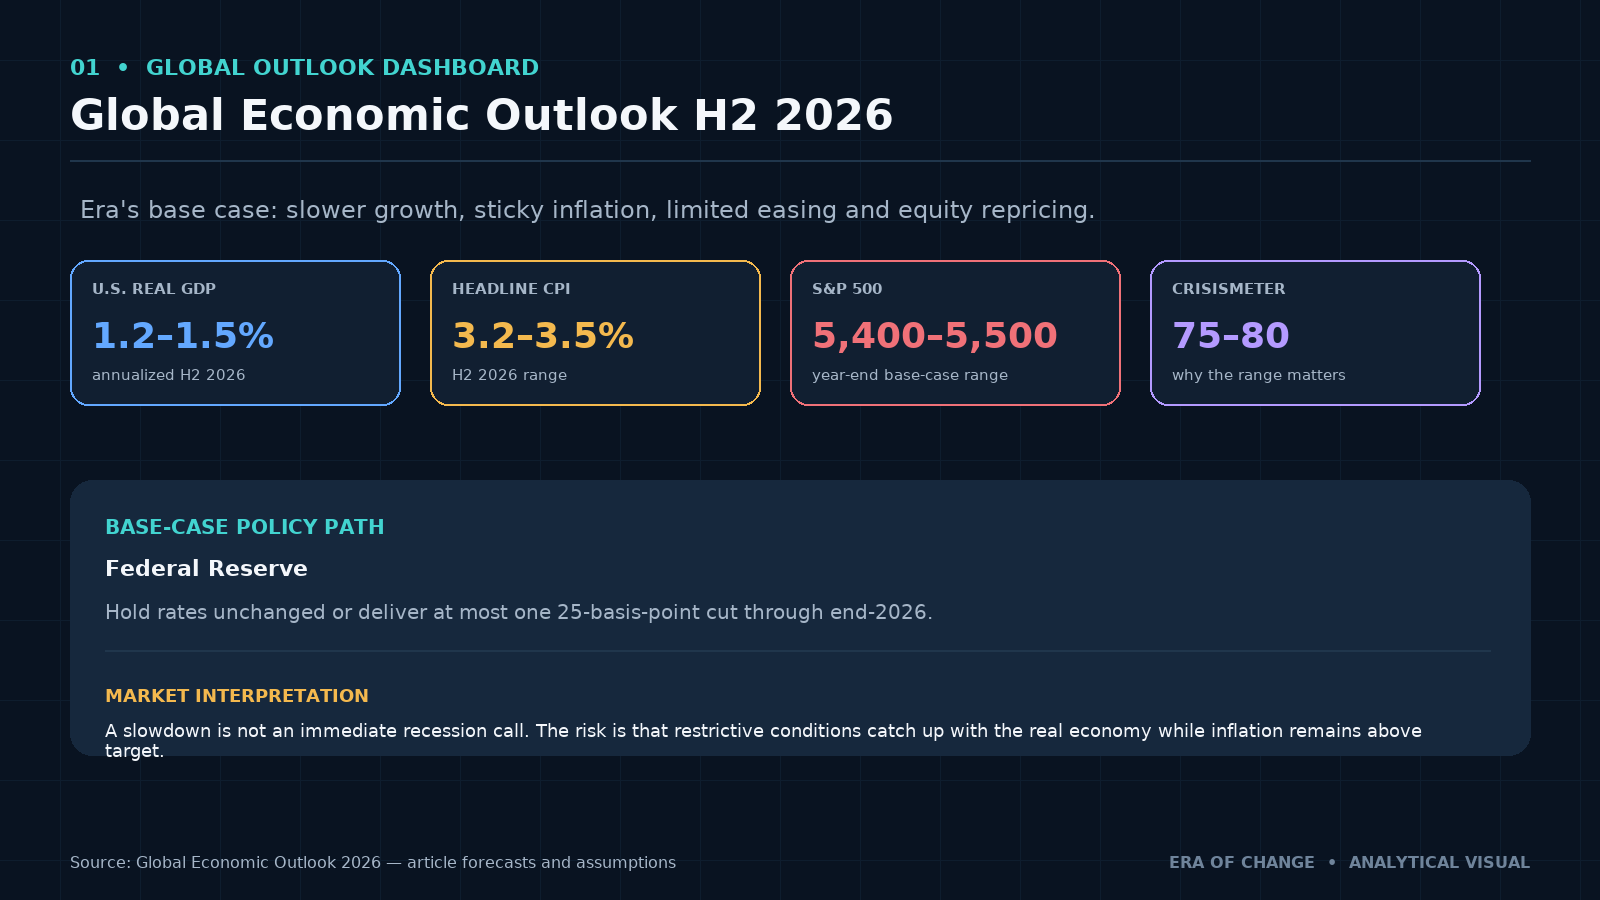
Era's base case for the second half of 2026 is slower U.S. growth, limited Federal Reserve easing, inflation that stays uncomfortably above target, and a repricing of U.S. equities that most of Wall Street is not currently underwriting. We expect real GDP growth to cool to 1.2–1.5% annualized, CPI to hold in a 3.2–3.5% range, and the Fed to deliver at most one 25-basis-point cut, assuming it eases at all. We expect the S&P 500 to end the year in a 5,400–5,500 range, a roughly 28% decline from current levels. I want to be direct about that number, because it is the boldest call in this piece and it deserves to be treated as one.
The Era CrisisMeter, currently at 69, is on a trajectory toward 75–80 in the second half of the year. The single largest driver of that move, and the tail risk I am watching most closely, is a re-escalation of the conflict that already interrupted Gulf shipping once this year. The ceasefire holding through Hormuz is fragile, not resolved, and a second disruption would compound with sovereign refinancing stress that is already visible in weak Treasury auction demand.
Key Forecasts for H2 2026
| Indicator | Era Base Case | Direction | Main Driver |
| U.S. real GDP growth | 1.2%–1.5% annualized | Slower | Tight financial conditions, weaker real-sector demand |
| U.S. CPI inflation | 3.2%–3.5% | Persistent | Structural supply costs, energy risk premium |
| Federal Reserve policy | Hold, or one 25 bps cut | Restrictive | Limited room to ease without reigniting inflation expectations |
| S&P 500 year-end range | 5,400–5,500 | Sharply lower from current ~7,458 | Multiple compression as tech resilience fails to offset real-sector margin damage |
| Era CrisisMeter | 75–80 | Rising | Convergence of geopolitical, liquidity, and sovereign debt stress |
These are conditional forecasts tied to the assumptions described below, not guarantees. They will be reviewed against actual outcomes in Era's monthly Forecast Scoreboard, the same way every call we have published since launch has been reviewed.
The First Half of 2026: Euphoria on a Powder Keg
I've used this phrase internally since March, and I haven't found a better one. Euphoria on a powder keg captures exactly what happened in H1 2026: a market that lived through an actual war in one of the most strategically important waterways on the planet, and priced almost none of it into anything beyond energy futures.
Here is what actually happened. On February 28, 2026, the United States and Israel launched military action against Iran. The Iranian response included mining sections of the Strait of Hormuz and attacking merchant shipping, which took a corridor that normally carries roughly a quarter of the world's seaborne oil trade and around a fifth of global LNG shipments down to almost nothing within days. Brent crude, which had been trading in the $70s, spiked to a wartime high above $188 a barrel in late April. A ceasefire took hold by June. Tanker traffic through the strait is recovering, but it has not returned to the roughly 138 daily transits that were normal before the conflict, shipping companies remain wary of war-risk insurance premiums, residual mine risk, and a peace framework that Tehran is actively using as leverage, reportedly requiring some vessels to coordinate through designated intermediaries and pay additional transit fees.
And the S&P 500 hit a new all-time high of 7,621 in the middle of all of this, in June, one month before this piece was written. As of July 17, the index sits at 7,458, down modestly from the peak, but still up more than 18% year over year. Investor attention through the first half of the year remained locked on technology and the Magnificent Seven, and the FOMO around AI infrastructure spending was strong enough to absorb a live regional war without meaningfully repricing broad equity risk.
That is the powder keg. Strong index-level performance did not reflect broad economic strength. It reflected concentration. A handful of mega-cap technology names carried the index through an event that, in any prior cycle I can point to, would have produced a sustained equity drawdown. It didn't happen this time, and I think that is the single most important thing for investors to understand about where we are heading into H2.
Era's Base-Case Global Macro Forecast for H2 2026
U.S. Growth Slows Toward 1.2%–1.5%
Restrictive financial conditions work with a lag, and that lag is now catching up to the real economy. Credit creation has been slowing for several quarters as banks price in a Fed funds rate that has held at 3.50%–3.75% since June, with the market now assigning meaningful odds (CME's FedWatch tool put it near 47% as of mid-July) to the Fed actually raising rates at its July 28–29 meeting rather than cutting. Businesses and households carrying debt taken on during the low-rate years are rolling that debt over at materially higher costs, and that refinancing pressure compounds every quarter rates stay elevated.
I want to be precise about what this forecast is and isn't. This is a slowdown, not a call for an immediate recession. Headline GDP can remain positive even as the underlying resilience of the economy deteriorates, that was exactly the pattern in 2022 and 2023, when accumulated pandemic-era liquidity let consumer spending absorb high rates far longer than classical macro models predicted. What I am watching for in H2 is whether that cushion, which I underestimated once already, is finally exhausted. The early evidence, decelerating credit growth, rising refinancing costs, softening real-sector demand, suggests it is.
Inflation Remains Above Target
Our forecast is CPI in a 3.2%–3.5% range through H2. June's print actually came in at 3.5%, down sharply from 4.2% in May, and I don't want anyone reading that decline as the start of a clean disinflation path back to 2%. That drop was driven almost entirely by energy prices decelerating as the U.S.-Iran ceasefire took hold: energy costs rose 15.7% year over year in June versus 23.5% in May. That is a one-time reset from a war ending, not a structural improvement in the inflation picture.
Underneath that, core inflation, excluding food and energy, sits at 2.6%, down from 2.9% in May but still meaningfully above the Fed's 2% target. The structural drivers holding it there are the ones we've written about before: deglobalization and the duplicated supply chains it requires, real-sector underinvestment after years of capital chasing technology returns instead of physical capacity, and a shipping and logistics system that is still not operating at pre-war capacity through one of the world's most important chokepoints. The last mile of disinflation, the move from 3% down toward 2%, is structurally harder than the earlier decline from 9% down to 4%, because the remaining components are the sticky ones: shelter, services, and energy risk premium. I go into the mechanics of this in more detail in our inflation forecast for H2 2026.
The Federal Reserve Has Limited Room to Cut
Our base case is that the Fed holds rates unchanged, or delivers at most one 25-basis-point cut, through the end of 2026. The Committee is caught between two forces pulling in opposite directions. Weakening growth argues for easing. Persistent inflation, sitting more than a point above target, argues against it. And a third factor most commentary ignores: sovereign debt and Treasury market liquidity stress make aggressive cuts genuinely dangerous right now, not just uncomfortable.
I need to be explicit about something here, because it will matter for how investors read any cut that does happen. If the Fed cuts in H2, and that cut is a response to financial system breakage rather than a controlled response to falling inflation, do not treat it as bullish. A panic cut delivered because credit markets or Treasury auctions are failing is the central bank capitulation scenario I've written about before, the kind of easing that de-anchors inflation expectations rather than controlling them. The market's instinct will be to rally on any cut. That instinct will be wrong if the cut comes for the wrong reason.
S&P 500 Outlook: A Sharp Repricing, Not a Sustainable Range
Here is the number that will draw the most attention in this piece, so let me be precise about it. Era's base case for the S&P 500 at year-end 2026 is a range of 5,400–5,500. Against the index's current level of roughly 7,458 and its June all-time high of 7,62, that is a decline of approximately 26–29%. I am stating this plainly because I think vague hedging around a number like this is worse than being wrong. This is not a volatility forecast. It is a call that the index gives back a substantial share of the gains built on a small number of technology names, and does so before year-end.
The logic is straightforward. Earnings growth in the handful of companies currently carrying the index has to keep outrunning margin deterioration everywhere else in the market for the current valuation to hold, and I don't think that math works for another two quarters against 3.5% inflation and a Fed that cannot meaningfully ease. Market breadth is narrow enough that a rotation out of the mega-caps, whether driven by a single disappointing earnings print, a credit event, or the Hormuz risk resurfacing, would remove the only thing currently offsetting broad-market weakness. High valuations are also more sensitive to rates than at any point in over a decade, which means the index has less cushion than headline strength suggests.
What would invalidate this call: sustained core inflation decline without a growth shock, a genuine broadening of market participation beyond the current handful of leaders, or a Fed that finds real room to ease without a corresponding financial-stability trigger. I'll return to these conditions in the invalidation section below, because a forecast this bold only means something if I tell you exactly what would prove it wrong.
Three Scenarios for the Second Half of 2026
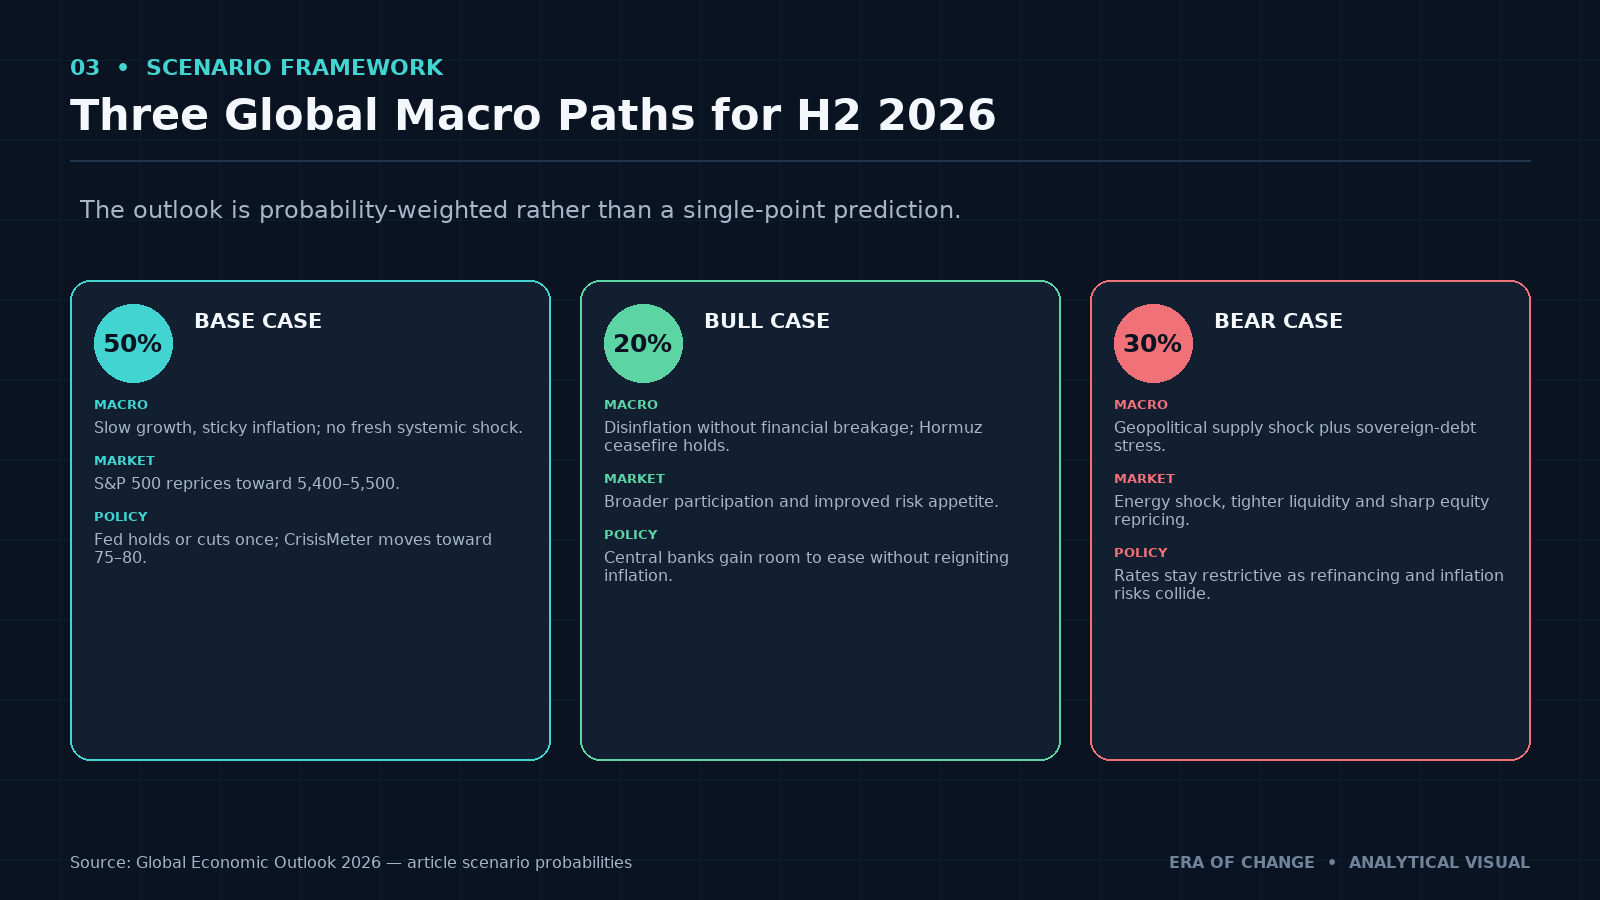
I don't publish single-point forecasts without scenario framing, because a single number invites the reader to treat it as a prediction rather than a probability-weighted view. Here are the three paths I see for H2, with the base case carrying the highest weight but far from a majority of the probability mass.
Base Case — Slow Growth, Sticky Inflation (50% probability). The trigger for this path is simply the absence of a fresh shock: no prolonged closure of the Strait of Hormuz, no disorderly Treasury auction failure. Inflation stays above target without accelerating meaningfully. The Fed remains cautious and mostly on hold. Equities reprice lower as described above, the 5,400–5,500 range, as narrow leadership finally gives way to broader margin pressure. The CrisisMeter rises toward the 75–80 zone but does not cross into acute-crisis territory above 80. This case is invalidated if core inflation breaks meaningfully below 3% without a corresponding growth shock, which would open real room for the Fed to ease constructively.
Bull Case — Disinflation Without Financial Breakage (20% probability). Energy prices stay contained as the Hormuz ceasefire holds and shipping capacity normalizes faster than currently expected. Labor market cooling proceeds in an orderly way rather than through a sharp unemployment spike. Credit markets remain functional, and inflation declines faster than our base case, meaningfully below 3% by year-end, giving the Fed genuine room to cut without reigniting price pressure. Under this path, market breadth improves as capital rotates beyond mega-cap technology into the broader index, and the S&P 500 holds closer to current levels, in a 7,000–7,400 range, rather than repricing sharply lower. This case is invalidated by any renewed energy shock or a widening of high-yield spreads from their current historically tight level.
Bear Case — Geopolitical Supply Shock and Debt Stress (30% probability). The trigger is a direct re-escalation involving Iran, a fresh disruption to the Strait of Hormuz or comparable logistics infrastructure, on top of a ceasefire that is already fragile and a shipping system that has not returned to pre-war capacity. Energy prices spike again, inflation reaccelerates, and central banks are trapped between an inflation mandate and a financial-stability mandate at the exact moment sovereign yields are rising on their own. Rising Treasury yields collide with weak auction demand. We already saw bid-to-cover ratios miss average and primary dealer absorption run well above normal in the March 2026 auctions, before this second escalation even happens. The CrisisMeter moves through 80 under this scenario, and the S&P 500 falls below the base-case range, into the low 4,000s. This is invalidated only by a durable resolution to the underlying Iran conflict, not a temporary lull, but a framework that removes the recurring transit risk from Gulf shipping altogether.
CrisisMeter Outlook: Why 75–80 Matters
The Era CrisisMeter closed our launch piece at 69, sitting in the 60–80 zone I described then as broad, interconnected structural stress: the phase where markets can still look calm on the surface while institutional capital quietly repositions underneath. Our H2 base case has the index moving toward 75–80, still inside that same zone but close enough to its upper edge that the practical posture for investors shifts meaningfully.
That move would reflect convergence, not a single trigger. Interbank liquidity conditions are tightening as the Fed holds rates restrictive for longer. Credit market stress remains an area to watch closely: ICE BofA's high-yield option-adjusted spread was sitting near 2.69% in July, which is historically tight and, in my view, one of the more mispriced signals in the market right now. Geopolitical risk stays elevated given the fragile state of the Hormuz ceasefire. And capital flow dynamics are shifting in a way that deserves its own note: the traditional playbook of watching China's credit impulse as the dominant global demand signal needs updating. Chinese credit growth has decelerated to a record low as households and corporates stay reluctant to take on debt, and the United States, driven by AI infrastructure capital expenditure, now accounts for more than half of global credit impulse. That is a genuine shift in the machinery investors need to watch, and I don't think it has been priced into how most people think about global liquidity yet.
I want to repeat something I said when we launched this index: it is not a day-specific crash predictor. A reading of 75–80 does not tell you which Tuesday the market falls. It tells you that the structural margin of safety in the system continues to thin, and that the probability distribution of outcomes has shifted meaningfully toward the tail. For the full mechanics of how we calculate the score and what each zone means, see our Era CrisisMeter Explained piece.
The Most Important Tail Risk, A Middle East Supply Shock
I don't treat this as a hypothetical. It already happened once this year. The question for H2 is not whether a Middle East energy shock is possible, it's whether the ceasefire that ended the first one holds, and I think that's a genuinely open question rather than a settled one.
The Strait of Hormuz carries roughly 25% of the world's seaborne oil trade and about 20% of global LNG shipments under normal conditions. The February–June conflict took daily transits from around 138 vessels to nearly zero within days of the fighting starting. Even with a ceasefire in place since June, traffic has not returned to pre-war levels, shipping companies remain cautious about residual sea-mine risk, war-risk insurance premiums that have not fully come back down, and a peace framework that Tehran appears to be actively using as leverage over the strait rather than treating as a clean resolution. That is not a stable equilibrium. It is a paused conflict with the underlying chokepoint risk fully intact.
If this reignites, whether through a specific incident, a breakdown in the ceasefire's terms, or a broader regional escalation, the transmission into global markets would run through energy prices first, exactly as it did in Q1 and Q2 of this year, when Brent moved from the $70s to a wartime peak above $188. I keep the scenario analysis for how far this could spread scenario-based rather than treating renewed military escalation as a certainty, because it isn't one. But the base rate for a second flare-up, given how the first one resolved, is not low.
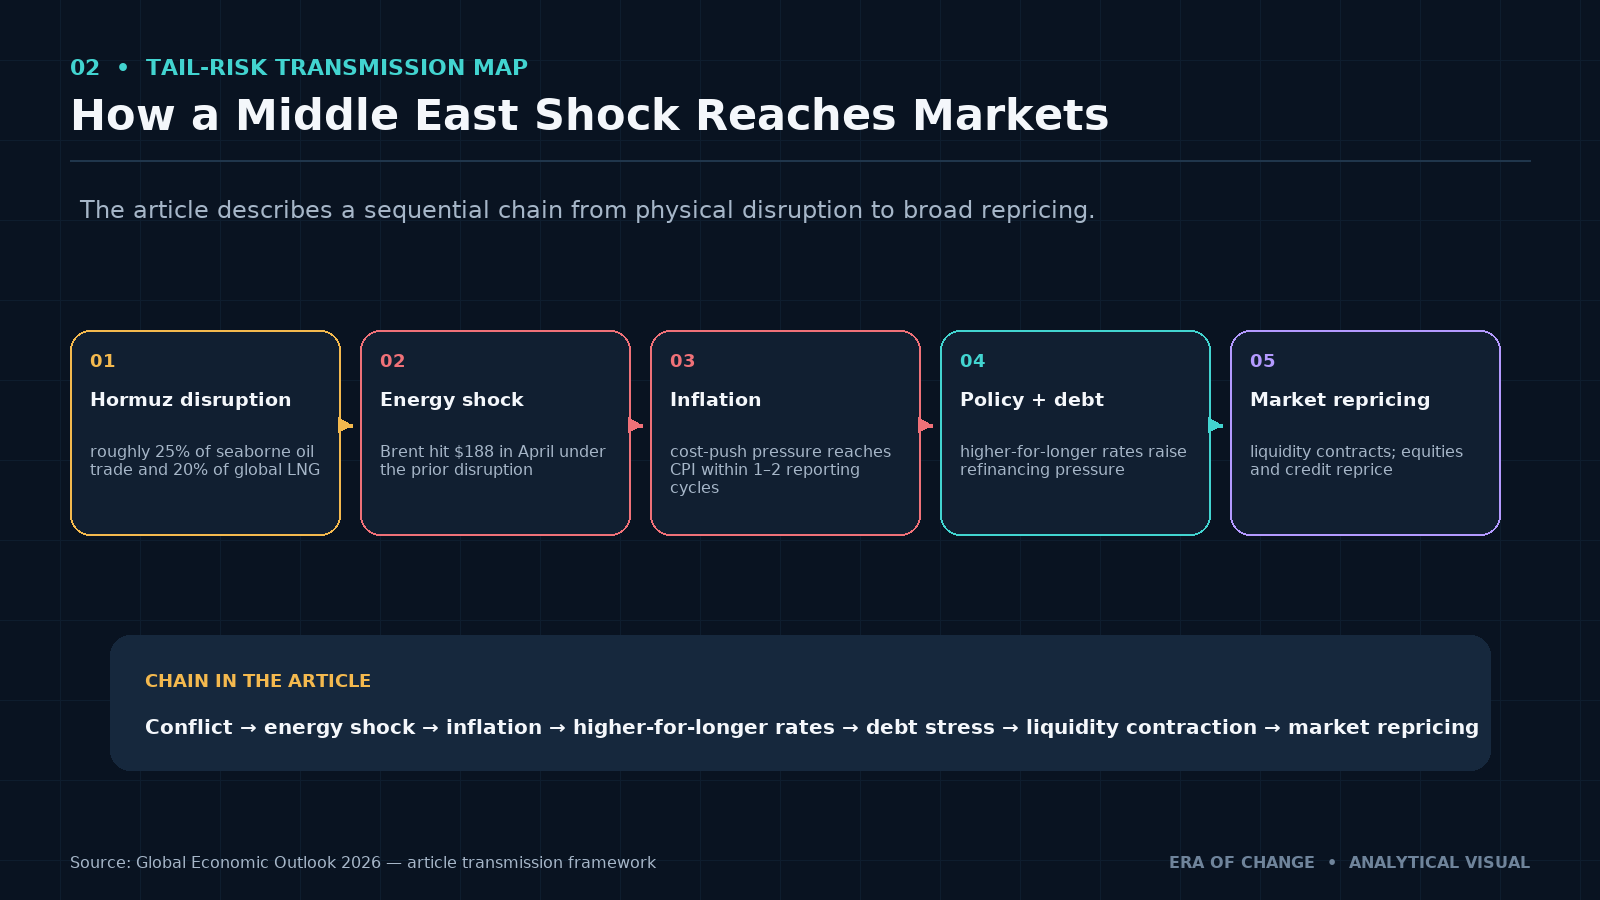
How an Iran Shock Could Spread Through Global Markets
The transmission mechanism is not abstract. We watched it happen in real time this spring, and it would repeat the same way.
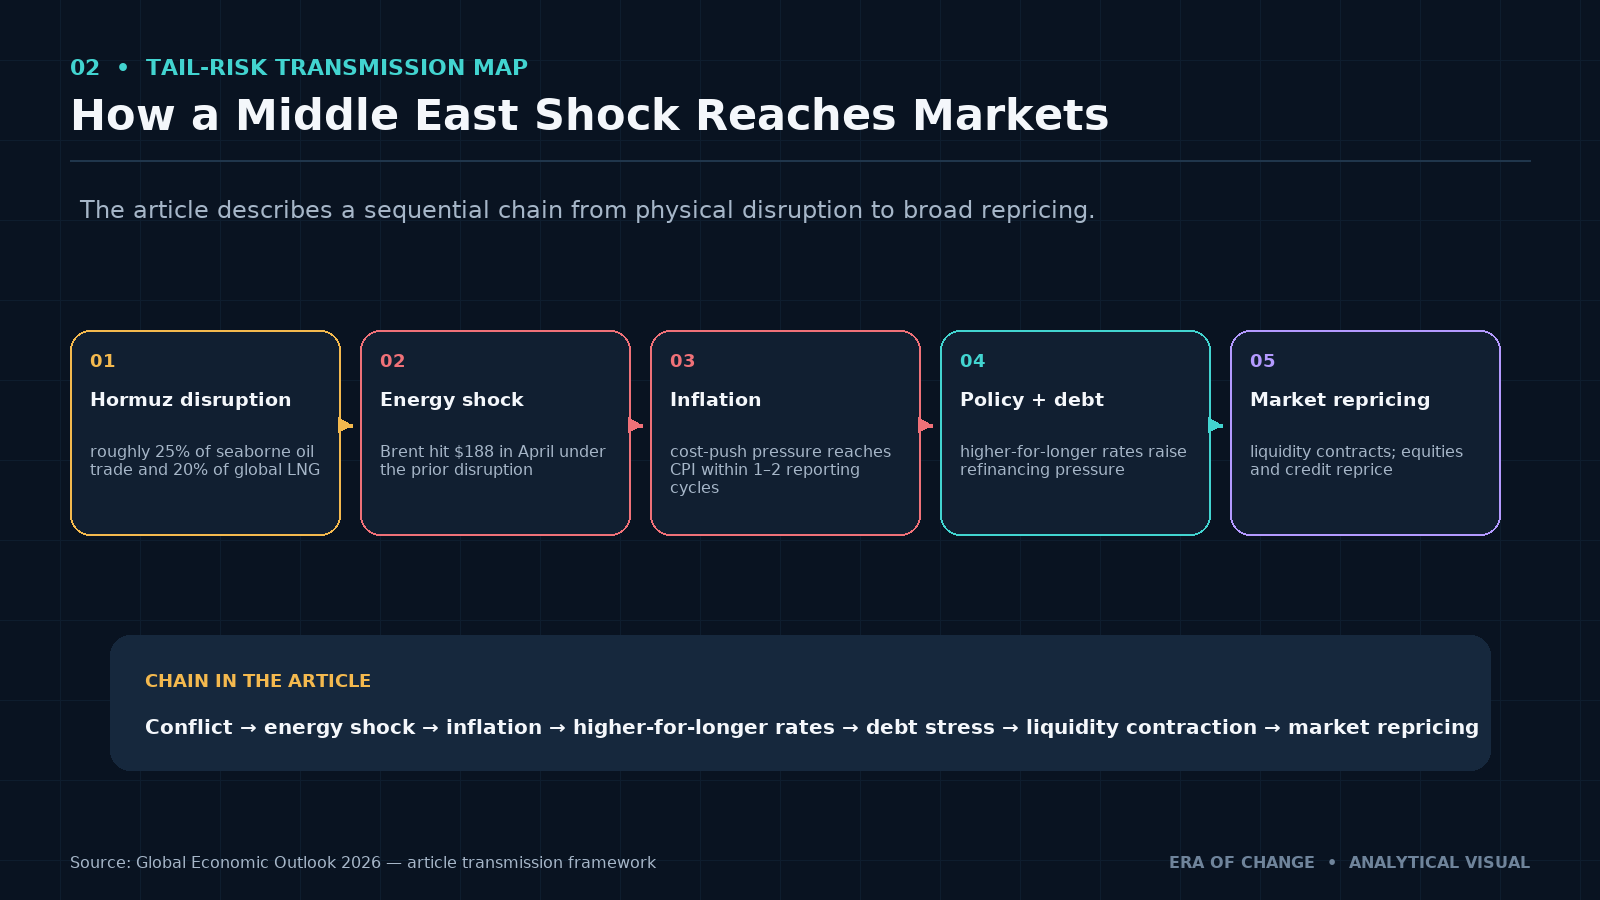
Energy prices rise. A renewed disruption to Hormuz shipping pushes oil and gas prices higher immediately, the way it did when Brent hit $188 in April. Higher energy costs raise input prices throughout the economy within weeks.
Inflation reaccelerates. The energy-driven cost-push effect works its way into CPI within one to two reporting cycles, reversing the ceasefire-driven disinflation that produced June's encouraging 3.5% print. Central banks lose whatever room they had to ease.
Sovereign refinancing becomes more expensive. Governments carrying large debt loads and the U.S. alone has roughly $10 trillion coming due for refinancing over the next 12 months are forced to roll that debt over at higher yields precisely when investor appetite for sovereign paper is already showing strain, as it did in the weak March 2026 Treasury auctions. I cover this dynamic in more depth in our upcoming Global Debt Risks 2026 piece.
Liquidity conditions tighten. Rising collateral stress and a broad flight to quality pressure funding markets, widening the SOFR-OIS spread and other interbank stress indicators I track as part of the CrisisMeter's liquidity category.
Equity valuations compress. High-duration, low-profitability assets, exactly the kind of names currently carrying index-level performance, become the most vulnerable to a repricing, because their valuations depend most heavily on a rate and liquidity environment that a fresh shock would immediately worsen.
Conflict, energy shock, inflation, higher-for-longer rates, debt stress, liquidity contraction, market repricing: that is the chain, in the order it actually runs.
What Markets May Be Underpricing
Four things, in my assessment, are not adequately reflected in current asset prices.
Narrow equity leadership. The S&P 500's return to all-time highs in June depended on a small group of mega-cap technology companies. That concentration is itself a risk the index level doesn't communicate, a broad index at a new high can still be one earnings disappointment away from a sharp drawdown if the names carrying it are few enough.
Real-sector margin compression. Businesses outside technology are absorbing higher financing costs, sticky labor costs, and input costs that have not fully normalized since the spring energy shock. None of that shows up cleanly in an index-level number dominated by a handful of companies with different cost structures entirely.
Sovereign debt refinancing pressure. The $10 trillion in U.S. debt due for refinancing over the next 12 months is colliding with reduced auction appetite and a Fed that has limited room to provide relief through lower rates. The March auction data, bid-to-cover below average, primary dealer absorption well above average, wider-than-normal tails, is not a one-off, a point the GAO's own fiscal outlook review echoes. It's a pattern worth watching every auction cycle for the rest of the year.
Geopolitical fragmentation. Trade, payments, and resource flows are becoming structurally less efficient as they become more politically controlled: the Hormuz transit fee arrangements Iran has reportedly been imposing on shipping are a small but telling example of what fragmentation looks like in practice, not in theory. We rank and track this dynamic alongside our other structural risks in Top Global Geopolitical Risks in 2026.
Era Analyst's Perspective
From Nikolai Fainizkii, CEO & Senior Analyst, Era of Change
"I want to say something directly that I think most people managing money right now don't want to hear. We already lived through the tail risk this year. The Strait of Hormuz was effectively closed for months. Oil hit $188 a barrel. And the S&P 500 made a new all-time high one month before I sat down to write this. That is not the market correctly pricing a dangerous world, that is the market deciding a war that already happened doesn't count anymore because a ceasefire got signed.
I've watched high-yield spreads sit near 2.69%, historically tight, while the CrisisMeter climbs toward 75. Those two numbers are not supposed to move in opposite directions for long. Credit markets and structural risk data converge eventually. They always do. The only question is which one is wrong right now, and I don't think it's the structural data.
So yes, a 5,400 to 5,500 target for the S&P 500 sounds aggressive against a market sitting above 7,400. I understand that. But I'd rather put a specific, falsifiable number on the table and be wrong on the record than hedge this into something so vague it protects my reputation instead of informing your decisions. The Hormuz ceasefire is not a resolution. It's a pause with the same underlying chokepoint risk fully intact, and the Treasury market is already showing strain refinancing debt in a calm environment. I don't think H2 stays calm."
— Nikolai Fainizkii, CEO & Senior Analyst, Era of Change
Portfolio Implications for Large Investors
This is general risk-management commentary based on our structural framework, not personalized investment advice: every investor's appropriate response depends on their own mandate, time horizon, and risk tolerance.
Hedge Tail Risk Before Volatility Spikes
Protection is generally cheaper before a crisis becomes consensus, and right now, with the VIX sitting in the moderate 15–19 range through most of July despite a CrisisMeter reading of 69 heading toward 80, the gap between priced volatility and structural risk is about as wide as I've seen it. Long-dated put spreads or LEAPS on broad indices like the S&P 500 or Nasdaq-100 are the instrument I'd point institutional allocators toward for this purpose. Position sizing matters enormously here: tail hedges carry real premium-loss risk if the tail event doesn't materialize on the timeline you've hedged for, so this should be sized as insurance, not as a directional bet.
Reduce Concentration in Overextended Mega-Caps
Given how much of the index's H1 performance depended on a handful of names, moving some exposure from capitalization-weighted structures toward more equally weighted or diversified alternatives reduces the single-point-of-failure risk that concentrated leadership creates. I'm not going to name a specific ETF as appropriate for every investor reading this, that decision depends on your existing exposure and mandate, but the principle of reducing concentration risk ahead of a potential rotation applies broadly.
Increase Exposure to Real Assets
Physical gold, which is already trading near record territory around $4,000 an ounce after touching an all-time high above $5,500 in January, broad commodity exposure, and selected energy and resource assets all play a structural role in a scenario where inflation stays sticky and geopolitical risk stays elevated. Derivatives, commodities, and concentrated strategies all involve substantial risk and are not appropriate for every portfolio, this is a directional framework, not a specific allocation recommendation.
Indicators That Would Change Our Outlook
I said earlier that a forecast this specific only means something if I tell you what would prove it wrong. Here is exactly that.
Bullish invalidation signals: a sustained decline in core inflation without an accompanying growth shock; broader equity-market participation beyond the current handful of mega-cap leaders; high-yield credit spreads easing further without renewed inflation pressure; improving global trade and manufacturing data; the CrisisMeter moving lower rather than continuing toward 75–80.
Bearish confirmation signals: a sharp widening of high-yield spreads from their current tight 2.69% level; renewed stress in the SOFR-OIS spread or comparable dollar-funding indicators; another oil-price shock originating from Hormuz or elsewhere in the Gulf; rapid deterioration in labor market data beyond the gradual cooling we currently expect; Treasury market liquidity stress beyond what the March auctions already showed; the CrisisMeter breaking above 80.
This is how the forecast should be judged over the next six months against these specific conditions, not against whether I feel differently about it later.
What Era Will Monitor During H2 2026
- Core and headline CPI, released monthly by the BLS
- M2 and bank credit growth, tracked weekly via the Fed's H.6 release. See our full breakdown in M2 Money Supply Explained
- High-yield spreads via the ICE BofA US High Yield Index (currently 2.69%)
- SOFR-OIS spread and broader dollar-funding conditions
- The 10-year–2-year Treasury spread, currently at +0.37% after swinging between positive and negative territory since late February, background in Yield Curve Explained
- Oil prices and Strait of Hormuz shipping volumes
- Corporate refinancing activity, with roughly $2 trillion in gross corporate bond issuance expected in 2026
- Foreign demand for U.S. Treasuries, tracked through auction bid-to-cover ratios and indirect bidder participation
- Labor market deterioration, including jobless claims and temp-help employment
- CrisisMeter category-level contributions, to identify which structural layer is driving any move toward 75–80
Forecast Accountability
This outlook will be evaluated against published outcomes in Era's monthly Forecast Scoreboard rather than revised retrospectively without disclosure. We are stating our initial assumptions here (the growth, inflation, Fed policy, and S&P 500 figures above, tied to the geopolitical and credit conditions described) and we will mark each forecast as correct, partially correct, incorrect, or still developing when we review it. The process behind how we weight models against judgment on calls like this one is laid out in full in Era Forecasting Methodology. Our June and July scoreboards are available for readers who want to see how this accountability process has worked in practice so far.
Frequently Asked Questions
What is the global economic outlook for the second half of 2026?
Era's base case for H2 2026 is slower U.S. growth around 1.2–1.5% annualized, inflation holding at 3.2–3.5%, a Federal Reserve that holds rates or cuts at most 25 basis points, and a significant equity market repricing as narrow technology-driven leadership gives way to broader margin pressure. The Era CrisisMeter is expected to move toward a 75–80 reading as geopolitical, credit, and liquidity stress converge.
What is Era's U.S. GDP forecast for 2026?
We expect real GDP growth to cool to a 1.2%–1.5% annualized rate in the second half of 2026, driven by the delayed effect of restrictive financial conditions, slower credit creation, and refinancing pressure on businesses and households carrying debt originated during the low-rate years. This represents a slowdown, not a forecast for an immediate recession.
What is the inflation outlook for H2 2026?
Era forecasts CPI in a 3.2%–3.5% range through the second half of 2026. June's cooler 3.5% print was driven primarily by an energy-price deceleration tied to the U.S.-Iran ceasefire, not a structural improvement in underlying inflation. Core inflation, excluding food and energy, remains near 2.6%, still above the Fed's 2% target, and the final decline toward that target is likely to prove harder than the earlier disinflation from much higher levels.
Will the Federal Reserve cut interest rates in 2026?
Era's base case is that the Fed holds its policy rate unchanged, or delivers no more than one 25-basis-point cut, through the end of 2026. Persistent inflation above target and sovereign debt market stress limit the Fed's room to ease, even as growth slows. Any cut delivered as an emergency response to financial-system stress rather than controlled disinflation should not be read as a bullish signal.
What is the S&P 500 outlook for the end of 2026?
Era's base-case target for the S&P 500 at year-end 2026 is a range of 5,400–5,500, a decline of roughly 26–29% from the index's current level near 7,458 and its June all-time high of 7,621. This forecast reflects a view that narrow technology-driven market leadership cannot indefinitely offset margin compression across the broader economy under current inflation and rate conditions.
What are the biggest geopolitical risks for H2 2026?
The most significant tail risk Era is monitoring is a re-escalation of the conflict involving Iran and renewed disruption to shipping through the Strait of Hormuz. The ceasefire reached in June 2026, following a conflict that briefly halted most tanker traffic through the strait and pushed Brent crude above $188 a barrel, remains fragile, with shipping volumes still below pre-war levels and war-risk insurance premiums still elevated.
What does a CrisisMeter reading of 75–80 mean?
A CrisisMeter reading in the 75–80 range indicates structural stress that is broad, interconnected, and approaching levels that have historically coincided with acute crisis conditions above 80. It reflects convergence across multiple structural categories (liquidity, credit, geopolitical, and capital flow risk), rather than a single isolated signal, and it is not a day-specific prediction of market movement.
What could invalidate Era's base-case forecast?
A sustained decline in core inflation without an accompanying growth shock, broader equity-market participation beyond the current handful of technology leaders, easing high-yield credit spreads without renewed inflation, and improving global trade data would all argue against our base case. Conversely, a sharp widening of high-yield spreads, renewed dollar-funding stress, another oil shock, or the CrisisMeter breaking above 80 would confirm the bearish case is unfolding faster than our base case anticipates.
About Era of Change
Era of Change is an independent macroeconomic research and geopolitical intelligence firm providing institutional-quality analysis for investors worldwide. Its research combines macroeconomics, financial markets, blockchain analytics, artificial intelligence, and geopolitical risk within proprietary forecasting frameworks designed to identify structural market changes before they become broadly recognized. The 2026 Mid-Year Global Outlook is based on the Era Global Risk Index, the Era CrisisMeter, and the firm's wider analysis of liquidity, credit markets, inflation, capital flows, and geopolitical developments. Our full methodology, live index reading, and forecast archive are available at eraperemen.info/en.
The content published by Era of Change is for informational and educational purposes only and does not constitute financial, investment, legal, or tax advice. All views expressed are the personal analytical perspective of the author. Past forecast accuracy does not guarantee future results. Readers should conduct their own research and consult a qualified financial professional before making any investment decisions.
Sources
Official Economic Data
- Federal Reserve: FOMC Statement, June 17, 2026
- Federal Reserve: Monetary Policy Report to Congress, July 2026
- Federal Reserve: H.6 Money Stock Measures
- Bureau of Labor Statistics: Consumer Price Index, June 2026
- FRED: S&P 500 (SP500)
- FRED: 10-Year Treasury Constant Maturity Minus 2-Year (T10Y2Y)
- FRED: ICE BofA US High Yield Index Option-Adjusted Spread (BAMLH0A0HYM2)
- FRED: Secured Overnight Financing Rate (SOFR)
- FRED: CBOE Volatility Index (VIXCLS)
International Institutions
- IMF: World Economic Outlook Update, July 2026 — Global Economy in Crosscurrents of War and Technology
- IMF: World Economic Outlook, April 2026 — Global Economy in the Shadow of War
Energy, Trade and Geopolitical Data
- Congress.gov / CRS: Iran Conflict and the Strait of Hormuz — Impacts on Oil, Gas, and Other Commodities
- CSIS: The Strait of Hormuz in 8 Charts
- Wikipedia: 2026 Strait of Hormuz Crisis
- CNBC: Analysts Warn of Supply Risks as Oil Prices Return to Pre-War Levels
- United Against Nuclear Iran: Iran War Shipping Update, May 11, 2026
Market and Fiscal Data
- CNBC: A July Rate Hike From the Fed? The Odds Are Rising
- CNBC: Inflation Breakdown for June 2026 — In One Chart
- Fortune: US Debt Draws Weaker Demand as $10 Trillion Must Be Rolled Over Amid Iran War
- Committee for a Responsible Federal Budget: Weak Auctions Underscore Risks of Our Growing Debt Burden
- GAO-26-107529: Federal Debt Management — Treasury Is Meeting Borrowing Needs but the Deteriorating Fiscal Outlook Poses Risks
- ZeroHedge: Massive AI Debt Issuance — Main Driver Behind Jump in Global Credit Impulse
- MyGoldCalc: Gold Price, July 2026
Internal Research
- Era Global Risk Index
- Era CrisisMeter Explained
- Top Global Geopolitical Risks in 2026
- M2 Money Supply Explained
- Yield Curve Explained
- What Is Stagflation? Central bank capitulation concept
— Nikolai Fainizkii, CEO & Senior Analyst, Era of Change



