Executive Summary
E.R.A. OF CHANGES set its end-2026 gold price target at $3,100–$3,200 per ounce. Gold traded above that range at the June 25 interim observation; the end-2026 score remains pending: the World Gold Council reports an LBMA PM price of $4,001.80/oz on June 25, 2026. Source. Source 2.
The June price observation shows that gold traded above the original range before year-end; it does not determine the December score. The structural thesis remains a framework to test, and the move occurred faster than the forecast anticipated. Three forces drove gold higher than the initial forecast anticipated: central banks bought at a pace that exceeded even the elevated 2022–2025 baseline, the U.S. fiscal trajectory deteriorated faster than projected, and geopolitical stress in the Middle East in 2026 compressed what would ordinarily have been a multi-year structural repricing into a single calendar year.
The analytical framework Era built (real interest rates, U.S. fiscal and monetary interaction, and persistent official-sector demand) remains valid going into Q4. What changed was the timing, not the architecture.
This article lays out that framework in full: what drives gold, why the traditional real-rate headwind largely failed to contain it in 2026, where the structural arguments remain intact, and, critically, what conditions would cause Era to turn bearish. A serious forecast requires stating what would make it wrong.
Key Takeaways
- E.R.A. OF CHANGES’ original end-2026 gold price target was $3,100–$3,200/oz. Gold traded above that target at the June 25 interim observation; the December score remains pending. The World Gold Council reports an LBMA PM price of $4,001.80/oz on June 25, 2026. Source.
- Real interest rates (specifically the 10-year TIPS yield) remain the most important medium-term variable for gold; the TIPS yield stands at 2.62% as of September 21, the highest level in nearly 18 years. Source. Source 2.
- Gold’s advance despite historically elevated real yields reflects the dominance of structural central-bank demand and fiscal-monetization risk over the traditional inverse yield relationship.
- The World Gold Council expected significant central-bank buying in 2026, but below 2025’s 863 tonnes; its H1 reported data showed Poland +82t, Uzbekistan +41t, and China +40t. Source. Source 2. Source 3.
- The U.S. budget deficit has been revised to $2.1 trillion for fiscal year 2026 (5.8% of GDP), with net interest expense crossing $1.0 trillion for the first time in history.
- Era’s bearish invalidation requires two simultaneous conditions: radical U.S. fiscal consolidation and AI-driven productivity disinflation without recession. Neither is present today.
- Central-bank demand differs structurally from ETF demand: the ounces enter reserve portfolios with multi-year holding horizons and do not reverse on a rate announcement.
- The end-2026 forecast remains pending until the December 2026 London PM fix, when E.R.A. OF CHANGES will score it against the original $3,100–$3,200 target on the Forecast Scoreboard.
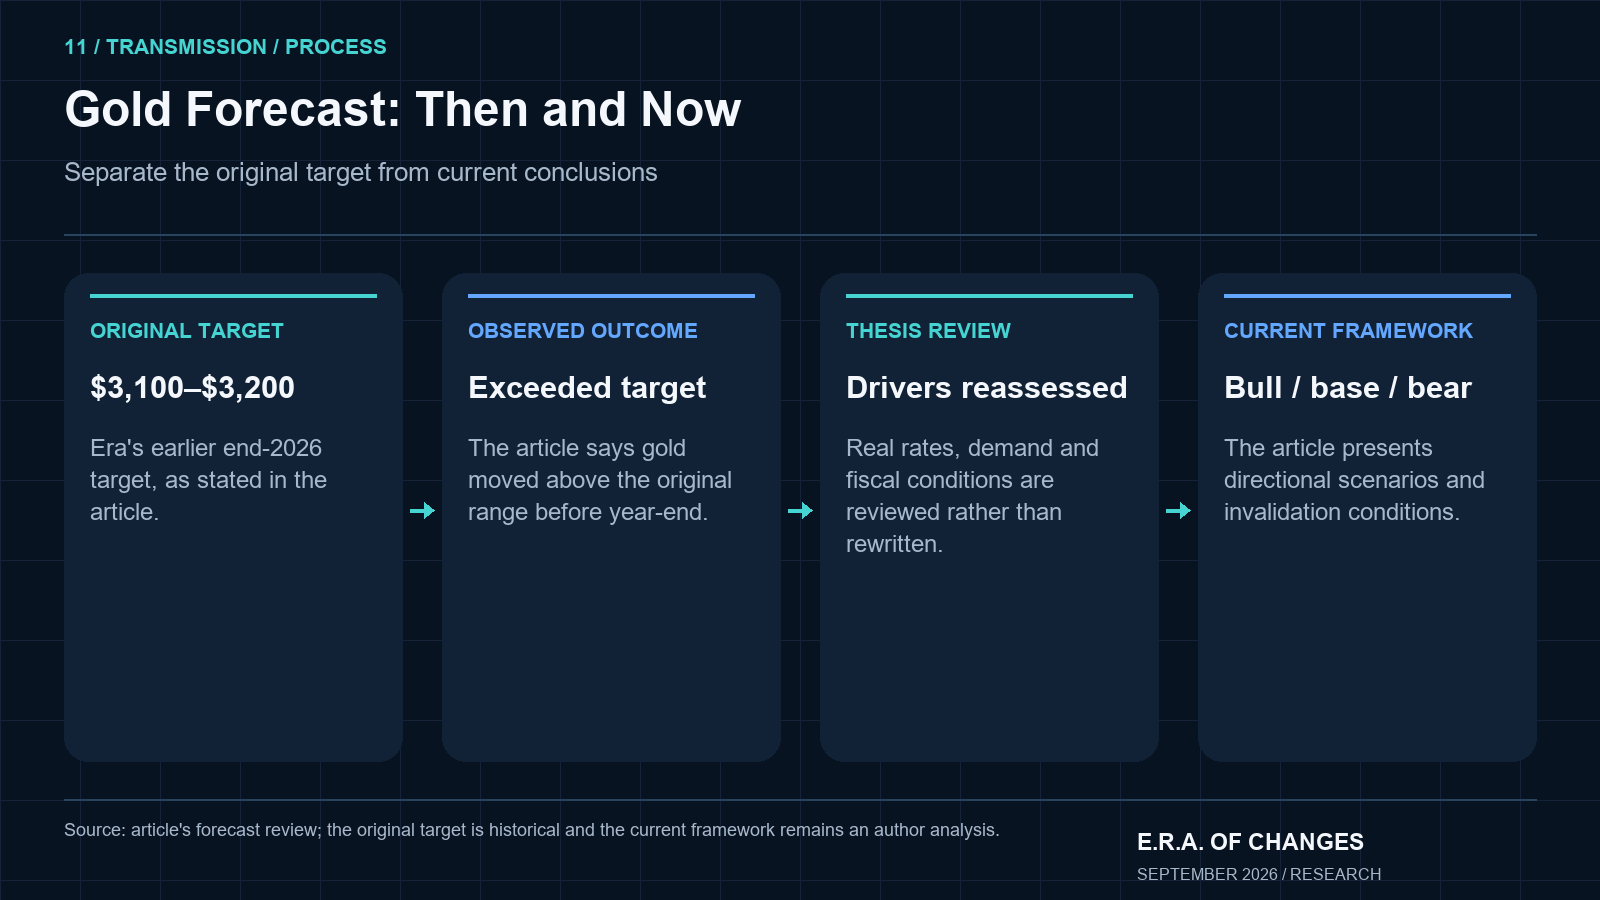
Era’s $3,100–$3,200 Forecast and What Actually Happened
E.R.A. OF CHANGES originally set an end-2026 target of $3,100–$3,200 per ounce. At the June 25 interim observation, the World Gold Council reported an LBMA PM price of $4,001.80/oz, above that original target. The December 2026 result remains pending. Source.
Let me be direct about what this means. The forecast was too conservative. The structural forces Era identified (real-rate dynamics, fiscal pressure, and persistent official-sector buying) were all present and correct. The underestimate was in how quickly they would interact with the geopolitical shock that emerged in the Middle East in 2026 and how much the acceleration of U.S. debt costs would compress a multi-year structural repricing into a single year.
The June interim price exceeded the original range, but that observation does not resolve the end-2026 target. The original $3,100–$3,200 range remains the forecast criterion; the December London PM fix will determine the score. Era will report the result against that original horizon.
What I find more analytically significant than the price itself is where real yields stand today. The 10-year TIPS yield printed 2.62% on September 21, the highest real yield in approximately 18 years. The WGC-reported LBMA PM price was $4,001.80/oz on June 25, while FRED records a 2.62% real yield on September 21. Because these are not same-day observations, I would not use them as a direct price/yield comparison; the structural demand backdrop still merits attention. Source. Source 2. Source 2.
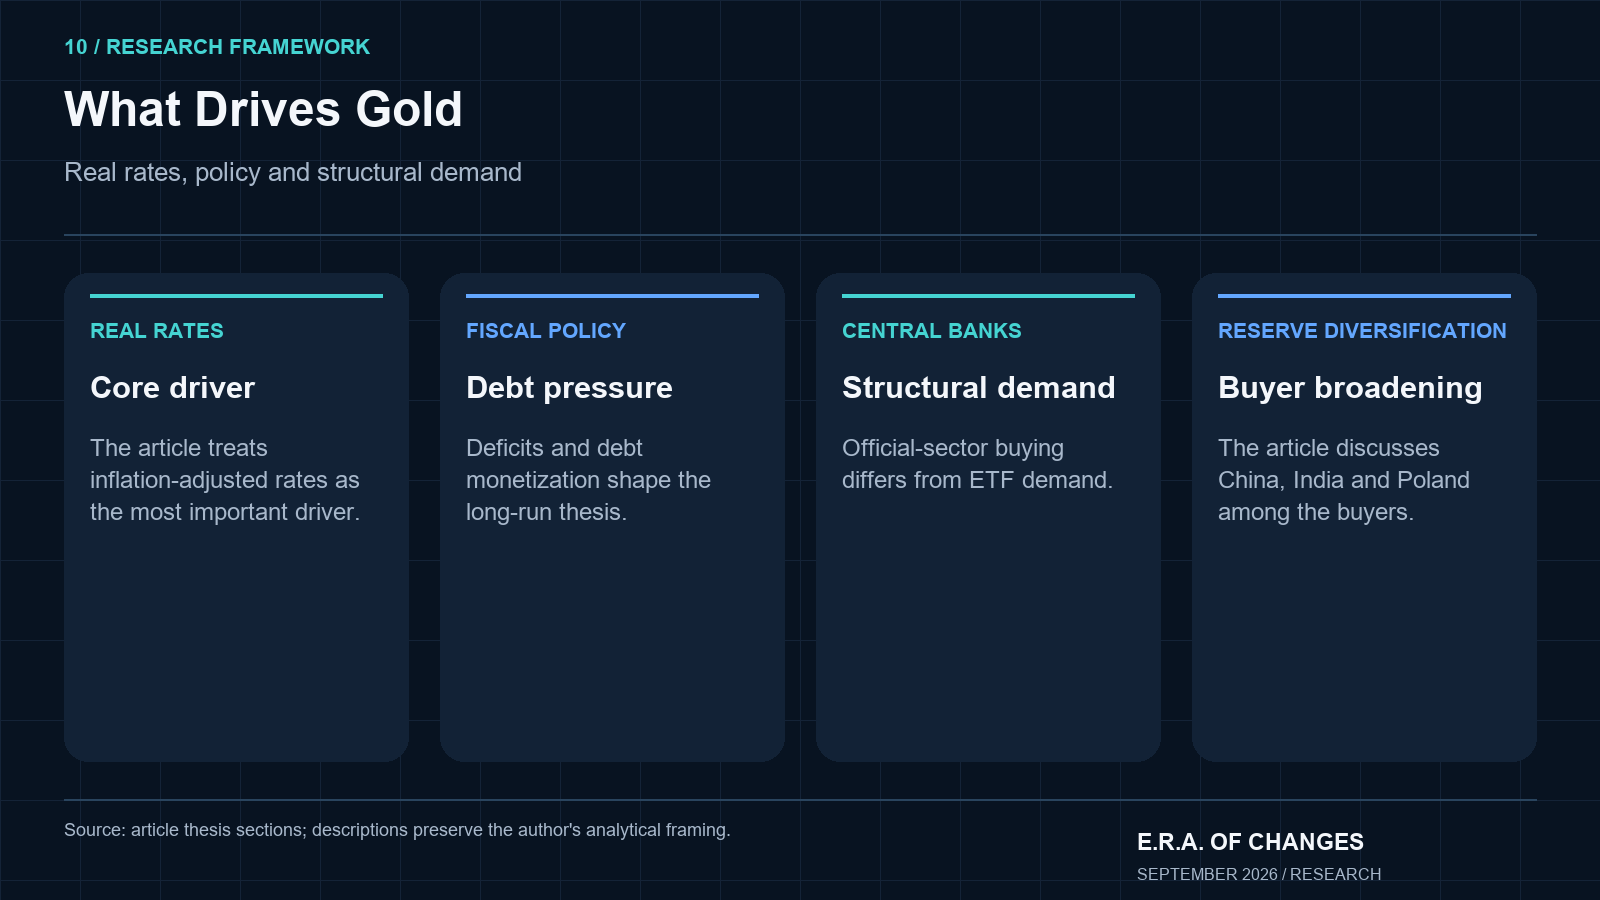
The Two Variables That Drive Era’s Gold Thesis
Before explaining why the traditional real-rate framework partially broke down in 2026, it is worth stating clearly what Era’s gold thesis is built on, and what it is not built on.
The thesis rests on three structural forces. Real interest rates remain the most important variable on a twelve-to-eighteen-month horizon. The trajectory of U.S. fiscal deficits and how they interact with monetary policy (the debt-monetization and fiscal-dominance dynamic) matters over a multi-year horizon. And central-bank reserve diversification represents a structural shift in physical demand that transcends any single rate cycle.
This is not a geopolitical-fear trade. Geopolitical shocks can accelerate gold’s movement, but they do not sustain it. What sustains it is the monetary-fiscal regime. The Iran escalation in 2026 added velocity to a move already in progress; it did not create the thesis.
Real Interest Rates: The Most Important Gold Driver
Gold pays no coupon. It produces no cash flow. When investors hold gold, they forgo the return available on government bonds or money-market instruments. The real cost of that choice is measured by the inflation-adjusted yield: what investors would earn in purchasing-power terms by holding Treasuries instead.
When real yields fall, the opportunity cost of holding gold shrinks. Gold becomes comparatively more attractive, and capital rotates toward it. When real yields rise sharply, bonds offer more compelling competition, and gold faces genuine headwinds. This relationship held fairly reliably from approximately 2004 through 2021.
What the relationship does not tell you is what happens when the fiscal sustainability of those bonds becomes uncertain. Or when the sovereign issuing them has frozen a peer competitor’s reserves. Or when the institutions buying gold are not speculative funds chasing momentum but reserve managers operating on decade-long allocation horizons.
The 10-year TIPS yield stands at 2.62% as of September 21, 2026, near an 18-year high. That is a substantial real return available in U.S. government bonds. Historically, a real yield at that level would be expected to cap gold significantly. Gold’s LBMA PM benchmark had reached $4,001.80/oz on June 25; FRED records a 2.62% 10-year real yield on September 21. These different-date observations are not a same-day comparison, but in my view they underline how much the structural demand backdrop has shifted since 2021. Source. Source 2. Source 2.
Era continues to monitor the TIPS yield as the primary short-term gold signal. The How Interest Rates Affect Markets article runs through the transmission mechanism in detail. For gold specifically: watch the 5-year real yield for near-term positioning signals and the 10-year for structural direction. A sustained move toward 3% real yields would represent a genuine headwind even in the current environment, but that headwind must be weighed against the tailwinds operating simultaneously.
Why a Fed Rate Cut Alone Does Not Guarantee a Gold Rally
This nuance matters because retail commentary around gold consistently conflates nominal policy rates with the real yield that actually drives the metal.
Consider a scenario where the Fed cuts the nominal funds rate by 50 basis points. If inflation expectations simultaneously fall by 100 basis points, real yields actually rise. Gold faces headwinds from a Fed that just cut rates. Conversely, if the Fed holds nominal rates flat while inflation expectations rise by 100 basis points, real yields fall and gold becomes more attractive, even with no policy easing.
This is why Era focuses on TIPS yields and inflation breakevens rather than just Fed communication. The 5-year inflation breakeven and the 10-year TIPS yield together tell you more about gold’s near-term direction than any rate decision in isolation. The Inflation Forecast H2 2026 article covers the U.S. CPI trajectory and the conditions under which inflation expectations might shift meaningfully in Q4. That context is directly relevant to anyone holding a gold position into year-end.
Gold and the U.S. Fiscal Deficit
The second pillar of Era’s gold thesis is structural and operates over a longer horizon than rate cycles. The United States is running a fiscal deficit of $2.1 trillion in fiscal year 2026 (5.8% of GDP), revised upward by $200 billion from the Congressional Budget Office’s February estimate. Net interest expense on the federal debt has crossed $1.0 trillion for the first time in history.
A decade ago, net interest consumed approximately $230 billion annually. Today it exceeds the entire defense budget. And unlike discretionary spending, interest expense is non-negotiable: it grows automatically as the debt compounds and as existing paper matures and is refinanced at higher current rates. The CBO projects net interest payments totaling $16.2 trillion over the next decade, rising from $1.0 trillion in 2026 to $2.1 trillion in 2036.
Era’s gold thesis is not simply that large deficits are bullish for gold. The thesis is more specific: persistent deficits at elevated debt levels create a structural tension between price stability and debt-service sustainability. The higher the Fed holds real rates, the more expensive government debt becomes, the faster interest expense grows, and the stronger the political and market pressure for the financial system to eventually accommodate that burden: through lower rates, monetary expansion, or both. This dynamic is what I mean by fiscal dominance as a long-run tail risk. It does not happen overnight. It accumulates over cycles. And it provides the foundation for gold’s long-term thesis regardless of where the TIPS yield sits today.
The Global Debt Risks 2026 report covers the broader sovereign debt context. The M2 Money Supply explainer is worth reading alongside this section for understanding how monetary accommodation, when it eventually arrives, transmits through financial markets.
What “Debt Monetization” Actually Means
The term debt monetization gets misused, so let me define it carefully because precision matters to the thesis.
Monetization in the strict sense refers to situations where a central bank directly creates money to fund government expenditure, bypassing the market entirely. That is not what is happening in the United States today. The concept Era tracks is subtler: fiscal dominance through constraint. This occurs when a central bank finds itself unable to maintain the restrictive monetary conditions it would otherwise choose, because doing so creates intolerable fiscal costs for the government it serves.
The practical question is not whether the Fed will formally print money to fund the deficit. The question is whether, over the course of the next rate cycle, the Fed will be willing to hold real rates at 2.5% or above for as long as anti-inflation orthodoxy would require, given that every additional month of 2.5% real rates adds tens of billions to the government’s annual debt-service burden. Era’s view is that this constraint tightens over time. That is the channel through which fiscal conditions feed into the gold thesis.
Central Banks Are Changing the Gold Market
The second reason gold behaved differently from its historical real-yield relationship in 2026 is the structural shift in who is buying it.
The World Gold Council’s July outlook expected 2026 central-bank net demand to finish below the 2025 total of 863 tonnes. In H1 2026 alone, the leading purchasers were Poland at 82 tonnes, Uzbekistan at 41 tonnes, China at 40 tonnes, and Kazakhstan at 27 tonnes. Eighty-nine percent of central bankers surveyed by the World Gold Council in 2026 expect global official gold reserves to increase further over the next twelve months. Source. Source 2.
These are not speculative positions. They are reserve allocations made by sovereign institutions that do not set stop-losses, do not respond to Reuters headlines, and do not liquidate because the Fed minutes sounded more hawkish than expected. When substantial net purchases enter official reserve portfolios, they do not come back to market on the next FOMC announcement. They sit. They compound. And they remove physical supply from a market where mine production runs approximately 3,300 to 3,500 tonnes per year. Source.
This is the structural demand argument, and it is qualitatively different from what drove the 2010–2012 gold bull market or the 2020 COVID-era spike.
Why Central-Bank Buying Differs From ETF Demand
Gold ETFs, the SPDR Gold Trust (GLD), iShares Gold Trust, and their equivalents, represent investment-grade gold exposure for institutional and retail investors. Their flows are important. But they behave differently from official-sector demand in ways that matter for understanding gold’s medium-term floor.
ETF investors respond to real yields, price momentum, and macro sentiment. In a rising-real-yield environment, ETF holders reduce positions. That is normal and rational behavior. Central-bank reserve managers operate on a different mandate. Their objective is to maintain reserves that are liquid, safe, and independent of any single issuer’s creditworthiness: objectives that gold satisfies regardless of what TIPS yields are doing in any given quarter.
Central-bank holdings represent unusually sticky, long-duration demand because official reserve portfolios turn over far less frequently than speculative investment positions. When Nikolai says these ounces “leave the market,” the phrasing is approximate but it captures something real: official-sector buying absorbs supply in a way that does not reverse on a rate decision.
Gold, Reserve Diversification, and the Freezing of Russian Reserves
The demand pattern I described accelerated after February 2022. Era’s view (and I want to be precise here) is not that the freezing of approximately $300 billion in Russian sovereign reserves caused every subsequent central-bank gold purchase. Different central banks have different mandates, different reserve frameworks, and different political contexts.
What the Russian reserve episode did was make the risk legible in a new way. Before February 2022, the theoretical vulnerability of reserves held inside Western financial infrastructure was a concern that most reserve managers could comfortably bracket as a remote scenario. After February 2022, it became a scenario with documented precedent, executed within days, by institutions capable of repeating the action. Central banks that had been growing gold allocations incrementally did not necessarily accelerate because of Russia specifically, but the internal feasibility argument for holding more gold became considerably easier to make.
Gold carries no foreign-issuer risk, no counterparty exposure, and no dependency on SWIFT access. It is the one widely recognized reserve asset that sits entirely outside the infrastructure that proved vulnerable. This is the de-dollarization vector in Era’s gold thesis, and it connects directly to the De-Dollarization Report. The structural fragmentation of the global reserve system is not fast, not clean, and not inevitable. But gold occupies a unique position as the one asset that sits outside every sphere simultaneously.
China, India, Poland, and the Broadening Buyer Base
China’s officially reported gold reserves stood at approximately 2,264 tonnes as of mid-2026, reflecting net purchases of 40 tonnes in H1. The official figure likely understates aggregate sovereign-sector exposure: the People’s Bank of China paused official purchases during portions of 2024 and early 2025 only to resume them, and reporting lags can extend to ninety days or more. The relevant signal is the multi-year accumulation trend, not any single month’s reported change.
India’s Reserve Bank of India has been a consistent net buyer since 2022. Poland’s 82-tonne purchase in H1 2026 represents one of the most aggressive official-sector accumulation campaigns among a NATO member state: a strategic reorientation toward physical assets that reflects Poland’s geographic exposure and its recognition that reserve architecture carries real geopolitical risk. Poland now holds approximately 390 tonnes, having roughly doubled its reserves over five years.
The broadening of the buyer base matters analytically. When gold buying was primarily a China-and-Russia story, it was straightforward to attribute the behavior to a specific geopolitical posture. When it includes Poland, India, Singapore, Uzbekistan, Kazakhstan, and a growing list of emerging-market central banks with no particular alignment with either Beijing or Moscow, the structural demand argument becomes considerably harder to dismiss.
Era Analyst’s Perspective
Poland’s 82-tonne gold purchase in the first half of 2026 deserves more attention than it has received in mainstream gold commentary. Poland is a NATO member, a significant recipient of Western defense guarantees, and a country with direct geographic exposure to the conflict in Ukraine. It is not a country one would expect to be structurally diversifying away from Western financial infrastructure on geopolitical grounds.
Yet here we are. Poland has nearly doubled its gold reserves over five years and sits as the single largest central-bank gold buyer in H1 2026. The explanation is not anti-Western sentiment: it is rational risk management in response to the demonstrated fact that sovereign reserve assets inside foreign financial systems can be frozen without due process if the political conditions align.
When a country firmly within the Western alliance architecture reaches for gold over additional U.S. Treasury bonds, the signal is about systemic risk management, not ideological positioning. And when the World Gold Council reports that 89% of central bankers surveyed in 2026 expect official gold reserves to increase further over the next twelve months, that signal is not a temporary sentiment reading. It is a structural reallocation that will take years to complete, and which absorbs physical supply at a rate that the mine production base cannot quickly offset.
Gold and Inflation: More Complicated Than Most Investors Think
Gold is frequently described as an inflation hedge, and in the very long run (across decades) that description holds. In any given two-to-three-year window, the relationship is messier and depends heavily on the policy response to inflation.
High inflation combined with strongly negative real rates (as in 2020–2022) creates an environment highly supportive of gold. High inflation combined with aggressive monetary tightening that pushes real rates into significantly positive territory creates genuine headwinds, as the 2022 correction demonstrated clearly. The more precise framing is to treat gold as a monetary-regime asset: it performs well when confidence in the monetary regime is uncertain, when real rates are low or falling, and when fiscal conditions undermine the credibility of the debt the central bank is implicitly backstopping. What Causes Inflation is a useful complement to this section for understanding the underlying price-level dynamics. The key insight for gold holders is that it is not how fast prices are rising that matters: it is whether investors trust the monetary authority to contain those prices without destabilizing the fiscal system in the process.
Gold and Recession Risk
A growth slowdown creates a specific transmission mechanism for gold. When growth weakens, the Fed typically eases; nominal rates fall; and depending on the inflation trajectory, real yields may decline, improving gold’s competitive position. That is the standard recessionary scenario for gold, and it is broadly supportive on a six-to-twelve-month horizon.
The more complex scenario is a severe liquidity crisis (a 2008-type event) where forced selling and dollar demand can temporarily pressure gold despite the ultimately bearish implications for real rates. Gold sold off sharply in September and October 2008 before recovering strongly through 2009 and 2010. The lesson is not that gold is a poor crisis hedge. It is that the initial phase of a liquidity crisis can overwhelm fundamental support temporarily before the structural bull case reasserts. Era’s Global Recession Probability analysis provides the current assessment of that risk in this cycle. The interaction between a $2.1 trillion deficit, $1 trillion in annual interest expense, and a Federal Reserve that just raised rates again in September 2026 creates a specific path dependency for how gold trades through any potential slowdown.
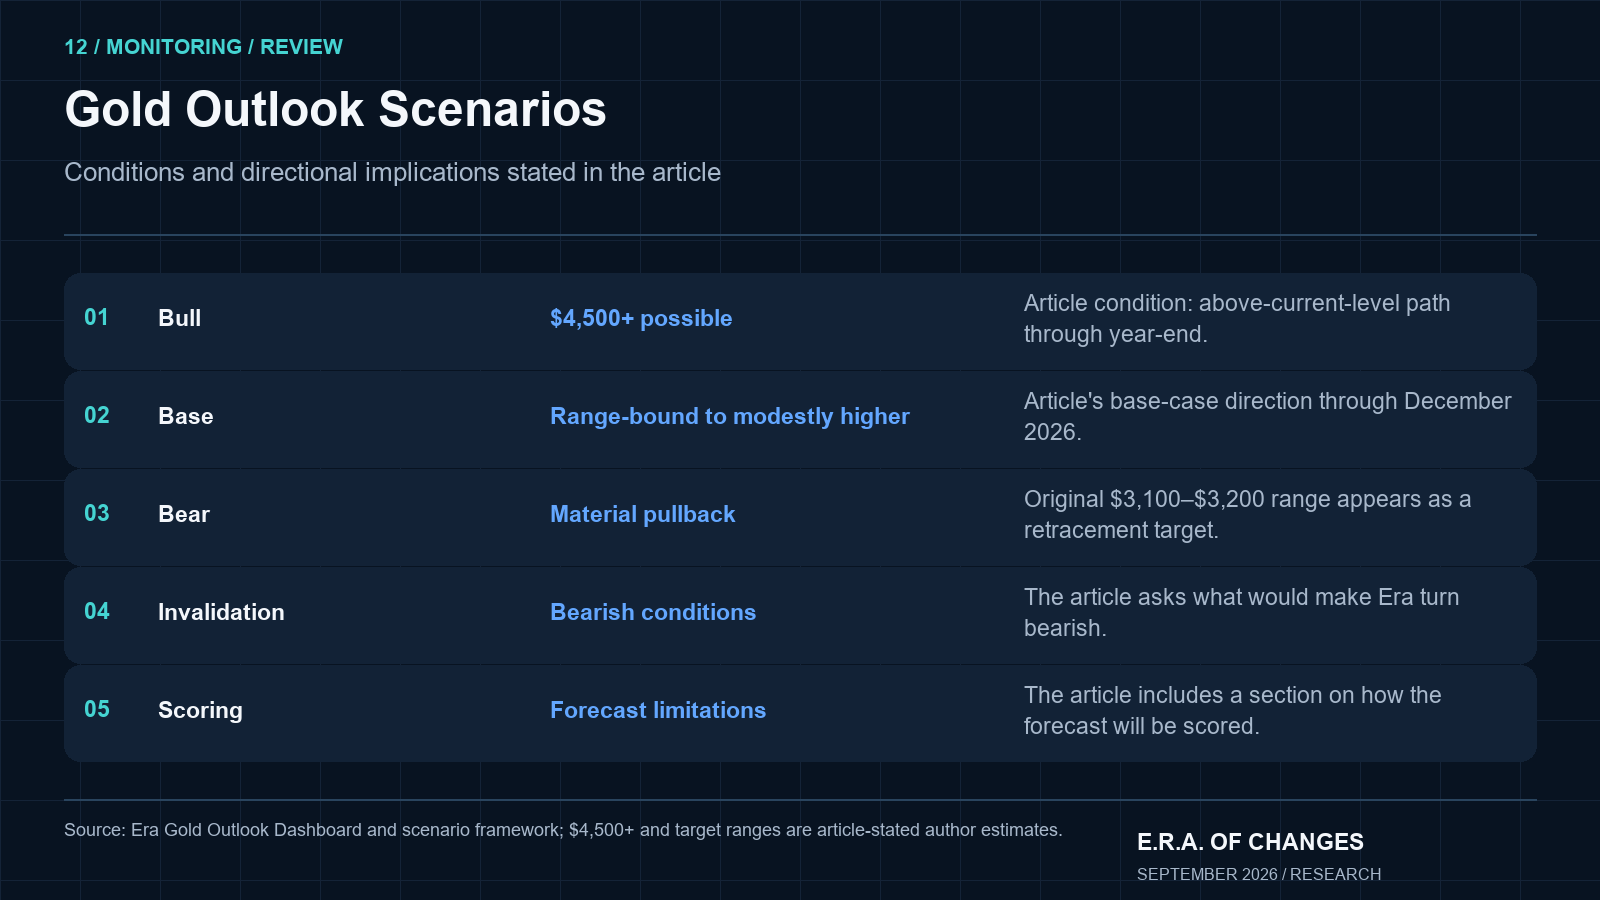
Era’s Gold Bull, Base, and Bear Framework
Scenario | Macro Conditions | Gold Implication |
|---|---|---|
Bull | Real yields fall from current 2.62% toward 1.5% or below; fiscal pressure accelerates; central-bank buying exceeds the WGC’s qualitative 2026 outlook Source. Source. Source 2. | Above current levels; $4,500+ possible through year-end |
Base | Elevated real yields constrain further upside; Central-bank buying remains significant but below the 2025 total; fiscal trajectory stable Source. | Range-bound to modestly higher through December 2026 |
Bear | Fiscal consolidation becomes credible + AI-driven productivity disinflation without recession | Material pullback; original $3,100–$3,200 range possible as retracement target |
E.R.A. OF CHANGES does not attach probabilities to these scenarios without Nikolai’s explicit approval. The framework is provided as a structured way to think about what conditions would move gold materially in either direction from current levels. The original $3,100–$3,200 end-2026 forecast remains the criterion for scoring. Its overlap with the bear-case retracement range in this updated scenario framework does not change the original forecast or its evaluation horizon.
What Would Make Era Turn Bearish on Gold
The most important section of this article is the falsification condition. A forecast that cannot be proven wrong is not a forecast: it is an opinion with a number attached. Here is precisely what would cause Era to turn structurally bearish on gold.
1. Radical U.S. Fiscal Consolidation
The first condition requires not incremental deficit reduction but a structural shift in the fiscal trajectory. A federal deficit moving credibly toward surplus (or falling sharply and sustainably toward 2% of GDP or below) would remove the core of Era’s long-run gold thesis. It would reduce Treasury issuance pressure, lower the debt-service burden, and eliminate the structural argument for eventual monetary accommodation. The CBO’s FY2026 projection of $2.1 trillion and $1.0 trillion in interest expense represent the current starting point. That starting point is moving in the wrong direction by a significant margin.
2. AI-Led Productivity Creates Structural Disinflation Without Recession
The second condition is more novel and represents one of Nikolai’s most important analytical contributions to the gold thesis. If artificial intelligence generates productivity improvements of sufficient magnitude to deliver persistently lower unit costs and lower inflation (without triggering a recession, without a credit shock, without mass unemployment), the result is structural disinflation through real growth. In that scenario, the Fed’s task becomes easier, real rates normalize organically, and gold loses both the inflation hedge and monetary-uncertainty arguments simultaneously.
This is the scenario in which technology renders the fiscal-dominance thesis partially obsolete, because higher productivity growth makes the debt burden more manageable relative to a larger economy. It is not a base case for 2026–2027. It is a scenario Era must monitor actively as AI adoption scales.
Why Both Must Happen Simultaneously
This is the critical analytical point. Fiscal consolidation alone does not guarantee a bearish gold regime. If austerity triggers a recession, the resulting monetary easing may support gold even as the deficit shrinks temporarily. A productivity boom alone does not guarantee bearish conditions if fiscal deficits remain large and debt continues to compound at current rates. Era’s strongest bearish scenario requires both forces operating simultaneously: a fiscal improvement large enough to reduce debt-service pressure and a productivity-led disinflation strong enough to make that improvement durable. That is a considerably more demanding invalidation condition than most gold bears are willing to acknowledge.
Era Gold Outlook Dashboard
Indicator | Bullish | Neutral | Bearish | Current Reading |
|---|---|---|---|---|
10Y TIPS real yield | Falling toward 0% | Stable 1.0–2.0% | Rising above 3.0% | |
U.S. fiscal deficit | Widening | Stable | Sharp consolidation | $2.1T / 5.8% GDP: bullish |
Fed liquidity | Expanding | Stable | Contracting | Contracting; 25bp hike Sep 2026 |
Central-bank demand | Stronger than WGC’s qualitative 2026 outlook Source. | Consistent with WGC’s qualitative 2026 outlook Source. | Sharp decline below 500t | WGC expects significant buying below 2025; bullish support remains conditional Source. |
Dollar (DXY) | Weakening | Stable | Strengthening | Monitor |
ETF flows | Inflows | Flat | Outflows | Monitor |
AI productivity signal | None | Emerging | Structural disinflation | None at scale |
Dashboard updated: September 23, 2026. Update monthly through December 2026.
How Era Forecasts Gold
Era’s gold methodology sits at the intersection of four analytical frameworks. Monetary conditions (real yields, Fed policy, balance-sheet trajectory) provide the primary short-term signal. Fiscal conditions (deficit trajectory, interest expense, debt-service burden) provide the medium-to-long-term structural thesis. Reserve behavior (official-sector accumulation, FX reserve composition) provides the demand-side structural floor. Physical market dynamics (mine supply growing approximately 1–2% per year globally, jewelry demand elasticity to price, and Asian market premiums) provide supply-side context.
Gold supply responds far more slowly than financial assets to price signals. A higher gold price can improve mining economics and exploration budgets, but new mine production typically requires five to ten years from discovery to first pour. Recycling provides a more responsive cyclical release valve (high prices encourage jewelry recycling and scrap supply), but not at a scale that offsets sustained structural demand from official buyers.
The Era Forecasting Methodology article explains how these frameworks are assembled into a systematic view. The Era CrisisMeter tracks systemic stress indicators that interact with gold via the safe-haven and liquidity channels. The Era Global Risk Index provides the underlying systemic stress reading that informs all Era asset-class forecasts.
Forecast Limitations
Gold prices can overshoot analytical models by margins that embarrass even reasonable targets: our original $3,100–$3,200 forecast is an interim example; its end-2026 score remains pending. Geopolitical shocks are difficult to time: the 2026 Middle East escalation compressed what might have been a 2026–2027 structural move into a single year. Central-bank purchase data is reported with lags of up to ninety days and may be revised; the World Gold Council’s preliminary figures are the best available data, not the final record.
ETF flows can reverse rapidly: a single high-profile fund outflow creates short-term price dislocation independent of fundamentals. Real-rate relationships are not stable across every monetary regime; the current partial breakdown of the inverse gold-yield relationship is itself a structural signal, not a permanent fixture. Official reserve data may be incomplete: China’s reported holdings in particular carry well-documented reporting delays. And all forecasts reflect the information available at data cutoff: September 23, 2026.
The $3,100–$3,200 range is the original end-2026 forecast. Gold traded above it by June 25, an interim observation; the final score remains pending until the December London PM fix.
How This Forecast Will Be Scored
E.R.A. OF CHANGES will record the December 2026 London PM fix against the original $3,100–$3,200 target on the Era Forecast Scoreboard. Until that observation, the outcome remains pending. The June move above the target is an interim observation, not the final score; the original horizon and target remain unchanged.
Forecast Component | Status |
|---|---|
Directional call (gold higher) | Pending, December 2026 observation outstanding |
End-2026 target ($3,100–$3,200) | Pending, December 2026 observation outstanding |
Real-rate thesis | Intact; elevated TIPS yields partially offset by structural demand |
Fiscal-dominance thesis | Strengthened; $2.1T deficit, $1T interest expense |
Central-bank demand thesis | H1 net purchases: 345t; full-year total not yet known Source. |
Bearish invalidation conditions | Neither present |
This is what separates a forecast operation from a prediction service. Any analyst can say gold will go up. What Era is building is a documented, reproducible framework that tells you exactly what conditions drive the call: so that when it is right, you know why, and when it is wrong, you know which assumption failed.
Frequently Asked Questions
What is the gold price forecast for 2026?
E.R.A. OF CHANGES originally set an end-2026 target of $3,100–$3,200 per ounce. Gold traded above that original target at the June 25 interim observation; the December 2026 result remains pending. The World Gold Council reported an LBMA PM price of $4,001.80/oz on June 25. E.R.A. OF CHANGES’ updated base case is a separate current scenario and does not revise the original target or its scoring horizon. Source.
What drove gold to over $4,300 in 2026?
Three forces converged. The World Gold Council reported 345 tonnes of net central-bank purchases in H1 2026 and expected full-year demand below 2025’s 863 tonnes (led by Poland at 82 tonnes in H1 2026 and China at 40 tonnes in H1), creating structural physical demand that does not respond to quarter-to-quarter yield movements. The U.S. fiscal trajectory deteriorated, with the deficit revised to $2.1 trillion and net interest expense crossing $1 trillion for the first time. And a geopolitical shock in the Middle East compressed what might have been a multi-year structural repricing into a single calendar year. Source. Source 2. Source 3.
How do real interest rates affect gold?
Real interest rates (nominal Treasury yields minus inflation expectations) represent the opportunity cost of holding gold. When real yields fall, gold becomes more attractive relative to bonds. When real yields rise sharply, bonds offer more compelling competition. The 10-year TIPS yield stands at 2.62% as of September 21, 2026 (near an 18-year high), which is historically a bearish signal for gold. The WGC-reported LBMA PM price had reached $4,001.80/oz on June 25, while the 2.62% FRED real-yield reading is dated September 21. Those readings are consistent with, but do not establish, the author’s interpretation that structural demand and fiscal-dominance concerns are outweighing the traditional relationship. Source. Source 2. Source 2.
Why are central banks buying so much gold?
Central-bank motivations are not uniform, but Era identifies three principal drivers: reserve diversification away from any single foreign-issuer asset; geopolitical reserve risk made concrete by the February 2022 freezing of Russian sovereign reserves; and the secular shift toward holding reserve assets that carry no counterparty exposure and require no foreign financial infrastructure. Gold is the only widely recognized reserve asset satisfying all three criteria simultaneously. The World Gold Council reports that 89% of central bankers surveyed in 2026 expect global official gold reserves to increase further over the next twelve months.
Does U.S. government debt affect gold prices?
Yes, through two channels operating at different time horizons. In the near term, large Treasury issuance exerts upward pressure on yields, which can be a headwind for gold via the real-rate mechanism. Over the medium to long term, persistent deficits at the current scale ($2.1 trillion in FY2026, with $1 trillion consumed by interest expense alone) create structural pressure for the monetary system to eventually accommodate that burden. When investors begin pricing in that accommodation ahead of the actual policy shift, gold tends to benefit. The Global Debt Risks 2026 report covers the full sovereign debt context.
Is gold a good inflation hedge?
In the very long run, yes. Over shorter horizons of two to four years, the relationship depends heavily on the policy response to inflation rather than the inflation rate itself. High inflation with strongly negative real rates (as in 2020–2022) is highly supportive of gold. High inflation with aggressive tightening that moves real rates significantly into positive territory creates genuine headwinds, as 2022 demonstrated. Era frames gold as a monetary-regime asset: what matters is not how fast prices are rising, but whether investors trust the monetary authority to contain those prices without destabilizing the fiscal system in the process.
How does a recession affect gold?
A growth slowdown that leads to Fed easing, falling nominal yields, and declining real yields typically supports gold on a six-to-twelve-month horizon. The complication is the initial phase of a severe liquidity crisis (2008-style) where forced selling and dollar demand can create sharp temporary drawdowns before the structural bull case reasserts. Gold sold off sharply in September–October 2008 before a powerful multi-year recovery began. Era’s Global Recession Probability analysis provides the current assessment of that risk in this cycle.
Could AI productivity make gold prices fall?
Yes, under a specific and demanding set of conditions. Era’s bearish invalidation scenario requires AI-driven productivity growth to be large enough to produce structural disinflation without recession. This would lower unit costs, reduce inflation pressure, and allow the Fed to achieve price stability without suppressing real rates to the point of fiscal strain. It would also make the government’s debt burden more manageable relative to a larger economy. That scenario is not impossible; it is not Era’s base case for 2026–2027. And critically, it must be combined with genuine U.S. fiscal consolidation for Era to turn structurally bearish.
What would make Era revise its gold outlook downward?
Two conditions must materialize simultaneously: the U.S. fiscal trajectory must improve credibly and substantially (a deficit moving toward 2% of GDP or lower), and artificial-intelligence productivity must deliver sustained non-recessionary disinflation. Either condition alone is insufficient. Fiscal consolidation through recession would likely produce gold-supportive monetary easing. An AI productivity boom without fiscal discipline leaves the debt-service burden and monetization-risk thesis largely intact. Era’s invalidation requires both.
What is the difference between central-bank gold buying and ETF gold buying?
ETF flows represent investment allocation decisions that respond to real yields, price momentum, and macro sentiment. They can reverse rapidly: a meaningful ETF outflow can occur within days of a hawkish Fed communication. Central-bank reserve portfolios operate with multi-year strategic horizons, low turnover, and objectives largely independent of quarter-to-quarter yield movements. When a central bank adds 20 tonnes to reserves, those ounces are not returning to market because of the next FOMC statement. This structural stickiness is why Era treats official-sector demand as qualitatively different from investment-channel demand when assessing gold’s medium-term floor.
What indicators should investors watch for gold in Q4 2026?
The three most important: the 10-year TIPS yield (a sustained move above 3% real would represent a meaningful additional headwind even in the current environment); the trajectory of central-bank purchases reported by the World Gold Council through Q3 2026; and the evolution of the U.S. fiscal position as additional CBO monthly reviews come through. Secondarily: DXY direction, 5-year inflation breakevens (watch for any break below 2.0% signaling rising real rates through declining inflation expectations), and Middle East developments that affect both safe-haven demand and oil-driven inflation expectations.
How will Era score this gold forecast?
E.R.A. OF CHANGES will score the original $3,100–$3,200 end-2026 forecast against the December 2026 London PM fix. The outcome remains pending; the June price above the target is an interim observation, not the final score. The original target and horizon remain unchanged. Transparent scoring is the standard E.R.A. OF CHANGES applies to all published forecasts. The Scenario Planning for Investors article covers how to build portfolios resilient to forecast uncertainty.
About E.R.A. OF CHANGES
E.R.A. OF CHANGES is an independent macroeconomic research and geopolitical intelligence firm providing institutional-quality analysis to investors worldwide. Our research combines macroeconomics, financial markets, blockchain analytics, and geopolitical risk into proprietary forecasting frameworks designed to identify structural market trends before they become consensus. The Era Global Risk Index (updated daily from 24 structural indicators) serves as the foundation of our analytical methodology, providing a forward-looking measure of systemic financial stress grounded in structural economic evidence rather than market sentiment. Our full methodology, live index reading, and forecast archive are available at eraperemen.info/en.
The content published by E.R.A. OF CHANGES is for informational and educational purposes only and does not constitute financial, investment, legal, or tax advice. All views expressed are the personal analytical perspective of the author. Past forecast accuracy does not guarantee future results. Readers should conduct their own research and consult a qualified financial professional before making any investment decisions.
Sources
Gold Market and Central Banks - World Gold Council: Central Bank Gold Statistics, June 2026 - World Gold Council: Gold Demand Trends Q2 2026: Central Banks - World Gold Council: Central Banks Resume Net Buying in April - Discovery Alert: WGC Survey: Central Bank Gold Purchases Hit Record Highs 2026 - MINING.COM: Central Banks’ Gold Buying Momentum Carries Into 2026 - Fortune: Current Price of Gold, September 21, 2026
Real Yields and Monetary Policy - TIPSWatch: 10-Year TIPS Reopening Gets Real Yield of 2.653%, Highest in Nearly 18 Years (September 17, 2026) - ConvexTrade: 10-Year Real Yield (TIPS), September 10, 2026 - FRED (St. Louis Fed): Market Yield on U.S. Treasury Securities at 10-Year Constant Maturity, Inflation-Indexed
U.S. Fiscal Data - Congressional Budget Office: The Budget and Economic Outlook 2026 to 2036 - Committee for a Responsible Federal Budget: CBO Estimates $1 Trillion Deficit for First Five Months of FY 2026 - Peter G. Peterson Foundation: Interest Costs on the National Debt Are Reaching All-Time Highs



