Executive Summary
The most common mistake in portfolio construction is not picking the wrong asset; it is building a portfolio that can only survive in one macro environment. Most investors, consciously or not, structure their holdings around an implicit base case: they are effectively positioned for growth and moderate inflation, and everything else is a surprise they are not prepared for. When the macro regime shifts (as it shifted in 2022, as it shifted in 2008, as it could shift again given where we are today), they discover that their portfolio was never really a portfolio. It was a bet.
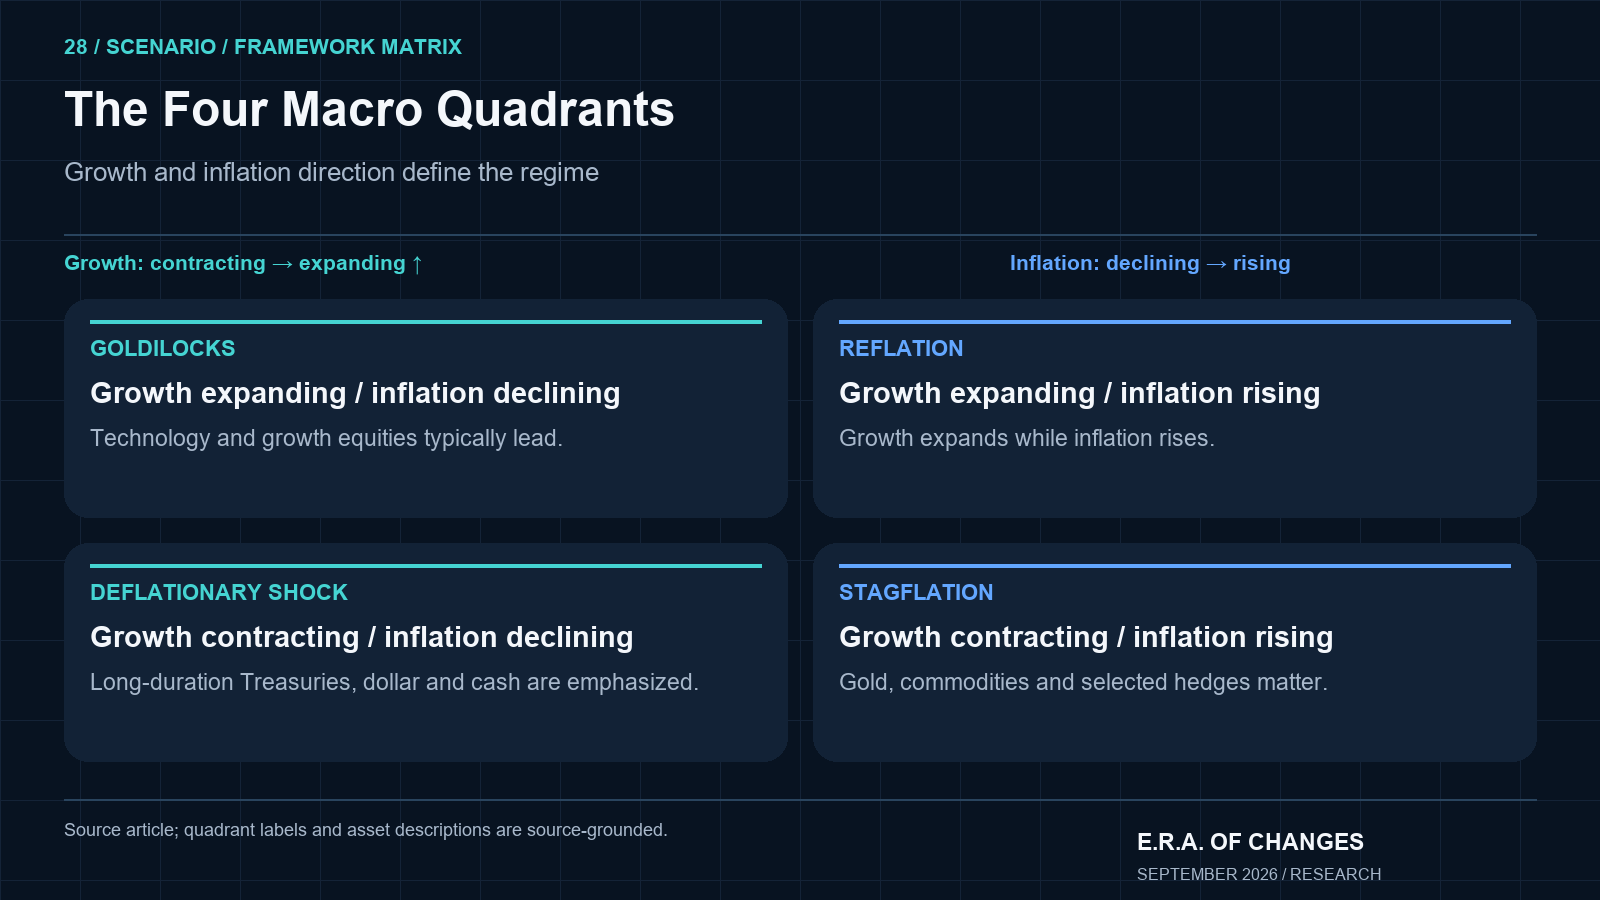
Era’s scenario planning framework builds from a different starting point. We identify two axes that together define most macro regimes: the growth and liquidity axis, which runs from contraction to expansion, and the inflation axis, which runs from declining to sticky or rising. Those two axes produce four quadrants: Goldilocks, Reflation, Stagflation, and Deflationary Shock. The goal of portfolio construction within this framework is not to predict which quadrant the world will occupy in the next twelve months. It is to assemble a portfolio that generates meaningful returns in the base-case scenario while retaining enough exposure to each of the remaining three quadrants that a surprise regime shift does not permanently impair capital. This is not a complicated principle. It is, however, a discipline that most investors do not actually practice.
Key Takeaways
- Most portfolios are implicitly positioned for one macro regime. When the regime changes, they fail.
- Era’s framework uses two axes (growth/liquidity and inflation) to map four distinct macro quadrants, each with different asset leadership.
- The goal is not to predict the single correct quadrant. It is to build a portfolio that profits in the base case and survives the other three.
- Rebalancing should occur quarterly or when a key indicator (the 10-year Treasury yield or the VIX) moves more than two standard deviations from its recent norm. More frequent adjustments are not discipline. They are friction.
- TIPS do not provide uniform protection in all inflationary environments. Rising real yields can compress their prices faster than inflation adjustments can compensate.
- As of September 30, 2026, the 10-year Treasury yield was 5.29% while the VIX closed at approximately 16. That combination places the current environment at a boundary between the Reflation and Stagflation quadrants, which is precisely the environment where getting the framework right matters most. Source. Source 2. Source 3. Source 4.
The Problem With Predicting One Scenario
Let me describe a pattern I have seen repeatedly across institutional and retail investment approaches alike. An investor develops a view (call it a conviction, call it a thesis) about where the economy is heading. The view is intelligent, it is well-researched, and it may even be correct in direction. The investor then builds a portfolio that expresses that single view with as much conviction as possible. When the view is right, the portfolio performs well. When the view is wrong, or simply early, the portfolio is badly positioned for the actual macro environment, and the investor faces either significant drawdown or the uncomfortable choice of exiting a position at a loss.
The problem is not the underlying research. The problem is the architecture. A portfolio structured around a single scenario assumes that the macro environment will evolve in a predictable, linear fashion toward the predicted outcome. It provides no buffer against alternative paths. And macro environments are rarely linear. They are characterized by sudden regime shifts, delayed effects, contradictory signals, and conditions that sit at the boundary between quadrants for extended periods. September 2026 is a useful example: Brent crude trades at approximately $96 per barrel, and the 10-year Treasury yield sits at 5.29%; gold also remains part of the hedge-demand picture. We are simultaneously observing the inflation signals of stagflation and the growth signals of a boom. Any investor positioned purely for one or the other is carrying real risk they may not have priced. Source. Source 2. Source.
Era’s Two-Axis Framework
The framework that Era uses to map macro regimes begins with two questions.
The first question is about growth and liquidity: is the economy in an expansionary phase (where credit is available, employment is healthy, corporate earnings are growing, and net financial-system liquidity is improving), or is it in a contractionary phase, where credit is tightening, activity is slowing, and liquidity is withdrawing from risk assets? This axis captures the forward trajectory of economic conditions rather than the current level of any single indicator.
The second question is about inflation: is inflation declining toward or below central-bank targets, or is it sticky and elevated, resisting the policy tools deployed to contain it? An economy can be expanding while inflation falls, the classic Goldilocks environment. It can be expanding while inflation remains high, the Reflation quadrant. It can be contracting while inflation remains high, Stagflation. Or it can be contracting while inflation falls, the Deflationary Shock that history records in 2008 and 2020.
Those four combinations produce four analytically distinct investment environments, each with different asset-class leadership, different central-bank behavior, and different risk characteristics for portfolios that are not explicitly designed for all of them.
Quadrant 1: Goldilocks (Growth Expanding, Inflation Declining)
The Goldilocks regime is the one most developed-market investors have been implicitly positioned for during most of the 2010s and early 2020s. Growth is positive, credit is available, corporate earnings are expanding, and inflation is low enough that central banks are either cutting rates or leaving policy accommodative. Asset prices benefit from both the earnings growth and the favorable discount rate.
In this environment, technology and growth equities typically lead. Broad equity index funds capture the bulk of returns with low friction. Long-duration bonds provide stable income without significant duration risk as rates hold steady or decline. The cost of carry on hedges is high and the benefit is low, which is why most investors in Goldilocks environments quietly drop their inflation and tail-risk positions, only to discover how exposed they were when the regime shifts.
The clearest modern example runs from roughly 2013 through early 2020. For the clearly defined calendar-year window from the start of 2013 through the end of 2019, the S&P 500’s annual total returns compounded to approximately 162%, including reinvested dividends. The Nasdaq performed even better. TIPS and commodity exposure were significant drags. Gold was flat to negative in real terms for much of the period. An investor who maintained full all-quadrant positioning throughout those years sacrificed meaningful relative performance, which is the honest cost of the framework. The framework’s value is not maximizing return in the best-case scenario. It is avoiding ruin in the worst-case scenario. Source.
Quadrant 2: Reflation and Boom (Growth Expanding, Inflation Rising)
Reflation regimes occur when economic activity accelerates alongside rising prices, often following deep recessions, commodity supply shocks, or periods of monetary expansion that generate demand faster than supply can respond. In this quadrant, the leadership shifts away from long-duration growth equities and toward cyclical companies, energy and materials producers, commodities as a direct asset class, and emerging-market equities that benefit from commodity exports and reflating global demand.
The 2021–2022 period provided a clear modern illustration. The Bloomberg Commodity Index gained approximately 27% in 2021 as supply chains fractured and monetary stimulus met reopening demand. The energy sector (XLE) returned approximately 54% in 2021 and another 66% in 2022. Commodity-linked emerging markets outperformed the broader EM index. Meanwhile, long-duration technology stocks and Treasury bonds experienced the kind of repricing that investors who had never lived through a genuine inflationary period did not anticipate.
In the Reflation quadrant, Era focuses on real assets, commodity exposure, energy and materials, and selective emerging-market equity where the local economy benefits from higher commodity prices. The Emerging Market Investment Risks framework helps identify which EM exposures are commodity-linked and which are net importers that would suffer in this environment: the distinction is not trivial.
Quadrant 3: Stagflation (Growth Contracting, Inflation Elevated)
Stagflation is the most analytically uncomfortable quadrant because it invalidates the standard policy toolkit and produces negative correlation breakdowns across most traditional portfolio structures. When growth is slowing and inflation is high, central banks cannot cut rates to stimulate growth without risking further inflation acceleration. Equities face both an earnings headwind from slowing demand and a valuation headwind from elevated discount rates. Bonds face price pressure from persistent inflation. The classic 60/40 portfolio (which works well in Goldilocks and reasonably well in Deflationary Shock) performs poorly in stagflation because both components are under pressure simultaneously.
The historical reference point is the 1970s, when real oil prices quadrupled in 1973–74 following the OPEC embargo. Gold moved from $35 per ounce at the start of the decade to above $800 by January 1980. The S&P 500 was essentially flat in nominal terms between 1966 and 1982: deeply negative in real, inflation-adjusted terms. The lesson from that period is that an investor who recognized the stagflation regime early and shifted toward gold, commodity producers, and inflation-protected income preserved wealth; an investor who held a traditional growth-and-bond portfolio was gradually destroyed by inflation while also missing the equity gains that a Goldilocks environment would have provided.
Era’s positioning in the Stagflation quadrant centers on gold, select commodity exposure, TIPS for inflation-adjusted income, and short positions in the most rate-sensitive and growth-dependent equity sectors. I want to be precise about TIPS because the 2022 experience revealed a limitation that is often misunderstood. The iShares TIPS Bond ETF (TIP) returned −12.13% in 2022, despite CPI peaking at 9.1% in June of that year. The reason was duration: as real yields rose sharply alongside nominal yields in the Federal Reserve’s aggressive tightening cycle, TIPS prices fell faster than the inflation-adjusted principal increased. TIPS are not a pure stagflation hedge. They are an inflation-adjusted income instrument whose price remains sensitive to real yield movements. In a stagflation environment where real rates are also rising (as they were in 2022, and could be in 2026), short-duration TIPS are significantly less exposed to duration risk than a standard long-duration fund. The principle holds; the implementation detail matters. Source. Source 2.
For a full analysis of the stagflation mechanics and historical precedent, see What Is Stagflation?
Quadrant 4: Deflationary Shock (Growth Contracting, Inflation Falling)
The Deflationary Shock quadrant is the one that modern investors have the least direct experience with and therefore the greatest tendency to underweight. When growth collapses rapidly and inflation falls alongside it, as in the 2008–2009 Global Financial Crisis and, briefly, in the March 2020 COVID shock, the flight to safety drives sovereign bond prices sharply higher, the U.S. dollar strengthens against most other currencies, and cash becomes a meaningful positive-real-return asset. Risk assets fall broadly and, in severe cases, correlations move toward one, meaning that the diversification investors thought they had disappears precisely when they need it most.
The numbers are unambiguous. The iShares 20+ Year Treasury Bond ETF (TLT) returned +33.95% in 2008 as investors fled into the safest sovereign assets during the GFC. The U.S. Dollar Index (DXY) gained approximately 22% in the second half of 2008 as global dollar-denominated liabilities forced a scramble for dollar liquidity. Cash in this environment outperforms almost every risk asset not because it generates positive real returns (it often does not) but because it preserves nominal capital at a time when most other assets are generating significant negative returns.
Era’s positioning for this quadrant emphasizes long-dated U.S. Treasuries, the U.S. dollar as a safe-haven currency, and cash. The equity short positions that may appear in the Stagflation quadrant become more broadly valuable here, though the velocity of the shock typically makes selective implementation difficult. The deeper analytical question is whether the dollar’s safe-haven role remains intact in an environment of record U.S. fiscal deficits. The De-Dollarization Report addresses that question directly; the evidence as of September 2026 still supports the dollar’s reserve-currency status in acute risk-off events, even if the long-term trajectory is less certain.
Where We Are Now: September 2026
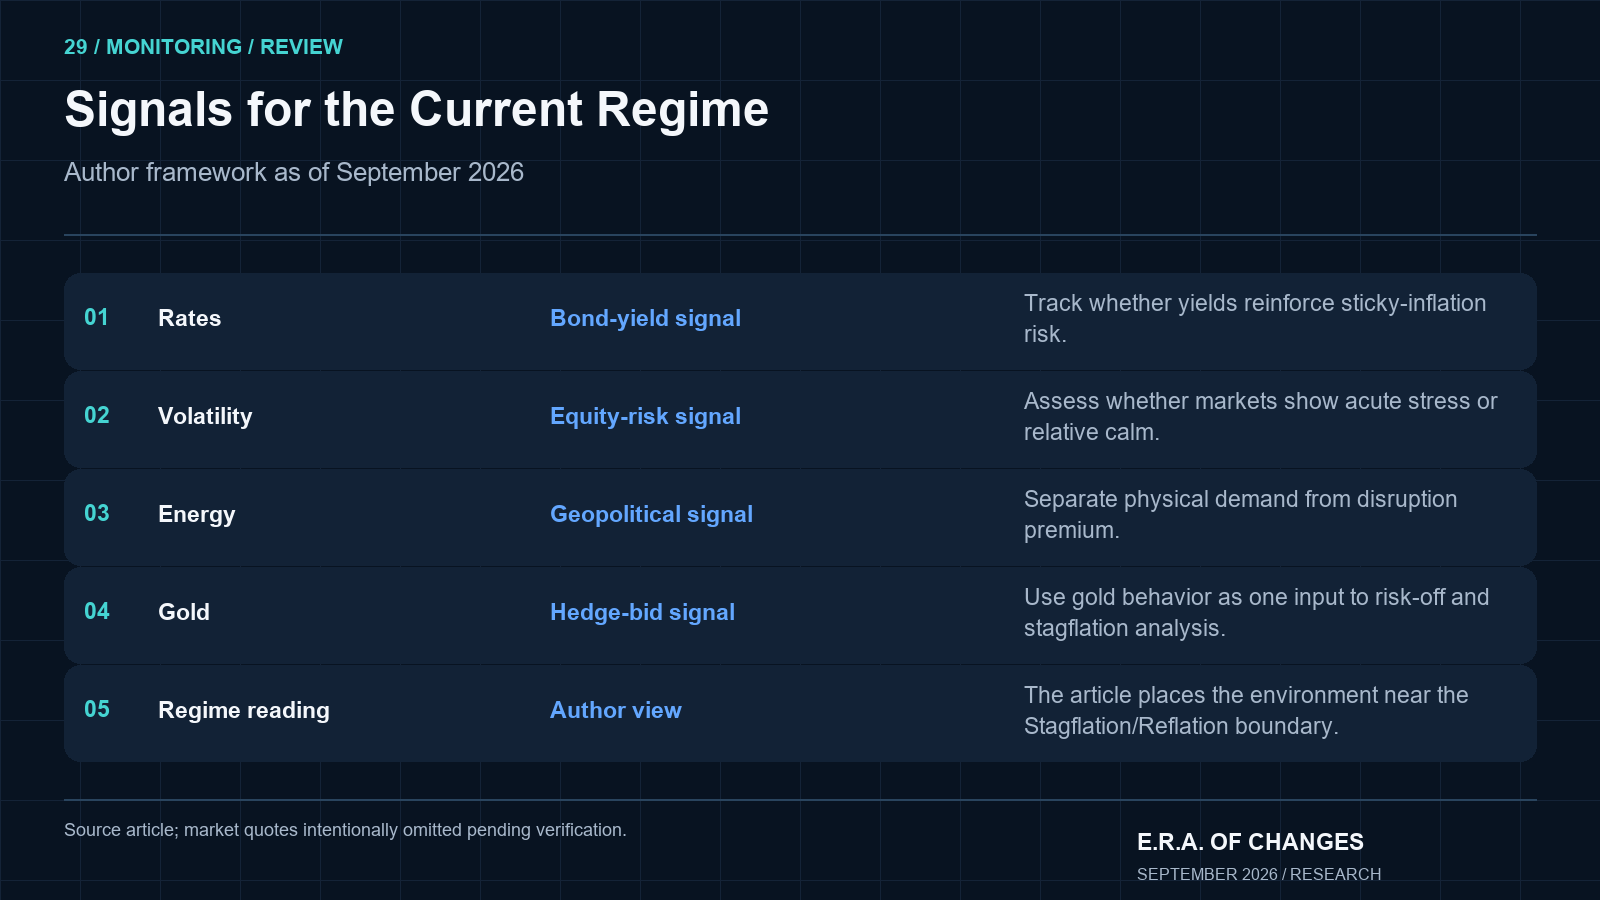
Locating the current environment in the four-quadrant framework is rarely precise. September 30, 2026 does not sit cleanly inside any single quadrant. It sits at the boundary between Reflation and Stagflation, with genuine analytical uncertainty about which direction the regime will move from here.
The growth signal is mixed. Non-OPEC supply growth is accelerating, the U.S. fiscal impulse remains large at approximately $2.1 trillion in deficit spending this year, and technology investment (particularly AI infrastructure build-out) has kept capital expenditure elevated. But the IEA’s August report forecast a 1.6 million-barrel-per-day decline in global oil demand for 2026, with the expected contraction 510,000 barrels per day larger than in July, and China’s CPI has turned modestly negative while its PPI has been contracting for 36 consecutive months. The global growth signal is bifurcated rather than cleanly expansionary or contractionary. Source.
The inflation signal is elevated but geopolitically distorted. Brent crude at approximately $96 reflects a geopolitical risk premium of roughly $26–$31 above Era’s estimated fundamental supply-demand value of $65–$70. Strip out that geopolitical premium and the underlying price trajectory looks more consistent with the Goldilocks-Reflation boundary. Include it (as any investor tracking actual inflation inputs must) and the environment looks closer to Stagflation, particularly in energy-importing economies where the transmission from crude to headline CPI is direct and fast.
The 10-year Treasury yield at 5.29% is the starkest single data point. Nominal yields reflect expected inflation, real rates, term premiums and bond supply; a single observation does not isolate those effects. The VIX at approximately 16 is more ambiguous: equity markets are neither panicking nor reflecting particular concern. That combination of elevated bond yields and calm equity volatility is characteristic of the early-to-middle stages of a stagflation regime, before equity earnings have fully reflected the growth slowdown. Source. Source. Source 2.
Era’s current positioning tilts toward the Stagflation quadrant while maintaining meaningful exposure to the Reflation quadrant as a buffer against the scenario where geopolitical de-escalation allows growth to outrun inflationary pressures. The full current positioning is available through the Era Global Risk Index and our Mid-Year Market Risk Analysis 2026.
The Rule Most Investors Break: How Often to Rebalance
Rebalancing frequency is one of the most underappreciated sources of both outperformance and underperformance in scenario-based portfolio management. The discipline required is not more frequent review; it is less frequent intervention.
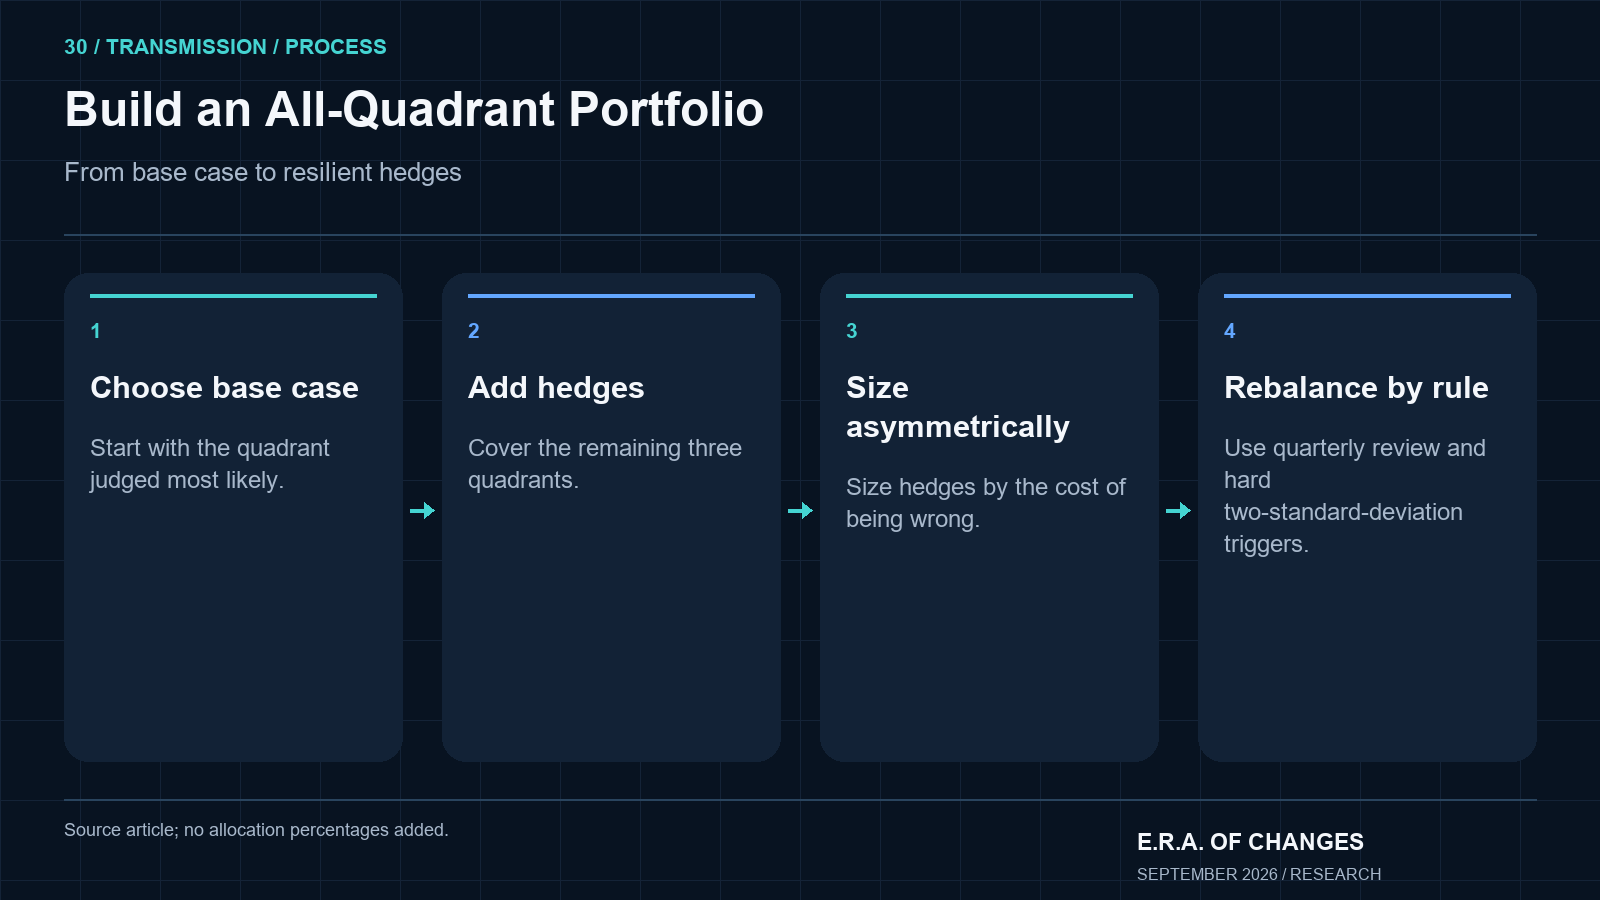
Era’s rule is quarterly rebalancing under normal macro conditions, with interim triggers when an indicator moves more than two standard deviations from its recent norm. The two indicators that carry the most signal for macro regime transitions are the 10-year Treasury yield and the VIX. To evaluate the September 30 readings, the trailing window, data series and calculation method need to be specified. Without them, the two-standard-deviation trigger cannot be reproduced; the readings alone do not establish whether an interim rebalance is warranted. Source. Source 2. Source 3.
The reason for the two-standard-deviation threshold rather than a continuous adjustment rule is straightforward and is worth stating explicitly. Every rebalancing transaction involves friction: bid-ask spreads, execution costs, and in taxable accounts, potential capital gains realizations. More fundamentally, frequent rebalancing in response to noise (to temporary deviations that do not represent genuine regime changes) introduces mean-reversion cost rather than adding structural value. A portfolio adjusted every two weeks in response to short-term data is not a more precise implementation of scenario planning. It is an expensive form of market timing dressed in analytical language.
The discipline is to identify the variables that carry the most regime-transition signal, set objective thresholds for intervention, and then not rebalance until either the calendar trigger or the quantitative trigger fires. More frequent activity than this is not investing. It is friction accumulation that compounds against the portfolio over time.
Building the All-Quadrant Portfolio
The practical architecture of an all-quadrant portfolio begins with a base-case allocation that captures the Goldilocks or Reflation environment the investor judges most likely for the current period, then adds structured hedges for each of the remaining three quadrants. The hedges are not equal in size: they are sized according to the probability-weighted cost of being wrong in each alternative scenario.
A Stagflation hedge in Goldilocks is relatively cheap to maintain and potentially extremely valuable if the regime shifts. Gold and short-duration TIPS can coexist in a Goldilocks portfolio without meaningfully degrading returns, because their cost of carry is low compared to the capital they would protect in a genuine inflationary shock. A Deflationary Shock hedge (long-duration Treasuries or a position in TLT) also has low expected cost in a Goldilocks or Reflation environment and provides significant protection if growth collapses.
The most expensive hedge in Goldilocks is Stagflation exposure carried as a large active position. In the 2013–2020 period, an investor who maintained 20–30% allocation to gold and commodities as active Stagflation hedges paid a significant opportunity cost relative to the index. The appropriate scale is a meaningful but not dominant allocation: enough to matter if the regime shifts, not so much that it permanently drags Goldilocks returns below what a plain index fund would have provided.
The asymmetry matters here. The cost of maintaining a diversified all-quadrant structure during a long Goldilocks period is a moderate reduction in peak returns. The cost of not maintaining it when the regime shifts (as it shifted in 2022, as it could shift further from the current boundary) is a potential permanent impairment of capital. Those outcomes are not symmetric, and portfolio architecture should reflect that asymmetry.
Era Analyst’s Perspective
The question I am asked most often about scenario-based portfolio construction is some version of: “But what if you know which quadrant we’re in? Shouldn’t you concentrate your positioning?” The answer is that confidence about the current quadrant is almost never as high as it feels in the moment. In September 2026, Brent crude was near $96 per barrel, the 10-year Treasury yield stood at 5.29%, China CPI was −0.3%, and the VIX was near 16. The indicators pointed in different directions. An investor who reads that picture as clear Stagflation is ignoring the China signal and the equity market’s relative calm. An investor who reads it as clear Goldilocks is ignoring the oil price and the bond market’s persistent yield elevation. The ambiguity is not a failure of analysis. It is the actual condition of the world. Source. Source 2.
The 2x2 matrix exists precisely for moments like this one. Not to give false precision about which box we are in, but to force a structured question: what does each of the four scenarios require of the portfolio, and am I positioned for all of them rather than only the one that confirms my current narrative? The investors who came through 2022 with portfolios intact were not those who predicted the inflation regime most accurately. They were those who had never removed the structural inflation hedges from portfolios built for a decade of Goldilocks. The framework did the work. They just had to not abandon it.
The Era Macro Regime Dashboard: September 30, 2026
Indicator | Quadrant Signal | Current Reading |
|---|---|---|
10Y Treasury yield | Sticky inflation / rates | |
VIX | Equity complacency, no acute shock | ~16 (moderate) |
Brent crude | Geopolitical inflation premium | ~$96 (+47% YTD) |
Gold (XAU/USD) | Stagflation / risk-off hedge bid | No dated quote Source. |
China CPI | Deflationary drag | −0.3% YoY |
China PPI | Structural deflation | −2.3% YoY (36th consecutive month) |
USD/JPY | Dollar strength / yen pressure | 157.26 |
Global demand revisions | Moderate growth deceleration | IEA revised −1.6 mb/d in Aug 2026 |
Regime reading | Stagflation/Reflation boundary | Tilted toward Stagflation |
Frequently Asked Questions
What is scenario planning for investors?
Scenario planning for investors is the practice of building a portfolio that is explicitly positioned across multiple plausible macro environments rather than a single predicted outcome. Instead of asking “what will happen?” and allocating everything to that answer, scenario planning asks “what would each of several distinct macro regimes mean for my portfolio?” and then structures the holdings so that meaningful returns are possible in the base case while significant downside is limited in each alternative scenario.
What are the four macro quadrants in Era’s framework?
Era’s framework maps four quadrants on two axes (growth/liquidity and inflation). Quadrant 1 is Goldilocks: growth expanding, inflation declining. Quadrant 2 is Reflation: growth expanding, inflation rising. Quadrant 3 is Stagflation: growth contracting, inflation elevated. Quadrant 4 is Deflationary Shock: growth contracting, inflation falling. Each quadrant produces different asset-class leadership and requires different portfolio emphasis.
What assets perform best in a Goldilocks environment?
In a Goldilocks environment (expanding growth combined with declining or stable inflation), technology and growth equities typically lead. Broad equity index funds capture most of the available return. Long-duration bonds provide stable income as rates hold steady or decline. The cost of maintaining inflation hedges like gold and commodities is a drag on returns during extended Goldilocks periods, which is why many investors abandon those hedges, only to discover the consequence when the regime changes.
What should I hold during stagflation?
In a genuine stagflation regime, Era’s framework emphasizes gold as the primary hedge given its historical performance in 1970s stagflation, short-duration TIPS for inflation-adjusted income without significant duration risk, selective commodity and energy exposure, and careful management of long-duration bond positions. A critical nuance on TIPS: the iShares TIPS Bond ETF (TIP) returned −12.13% in 2022 despite CPI peaking at 9.1%, because rising real yields compressed prices faster than inflation adjustments compensated. Duration matters, and short-duration TIPS performed significantly better than long-duration equivalents in that environment.
Why did TIPS underperform in 2022 despite high inflation?
TIPS adjust their principal value for inflation, which is the protection feature. But TIPS prices also move inversely with real yields: the yield on a TIPS bond above the inflation adjustment. In 2022, the Federal Reserve raised rates aggressively, pushing real yields sharply higher. Those higher real yields compressed TIPS prices more quickly than the inflation-adjusted principal increased, producing negative total returns despite historically high headline inflation. The lesson is that TIPS protect against inflation as an income source over time, but their mark-to-market price is still sensitive to rate movements. Short-duration TIPS carry less duration risk and behaved better in 2022 than long-duration funds like TIP.
What are the best investments for a deflationary shock?
The historical evidence is clear. The iShares 20+ Year Treasury Bond ETF (TLT) returned +33.95% in 2008 as the GFC triggered a flight to safety into U.S. sovereign bonds. The U.S. Dollar Index gained approximately 22% in the second half of 2008 as dollar-denominated global liabilities created intense demand for dollars. Cash, while nominally yielding little, outperforms virtually every risk asset during an acute deflationary contraction. Gold has historically been a partial safe haven in deflationary shocks as well, though its behavior depends on whether the shock involves sovereign credit risk (in which case gold performs better) or purely financial deleveraging.
How often should I rebalance a scenario-based portfolio?
Era’s rule is quarterly rebalancing under normal macro conditions, with hard triggers for interim rebalancing when a key indicator (specifically the 10-year Treasury yield or the VIX) moves more than two standard deviations from its recent norm. Rebalancing more frequently than this in response to routine market noise is not disciplined portfolio management. It generates transaction friction, potential tax drag, and the behavioral pattern of reacting to short-term data rather than tracking genuine regime transitions.
How do you know when a macro regime is changing?
Regime transitions leave signatures in financial data before they appear in economic headlines. Yield curve behavior (specifically whether spreads between short and long rates are steepening or inverting) is one of the most reliable leading indicators. See the Yield Curve Explained analysis. Credit spreads in high-yield markets reflect corporate stress before GDP data shows contraction. The VIX rising sharply from a low baseline signals accumulating equity-market fear. The behavior of gold relative to real yields signals whether investors are seeking stagflation protection or deflation safety. No single indicator determines the regime; the combination of signals matters.
Why is scenario planning better than just predicting the most likely outcome?
A prediction requires you to be right. A scenario-based portfolio architecture requires you to be approximately right about the distribution of outcomes, which is a much more achievable standard. An investor with high conviction about the Reflation quadrant who maintains 80% of capital in that quadrant while keeping 20% distributed across the other three scenarios is unlikely to be perfectly optimized, but is also unlikely to face permanent capital impairment when the regime surprises them. The goal is not precision. It is resilience.
What is Era’s current macro scenario outlook?
As of September 30, 2026, Era characterizes the current environment as a Stagflation/Reflation boundary, with a tilt toward Stagflation given the 10-year Treasury yield at 5.29% and Brent crude at approximately $96. Gold remains part of the hedge-demand picture. The primary uncertainty is whether the geopolitical energy premium currently embedded in Brent compresses (which would relieve the stagflationary pressure) or whether it persists or expands further. China’s deflation at −0.3% CPI adds a cross-current that could eventually pull global goods prices lower even as energy costs remain elevated. The Era Global Risk Index provides the live read on Era’s systemic risk assessment. Source. Source 2. Source.
Should crypto be in a scenario-based portfolio?
Era includes crypto (specifically Bitcoin) in the Stagflation quadrant positioning as a hedge instrument, not as a primary store of value. The rationale is that Bitcoin carries properties relevant to monetary debasement scenarios: fixed supply, no central-bank issuance, and institutional adoption that has created a responsive but non-discretionary demand base through ETF flows. However, crypto also carries high beta and significant drawdown risk, which means its role in stagflation hedging is partial and requires sizing discipline. See Bitcoin Cycles Explained for the full framework on when crypto tends to respond to stagflationary conditions versus when broader risk-off sentiment overwhelms the monetary hedge narrative.
How does Era read the current geopolitical risk environment for portfolio positioning?
Geopolitical risk affects portfolio positioning primarily through its impact on energy prices and therefore on the Stagflation quadrant signals. With Brent crude at approximately $96 in September 2026, the geopolitical risk premium embedded in energy prices is substantially above Era’s $5–$10 baseline estimate, implying a current premium of approximately $26–$31 above the fundamental supply-demand price of $65–$70. This elevated premium drives the current Stagflation bias in Era’s positioning. If the premium compresses toward the historical baseline, the appropriate portfolio response is a shift back toward the Reflation or Goldilocks quadrant. See our Top 10 Geopolitical Hotspots in 2026 for the specific scenarios Era monitors as potential triggers for premium compression or expansion.
About E.R.A. OF CHANGES
E.R.A. OF CHANGES is an independent macroeconomic research and geopolitical intelligence firm providing institutional-quality analysis to investors worldwide. Our research combines macroeconomics, financial markets, blockchain analytics, and geopolitical risk into proprietary forecasting frameworks designed to identify structural market trends before they become consensus. The Era Global Risk Index (updated daily from 24 structural indicators) serves as the foundation of our analytical methodology, providing a forward-looking measure of systemic financial stress grounded in structural economic evidence rather than market sentiment. Our full methodology, live index reading, and forecast archive are available at eraperemen.info/en.
The content published by E.R.A. OF CHANGES is for informational and educational purposes only and does not constitute financial, investment, legal, or tax advice. All views expressed are the personal analytical perspective of the author. Past forecast accuracy does not guarantee future results. Readers should conduct their own research and consult a qualified financial professional before making any investment decisions.
Sources
Market Data - 10-Year Treasury Yield Hits 19-Year High (CNBC, September 26, 2026) - Treasury Yields Snapshot: September 25, 2026 (Advisor Perspectives) - VIX Volatility Index (MacroRadar) - U.S. 10-Year Treasury Constant Maturity (FRED)
TIPS and Bond ETF Performance - Inflation Is Up, So Why Are TIPS Returns Down? (Charles Schwab via Advisor Perspectives) - iShares TIPS Bond ETF (TIP), iShares - iShares 20+ Year Treasury Bond ETF (TLT) Performance (Finance Charts)
Scenario Planning and Asset Allocation Research - How Would These 3 Popular Bond ETFs Hold Up in a Stagflation Scenario? (AOL Finance) - CBOE VIX: Volatility Products
Internal Era Research - What Is Stagflation? - Scenario Planning for Investors: Resilient Portfolios - Era Global Risk Index - Era CrisisMeter Explained - De-Dollarization Report - Emerging Market Investment Risks - Bitcoin Cycles Explained - Top 10 Geopolitical Hotspots in 2026 - Yield Curve Explained - Mid-Year Market Risk Analysis 2026 - Era Forecasting Methodology - How Political Events Affect Financial Markets - Global Inflation Trends 2026 - Oil Price Volatility Explained



