Executive Summary
Most recessions and financial crises do not arrive as sudden events. They announce themselves through a sequence of deteriorating conditions in liquidity, credit, funding, labor, and refinancing markets, usually months before GDP turns negative or equities reach their lows. The challenge is that the clearest early signals rarely appear in headline economic data. They appear in the plumbing: in the gap between funding costs and policy rates, in the additional yield investors demand for holding lower-quality corporate debt, and in the frequency at which workers file for unemployment benefits.
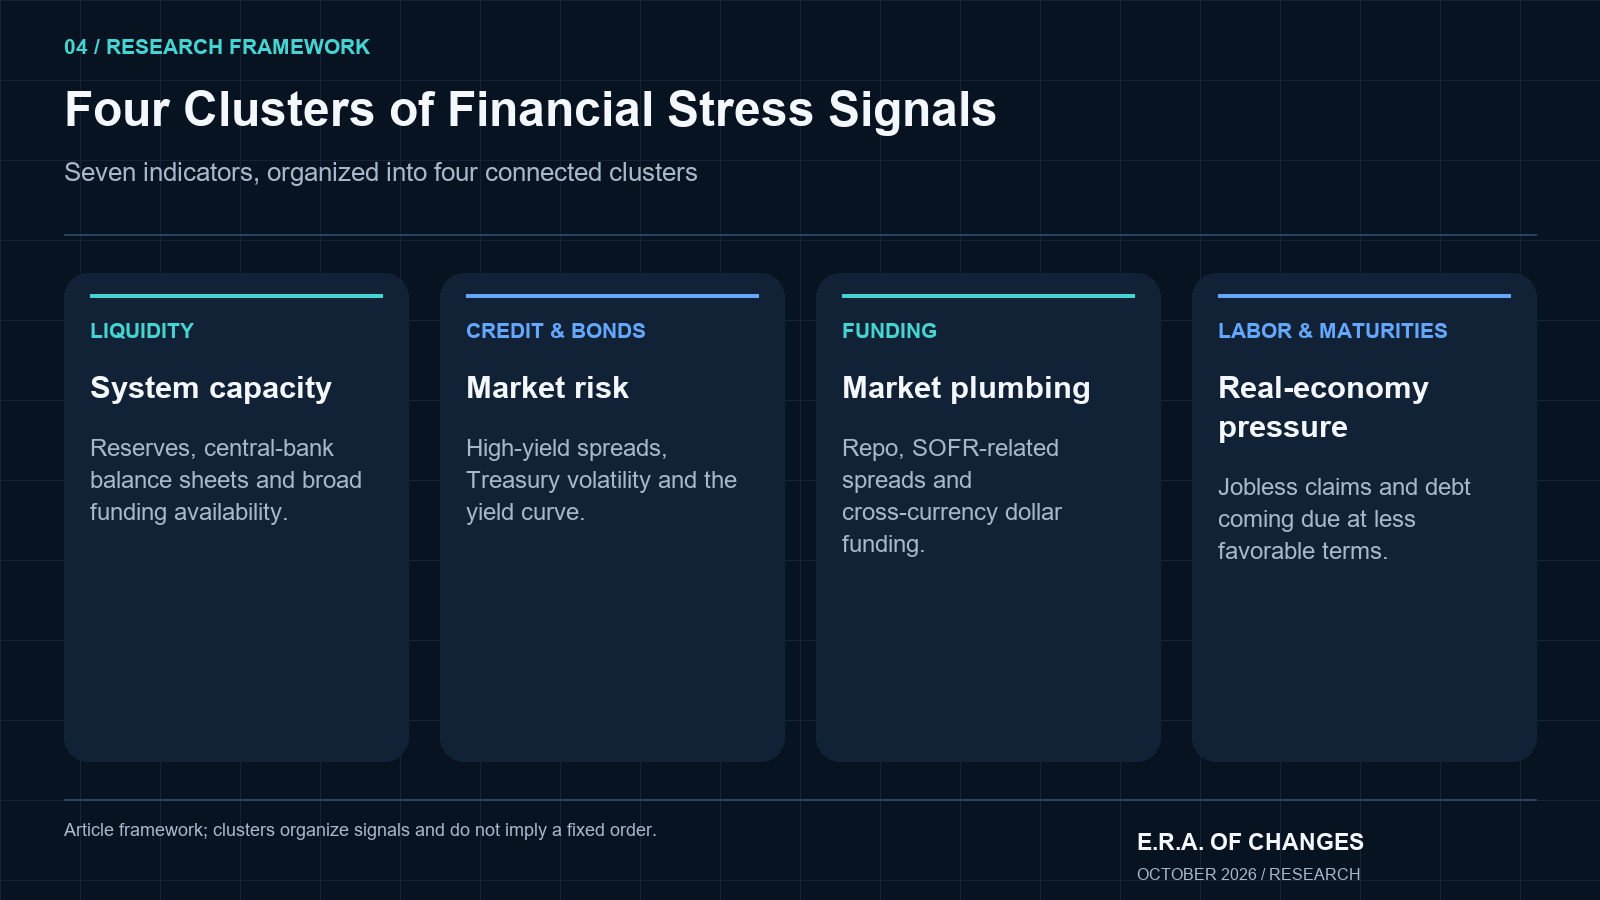
At E.R.A. OF CHANGES, I have built our analytical framework around seven financial stress indicators that tend to reveal the direction of the market regime before it becomes visible in official statistics. None of these indicators works in isolation. What matters is the pattern of convergence: when global liquidity contracts, high-yield spreads widen, bond-market volatility rises, and funding conditions tighten simultaneously, the probability of a regime shift increases materially. When only one signal moves, it is usually noise. When five move together, that is a different kind of problem entirely.
This article explains each of those seven indicators, why they matter, how they interact, and how E.R.A. OF CHANGES uses them together to assess where we stand in the financial cycle.
Key Takeaways
- Financial stress is different from ordinary market volatility. Price swings can occur without systemic pressure on the financial system’s ability to lend, fund, and refinance.
- Global liquidity (the combined effect of central-bank balance sheets, bank reserves, M2 growth, and dollar funding conditions) tends to be the first layer of the market regime to shift. For a fuller framework, see Global Liquidity Explained.
- High-yield credit spreads reveal whether lenders are becoming more concerned about default risk and whether refinancing is becoming more expensive for weaker borrowers.
- The MOVE Index tracks expected Treasury-market volatility and becomes significantly more meaningful when it rises alongside widening credit spreads rather than in isolation.
- Initial jobless claims provide an earlier labor signal than the unemployment rate; a sustained move above approximately 300,000 is the threshold at which E.R.A. OF CHANGES materially increases its recession assessment.
- Yield-curve re-steepening after a prolonged inversion can be more informative than the inversion itself, particularly when driven by falling short rates rather than rising long yields.
- Funding-market stress in repo markets, SOFR spreads, and cross-currency basis can reveal institutional pressure long before consumers or equity investors notice anything unusual.
- Corporate and commercial real estate refinancing conditions are where sustained higher rates stop being a valuation headwind and start being a default problem.
- No single indicator should be treated as a standalone signal. The most credible regime-shift warning comes from multiple independent indicators deteriorating simultaneously.
Introduction
Markets rarely move from healthy to crisis in a single step. What usually happens is more gradual and, for that reason, more dangerous. Liquidity quietly tightens. Credit spreads begin to widen. Funding becomes incrementally more expensive for marginal borrowers. Hiring slows in interest-rate-sensitive sectors. And all of this can happen while the S&P 500 sits near its highs, GDP prints positive, and consensus forecasters remain constructive.
The question that has always driven our analytical framework is this: which indicators can reveal that the market regime is changing before the headline data confirms it?
I do not believe financial stress should be analyzed as a single number. It should be analyzed as a transmission process: a chain of events that moves from liquidity conditions, through credit markets, into the real economy. The seven indicators I describe in this article each represent a different link in that chain. Investors who watch only headline economic data are looking at the rear-view mirror of macroeconomics. The earlier signals are in the plumbing.
What Is Financial Stress?
Financial stress occurs when the ability of households, companies, banks, or markets to borrow, refinance, transact, fund positions, or absorb losses begins to deteriorate. It can manifest through higher funding costs, wider credit spreads, contracting liquidity, bank balance-sheet pressure, or tightening lending standards. It is not the same thing as falling asset prices.
A 15% equity correction can occur in the complete absence of systemic stress, driven by repositioning, earnings surprises, or geopolitical fear. Equally, serious credit deterioration can begin while major stock indexes remain near their highs, because credit markets are asking a fundamentally different question than equity investors. Bond investors ask whether a borrower can repay principal. Equity investors ask how much earnings can grow. Those questions do not always produce the same answer at the same time, and the divergence between them is one of the most reliable early-stage stress signals.
Financial Stress vs. Market Volatility
The simplest way I can explain the difference is this: volatility tells you markets are nervous, while credit and funding indicators tell you whether the financial system is actually under pressure. These are not the same thing.
Market Volatility | Financial Stress | |
|---|---|---|
Primary indicator | Price movement | Financing deterioration |
Self-reinforcing? | Can be temporary | Can become self-reinforcing |
Most visible in | VIX, daily equity swings | Credit spreads, funding markets |
Default risk? | Does not require defaults | Can lead to defaults |
Contagion potential | Often remains asset-specific | Can spread across markets |
A VIX spike around a Federal Reserve decision or a geopolitical event is not the same as a sustained deterioration in high-yield spreads accompanied by funding-market pressure. E.R.A. OF CHANGES treats the two very differently in our systemic risk assessments, and conflating them is one of the most common analytical errors I see in market commentary.
How a Market Regime Shift Usually Develops
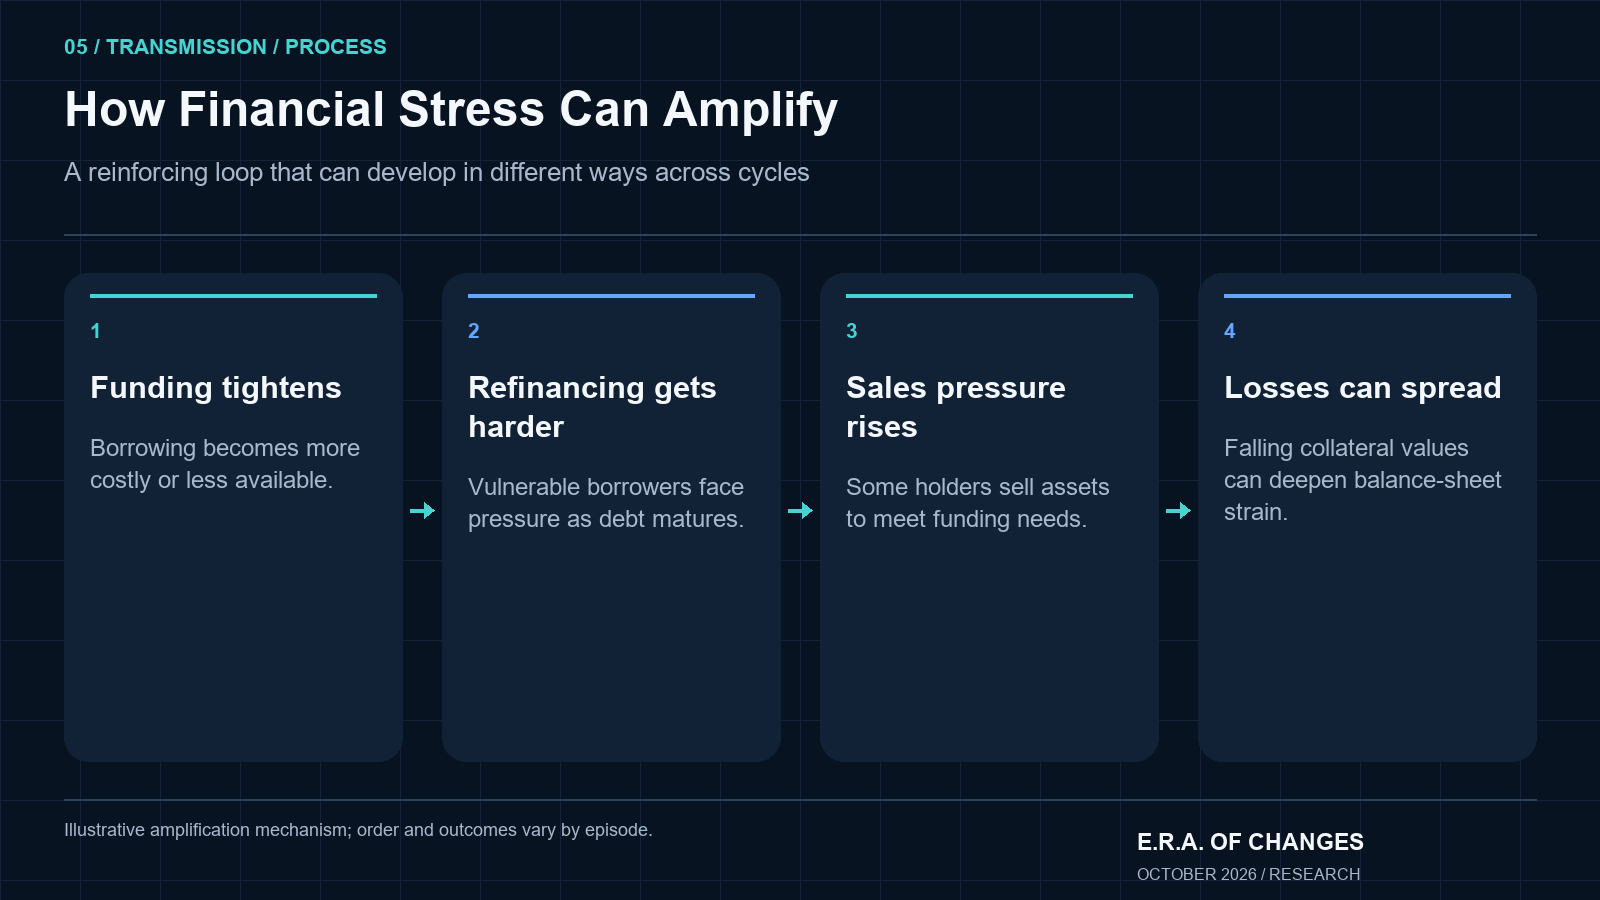
There is no single template. But across the cycles E.R.A. OF CHANGES has studied (2007–2009, the 2018 Q4 repricing, the March 2020 liquidity crisis, the 2022 rate shock), a general sequence tends to emerge:
Liquidity becomes less supportive → financing costs rise → credit spreads widen → weak borrowers struggle to refinance → hiring slows and layoffs rise → consumer defaults increase → banks tighten lending standards → growth deteriorates → policy response begins.
What is important about this sequence is not that it happens in exactly this order every time. It rarely does. What matters is that each step makes the next step more likely. An investor watching only GDP or the unemployment rate is watching the second-to-last link in that chain, by which point the institutional repositioning that follows credit and funding deterioration has usually already occurred.
The 7 Financial Stress Indicators E.R.A. OF CHANGES Watches
1. Global Liquidity: The First Layer of the Market Regime
Of the indicators I use for the six-month outlook, global liquidity is one I return to consistently. Expansion can support financing and risk appetite, while contraction can put pressure on valuations. Earnings, valuations, fiscal policy, and shocks can offset that influence, so I do not treat liquidity as a variable that overrides all others.
By global liquidity I do not mean a single number. No single number captures it. I mean the combined effect of Federal Reserve balance-sheet dynamics, major central-bank reserves across the ECB, Bank of Japan, and Bank of England, bank reserves held at the Fed, the Treasury General Account balance, M2 money supply growth, cross-border dollar funding conditions, and private credit creation. Each of these variables represents a different dimension of how much capital is available in the system and at what cost.
Why does liquidity matter so much? It affects cost of leverage, availability of capital, valuation multiples, risk appetite, and the rate of credit creation simultaneously. When liquidity expands, funding becomes easier, marginal buyers enter the market, and investors are willing to pay more for the same future cash flows. When it contracts, the reverse occurs: leverage becomes more expensive, marginal buyers disappear, and weak balance sheets are exposed. A company can have strong revenue, solid margins, and capable management and still see its valuation decline significantly if the liquidity conditions that supported it during expansion are no longer present.
One indicator I am watching as of early October 2026 is ON RRP usage, which had fallen to very low levels by late summer. ON RRP is a monetary-policy implementation tool, not an emergency credit facility. When ON RRP balances decline, the effect on reserves depends on where counterparties move their cash. Low usage does not mean the facility has disappeared or prove that funding shocks will follow. I compare it with reserves, Treasury cash balances, and actual funding-market prices. Source. Source 2.
Strong fundamentals can reduce company-specific risk, but they may not fully protect valuations from a broad liquidity-driven repricing. That is one of the more uncomfortable truths in financial analysis.
2. High-Yield Credit Spreads: When Lenders Start Demanding More Compensation
The high-yield credit spread, most commonly tracked through the ICE BofA US High Yield Index option-adjusted spread on FRED, is the additional yield investors demand for holding below-investment-grade corporate debt instead of comparable-duration Treasuries. It is one of the cleanest real-time readings available of how professional credit investors collectively assess default risk.
FRED’s ICE BofA US High Yield Index OAS observations were 2.73%, or 273 basis points, on September 23, 2026 and 3.12%, or 312 basis points, on September 30. The CCC-and-lower series was 11.79%, or 1,179 basis points, on September 30. These are different credit-quality baskets, not interchangeable measures. In my interpretation, the widening warrants attention, but neither value alone establishes a systemic crisis. Source. Source 2.
When spreads are narrow, the interpretation is generally one of strong risk appetite, easy refinancing conditions, and low perceived default risk. But very tight spreads can also indicate complacency, particularly late in a credit cycle when institutional behavior shifts toward yield-chasing at the cost of risk assessment discipline. When spreads widen (and I would treat a sustained move above 450–500 basis points in the headline OAS as an early systemic warning), lenders are demanding more compensation, refinancing becomes materially more expensive for leveraged borrowers, and default expectations are shifting.
The reason credit markets can sometimes identify problems before equity markets is structural. Debt sits higher in the capital structure than equity. Bond investors ask primarily one question: can this borrower repay me? That question tends to surface solvency and refinancing problems before equity investors, who are focused on earnings growth, begin to revise their forecasts.
3. The MOVE Index: Bond Volatility as a Systemic Stress Signal
The ICE BofA U.S. Bond Market Option Volatility Estimate Index (MOVE) measures U.S. bond-market yield volatility using a basket of over-the-counter options on interest-rate swaps, according to ICE’s description. Benzinga reported a close of 101.82 on September 28, 2026 and a rise of about 35% over the preceding month. Those dated numbers are the publication’s report, not a separately verified ICE data extract. I read MOVE alongside credit and funding indicators rather than treating 100 or 120 as official crisis thresholds. Source. Source 2.
Why does Treasury volatility matter for financial stress assessment? Because the Treasury market is the foundation of the entire global asset-pricing structure. It serves as the primary collateral in repo and funding markets, sets the discount rate for essentially every financial asset, and sits at the center of bank balance-sheet calculations. Persistent instability in Treasury-market pricing does not stay contained in the bond market. It transmits into funding conditions, bank balance sheets, derivatives margins, and collateral valuations across the system.
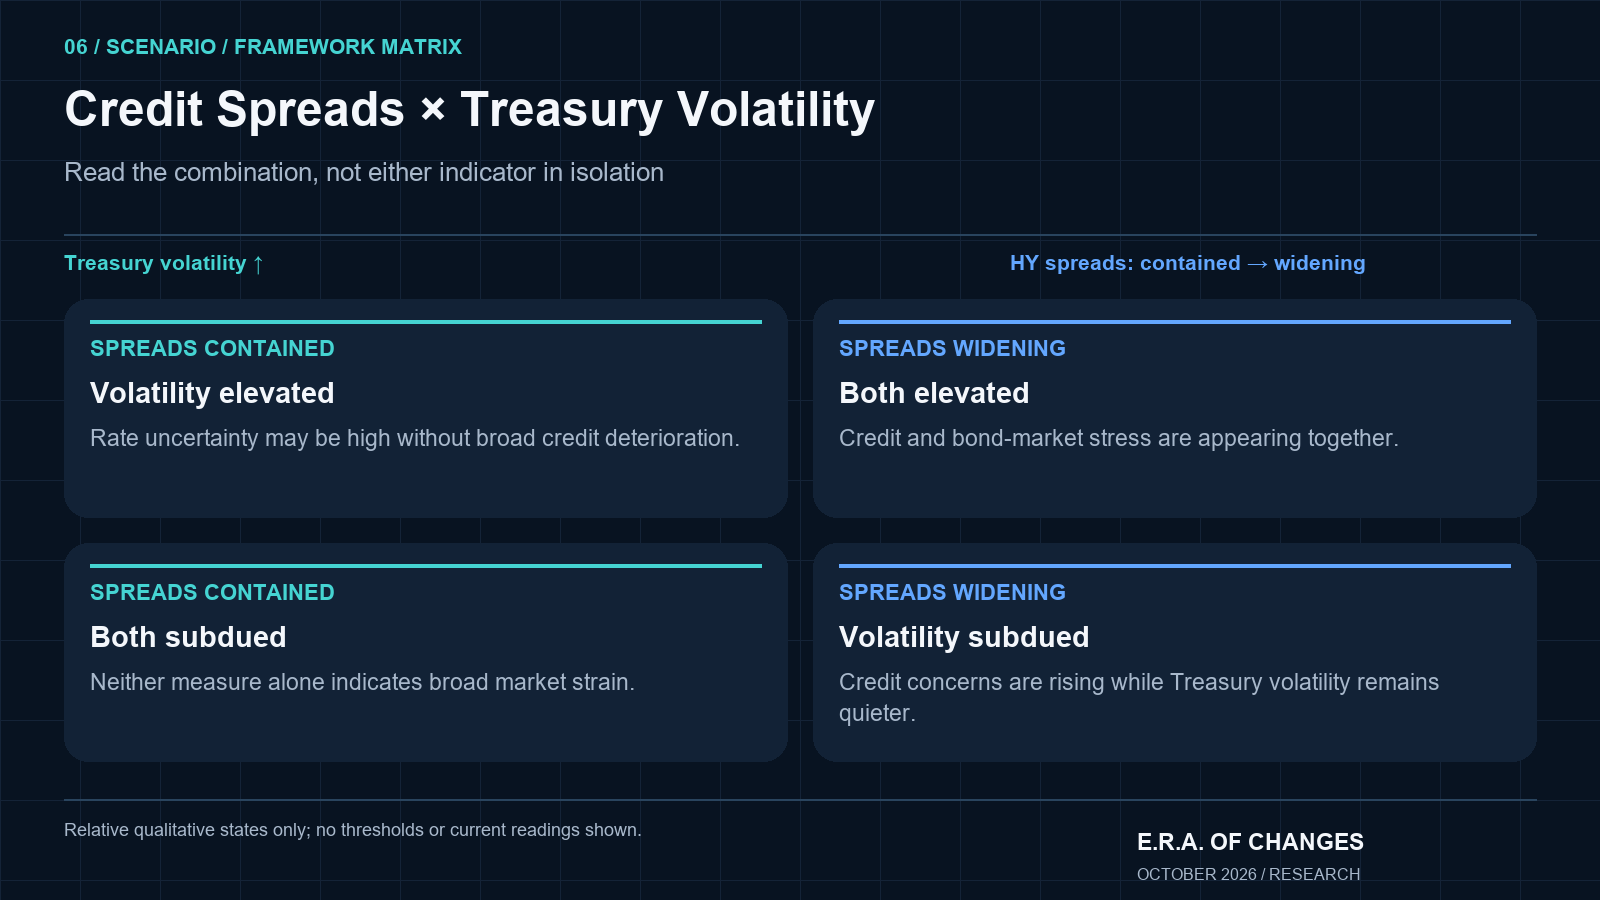
MOVE in isolation is not always informative. A spike around a Federal Reserve policy decision (when rate uncertainty is temporarily elevated) is qualitatively different from sustained elevation accompanied by simultaneous widening in high-yield credit spreads. The combination is what matters:
HY Spreads | MOVE | Interpretation |
|---|---|---|
Narrow | Low | Stable financial conditions |
Narrow | High | Rate uncertainty, not yet broad credit stress |
Widening | Low | Corporate credit deterioration, bonds still calm |
Widening | High | Broader systemic-stress warning |
When both indicators move together, the probability of a genuine regime shift increases substantially. This is one of the strongest signal combinations in our framework.
4. Initial Jobless Claims: When Financial Stress Reaches the Labor Market
The unemployment rate is an important economic indicator. It is also a lagging one. By the time it clearly reflects a deteriorating labor market, the institutional repositioning that follows credit and funding deterioration has usually already occurred. What E.R.A. OF CHANGES watches instead is initial jobless claims, published weekly by the U.S. Department of Labor.
As of the week ending September 26, 2026, initial claims were 197,000. The four-week moving average stood at approximately 200,000. These are historically low readings: they mean labor conditions currently contribute no systemic stress signal in our framework. The direction and trend matter as much as the level, and what I am monitoring is whether the sustained trend begins to move meaningfully above our internal analytical threshold.
That threshold (and I want to be precise that this is our internal assessment framework, not an official recession definition) is approximately 300,000 on a sustained basis. A single week above 300,000 can be caused by seasonal adjustment, weather, a large-scale strike, or a temporary anomaly. What I am watching for is a four-week moving average sustained above that level, accompanied by a rising trend in continuing claims and broad sectoral coverage in the layoffs data. When those three conditions align, the probability of a genuine labor-market deterioration increases materially in my view.
Why does labor connect financial stress to the broader economy? Because the transmission chain from credit deterioration to recession runs directly through employment:
Layoffs rise → income growth weakens → consumption slows → consumer defaults rise → banks tighten credit → corporate revenue weakens → further layoffs.
This self-reinforcing loop is what transforms a growth scare into a recession.
5. The Yield Curve: Especially Re-Steepening After Inversion
The 10-year-minus-2-year Treasury spread had a prolonged predominantly inverted period from July 2022 to September 2024, interrupted by brief zero or positive observations. It was not continuously negative throughout that calendar interval. On October 1, 2026, Treasury reported a 2-year yield of 4.78% and a 10-year yield of 5.24%, a positive spread of 46 basis points. That single observation neither marks a new disinversion nor establishes that rate cuts are imminent. Source. Source 2.
In my framework, the way a curve steepens after inversion warrants attention. Bull steepening can reflect expectations of policy easing amid growth concerns; bear steepening can have different causes. Timing and drivers vary across cycles, and a steepening curve alone does not establish that a recession is imminent. The October 1 positive spread is a dated observation, not proof of a new regime transition. Source.
There is an important distinction between two types of re-steepening: bull steepening, where short yields fall rapidly and the signal is growth stress and expected rate cuts; and bear steepening, where long yields rise faster, which typically signals inflation concerns, fiscal deterioration, or rising term premium. The reason the curve is changing matters considerably more than the simple fact that it has changed. A curve moving back toward normal does not automatically mean conditions are improving; it can mean the opposite. For a full explanation of this dynamic, see my earlier piece on why the yield curve matters and what re-steepening actually signals.
6. Funding-Market Stress: Where Financial Plumbing Starts to Break
This is the most institutionally specific of the seven indicators, and it is the one that retail investors most commonly overlook until a genuine crisis makes it impossible to ignore. The funding market (the network of repo agreements, SOFR-referenced rates, cross-currency basis swaps, and bank reserve positions through which financial institutions borrow from one another overnight) is the bloodstream of the financial system. When it functions normally, institutions finance their operations cheaply, liquidity flows efficiently, and market intermediation occurs at predictable costs. When it stresses, the consequences propagate with extraordinary speed.
The key instruments I watch are SOFR-related spreads, particularly the gap between secured overnight financing and expected policy rates; overnight and term repo rates and the Federal Reserve Bank of New York’s daily operations data; cross-currency basis swaps, which reveal demand for U.S. dollars across different jurisdictions; and bank reserve balances at the Federal Reserve.
I compare SOFR with the effective federal funds rate and other funding benchmarks, using consistent dates and definitions. There is no universal normal spread or crisis cutoff: collateral, settlement calendars, balance-sheet constraints, and reserve conditions can all affect the difference. September 2019 is a useful historical example of repo-market disruption, but a peak quote on an individual repo transaction should not be confused with the daily volume-weighted SOFR observation. Low ON RRP usage is an additional context variable, not proof that such an episode must recur. Source. Source 2.
Funding stress reveals problems in the financial plumbing well before consumers notice anything in the real economy. Smart money (institutional capital that repositions ahead of retail) moves earliest in these markets, which is precisely why monitoring them provides earlier signals than waiting for macroeconomic data to confirm the stress.
7. Corporate and CRE Refinancing: Where Higher Rates Become a Credit Event
The seventh indicator is different in character from the other six because it operates on a longer lag. Companies and property owners do not face the consequences of higher interest rates the moment rates rise; they face them when their existing debt matures and must be refinanced at current market rates. That delay (which can run 18 to 24 months or more) is precisely what makes refinancing risk so dangerous to ignore during a prolonged period of elevated rates.
MBA’s 2025 Commercial Real Estate Survey of Loan Maturity Volumes reported $875 billion in commercial and multifamily mortgage balances scheduled to mature in 2026 and $652 billion in 2027. Together those two years represent $1.527 trillion in scheduled unpaid principal balances measured as of December 31, 2025. Balances can decline before maturity through repayment, and maturity does not mean that every loan must be refinanced, sold, or recapitalized. The risk depends on the property’s cash flow, leverage, valuation, and available financing. Source.
The transmission mechanism is direct:
Old debt at low rates matures → new debt must be issued at higher rates → interest expense rises → cash flow weakens → lenders become more selective → default risk increases for borrowers unable to bridge the gap.
MBA reported that 30% of hotel and motel mortgage balances and 17% of office balances were scheduled to mature in 2026. Those maturity shares describe exposure to a financing decision, not an inevitable loss or a uniform occupancy trend across both sectors. Operating conditions and refinancing risk vary by property and location. Our guide to how interest rate cycles translate into financial market stress explains the broader transmission mechanism. Source.
The corporate side carries a related vulnerability I describe as the zombie company problem. A meaningful subset of firms entered the current rate environment with operating performance sufficient to service cheap debt, but insufficient to comfortably cover the cost of debt at current market rates. These businesses are not in default today. They will encounter the stress when their debt matures.
The Indicators E.R.A. OF CHANGES Trusts Less as Early-Warning Signals
No framework is complete without naming its blind spots. There are four widely followed indicators that I believe are often given too much weight as early-warning signals of financial stress:
CPI is one of the most market-moving releases in the calendar, and it matters enormously for Federal Reserve policy, for bonds, and for FX markets. But it measures price change with a lag, using methodologies that often reflect conditions from months earlier. CPI is not an early-warning indicator of financial stress. It is the rear-view mirror of macroeconomics: useful for understanding where prices have been, not where the financial system is going.
GDP is important for measuring the size and direction of the economy, but it is published quarterly with substantial delay and subsequently revised. By the time a negative GDP print is public, institutional positioning has typically already reflected the underlying deterioration for months.
The unemployment rate matters, but it is slower than initial claims because rising unemployment requires sustained layoffs across multiple months to move the headline figure significantly. It confirms a trend better than it reveals one early.
VIX alone does not establish systemic stress. Equity-option volatility can rise around earnings, policy decisions, elections, or geopolitical events without a broad deterioration in credit or funding. It can also accompany genuine systemic problems. I use it as one market-price signal and check whether credit spreads and funding conditions support the same interpretation.
Growth Scare vs. Financial Stress vs. Systemic Crisis
One of the most important distinctions in our analytical framework is the three-stage classification of stress severity:
Stage | Typical Characteristics |
|---|---|
Growth Scare | Weak PMIs, equity volatility, slowing growth data; spreads still broadly contained |
Financial Stress | Widening credit spreads, tightening funding, rising initial claims, refinancing more difficult |
Systemic Crisis | Funding dislocations, forced deleveraging, margin calls, bank stress, emergency policy intervention |
Growth scares are common. Markets fear recession, but consumers continue to service their debt, credit remains broadly functional, and the financial system is not under structural pressure. The 2022 rate shock produced a major equity repricing and significant bond drawdowns, but credit markets (while meaningfully disrupted) did not seize in the way they did in 2008 or March 2020. That was a growth scare with a valuation correction, not a systemic crisis.
Financial stress is a higher-order problem. Credit costs rise, refinancing conditions deteriorate for leveraged borrowers, labor begins to reflect the economic slowdown, and the self-reinforcing mechanisms described above begin to engage. This is when Era CrisisMeter begins to register elevated systemic readings. Distinguishing the first stage from the second (and the second from the third) is precisely what our multi-indicator framework is designed to do.
How Era CrisisMeter Uses Financial Stress Signals
Monitoring seven indicators individually creates a practical problem: they operate at different frequencies, use different scales, and can produce conflicting signals at any given moment. This is precisely the challenge that Era CrisisMeter was designed to address.
Rather than relying on any single data point, Era CrisisMeter integrates multiple dimensions of systemic risk (liquidity conditions, credit market signals, monetary policy trajectory, capital flows, and geopolitical-financial transmission) into a broader composite framework. The goal is to reduce the false-positive rate that comes from watching one signal in isolation and to provide a more calibrated assessment of where systemic financial risk currently stands. Individual indicators are useful for understanding where stress is appearing. Era CrisisMeter is designed to help assess how severe that stress is becoming across the system as a whole.
How Era Global Risk Index Fits Into the Framework
There is a useful distinction between what individual financial stress indicators tell you and what our broader Global Risk Index adds to the picture. Individual indicators answer the question: where is stress appearing? Era CrisisMeter answers: how severe is current systemic stress? The Era Global Risk Index adds a third dimension: how are multiple macro, financial, liquidity, and systemic risk factors (including geopolitical dimensions that individual credit or funding indicators do not capture) interacting together?
The three frameworks are designed to work in sequence rather than compete with each other. Financial stress indicators identify the early-warning signals. Era CrisisMeter assesses their systemic severity. The Era Global Risk Index provides the broadest contextual framework within which any individual cycle is playing out.
Market Stress vs. Geopolitical Risk
E.R.A. OF CHANGES covers both financial stress and geopolitical risk, and it is worth explaining why they are not automatically the same thing. A geopolitical event (an election, a military escalation, a sanctions regime) is not automatically a systemic financial event. Markets may reprice sharply around geopolitical headlines without any of the underlying financial transmission mechanisms engaging.
What I watch for is whether a geopolitical development changes one of five specific variables: energy prices and supply disruption, global shipping and trade flows, inflation expectations and central-bank policy response, capital flows and investment conditions, or direct sanctions impacts on dollar clearing. When geopolitical stress transmits into those variables (and especially when it does so while financial plumbing is already under pressure), the interaction can amplify both channels simultaneously. For a structural analysis of how political events translate into financial market risk, see my earlier piece on political risk transmission.
What a Market Regime Shift Means for Major Asset Classes
The behavior of individual asset classes during a regime shift varies substantially based on the type of stress involved, but some general patterns hold across most cycles.
Equities in a credit-stress environment typically face multiple compression, earnings revisions, and significant factor rotation, with quality, balance-sheet strength, and profitability becoming more important relative to growth projections. Dispersion between strong and weak balance sheets increases, and the correlation between sectors that has prevailed during easy liquidity conditions tends to break down.
High-yield corporate bonds are often one of the first areas to reflect deteriorating default expectations, making them useful not just as an investment but as a leading indicator for equity markets in the cycle.
Government bonds present a more complex picture. Their behavior during stress depends heavily on whether the shock is primarily deflationary (in which case duration tends to perform well) or inflationary, where fiscal concerns may simultaneously drive yields higher. The 2022 bond bear market, where Treasuries and equities fell together, was a case driven by the specific combination of entrenched inflation and aggressive Fed tightening that is not the default template.
Gold tends to respond favorably to combinations of falling real yields, financial stress, and monetary accommodation.
Crypto (particularly Bitcoin) has shown sensitivity to liquidity conditions, leverage cycles, and broad risk appetite rather than functioning as an uncorrelated asset during acute stress. The 2022 drawdown demonstrated this clearly. For our analysis of how Bitcoin’s four-year cycle interacts with macro liquidity, see Bitcoin Cycles Explained.
The U.S. dollar often strengthens during global liquidity stress and deleveraging, as institutional demand for dollar-denominated assets and dollar funding increases. But this relationship is not universal: it depends significantly on whether the stress originates inside or outside the U.S. financial system.
Three Regime Shift Scenarios
Without assigning specific probability estimates (that work is reserved for our paid research frameworks), three qualitatively distinct scenarios are worth understanding clearly:
Scenario 1 (Growth Scare, No Credit Break): PMIs weaken, equities reprice, but credit spreads remain reasonably contained, initial claims stay below 250,000, and funding markets continue to function normally. This is an uncomfortable environment but not a systemic one. Historical analogues include 2015–2016 and the late-2018 correction.
Scenario 2 (Credit-Led Slowdown): High-yield spreads widen materially above 500 basis points, refinancing conditions deteriorate for leveraged borrowers, initial claims begin trending toward and above 300,000, and bank lending standards tighten measurably. This is where recession probability increases substantially and our systemic risk framework enters elevated territory.
Scenario 3 (Systemic Liquidity Event): Funding markets dislocate, repo rates spike, dollar shortages appear across cross-currency basis markets, margin calls cascade, and forced deleveraging creates self-reinforcing selling pressure. This scenario requires explicit policy intervention to stabilize. March 2020 and September 2008 are the modern reference cases.
What Would Signal That Stress Is Easing?
Frameworks that only identify crisis signals are analytically incomplete. The regime shift process runs in both directions, and understanding what stabilization looks like is as important as understanding what deterioration looks like.
Positive developments I watch for include: global liquidity stabilizing and beginning to expand again, HY spreads tightening from elevated levels back toward or below 400 basis points, MOVE declining and holding sustainably below 80, initial claims stabilizing and trending lower, funding markets normalizing with SOFR spreads returning to typical ranges, and refinancing markets reopening for the middle tier of the credit spectrum. When several of these stabilization signals emerge simultaneously, the probability of a sustained regime shift diminishes materially, and risk assets typically begin to price that recovery well before headline economic data confirms it.
A 10-Minute Weekly Financial Stress Check
For readers who want to integrate these indicators into a regular monitoring practice, the sequence I would recommend is as follows. Check global liquidity direction first: the Fed’s H.4.1 weekly release gives you the core picture on bank reserves and balance-sheet dynamics in a few minutes. Check high-yield spreads second: FRED’s BAMLH0A0HYM2 series updates daily and gives you the real-time credit-market read. Check MOVE third: is Treasury volatility elevated or contained, and is it moving in the same direction as credit spreads or diverging? Check initial claims fourth: is the four-week moving average trending higher, and is it approaching our 300,000 warning threshold on a sustained basis? Check the yield curve fifth: what is the 2s10s spread, and is re-steepening occurring through short yields falling or long yields rising, because the reason matters enormously. Check funding markets sixth: any unusual activity in overnight repo rates or SOFR-OIS spread behavior? Check refinancing conditions seventh: are high-yield bond issuance volumes contracting, and are credit conditions surveys from the Fed’s SLOOS showing tightening lending standards?
Then compare the aggregate picture against Era CrisisMeter and the Era Global Risk Index to see how the individual signals compare to our composite systemic-risk assessment.
Common Mistakes When Reading Financial Stress Indicators
Reacting to a single data point: One week of elevated initial claims, one spike in MOVE, one week of spread widening: none of these individually establish a trend. E.R.A. OF CHANGES always evaluates direction over multiple weeks, not a single print.
Watching VIX but ignoring credit: VIX is visible, widely reported, and frequently misread as a financial stress indicator. It measures equity option pricing, and it can spike without any deterioration in the credit or funding conditions that actually define systemic stress.
Waiting for GDP to confirm recession: GDP is the most lagging of the major economic indicators. By the time two consecutive negative quarters appear in official data, institutional portfolios have usually already made their primary adjustments.
Treating yield-curve inversion as a countdown clock: The 2022–2024 inversion persisted for over two years without a recession materializing in the traditional sense. Inversion is a structural signal, not a timing instrument.
Looking only at the federal funds rate: What matters for financial stress is not just where the Fed sets its policy rate, but what happens to funding conditions, credit availability, and real borrowing costs throughout the system, which can diverge significantly from the policy rate.
Ignoring refinancing maturities. Higher rates can affect borrowers gradually as existing debt reaches maturity. Some loans originated during the low-rate period may need repayment, refinancing, or restructuring in 2026-2027, but exposure varies by loan terms, property type, and borrower. MBA’s maturity schedule identifies balances coming due; it does not establish that most of those loans originated in 2020-2022 or that refinancing stress is inevitable. Source.
What Financial Stress Indicators Cannot Tell You
I want to be honest about the limitations here, because intellectual honesty about what a framework cannot do is as important as explaining what it can.
Financial stress indicators cannot reliably predict the exact date of a market correction, identify every bank that will fail, guarantee recession timing, eliminate false positives, or tell any investor specifically what to buy or sell. The NBER’s research on business cycle dating, the Federal Reserve’s work on credit transmission, and the BIS’s financial stability analyses all acknowledge that no indicator set provides a guaranteed leading signal in every cycle.
What these indicators can do is identify changes in the probability and severity of financial stress before those changes become fully visible in headline economic data. The purpose is not prediction with certainty. The purpose is a more calibrated picture of systemic risk that supports better-informed decisions about portfolio construction, risk exposure, and scenario preparation.
E.R.A. OF CHANGES Analyst’s Perspective
As of early October 2026, my assessment is one of late-cycle pressure, not a confirmed regime shift. The picture includes low ON RRP usage, a Benzinga-reported MOVE close of 101.82 on September 28, and high-yield OAS widening from 273 basis points on September 23 to 312 on September 30 in the ICE series available through FRED. Separately, the 2s10s Treasury spread was +46 basis points on October 1. These observations come from different dates and measures; together they inform my assessment, but do not mechanically establish a recession or systemic event. Source. Source 2. Source 3.
The scheduled $875 billion in 2026 CRE maturities is a significant refinancing exposure in my framework. Properties with weak cash flow, high leverage, or reduced valuations can face difficult financing decisions. Their outcomes are not predetermined: loan terms, repayments, modifications, and lender behavior all matter. I am watching whether property-level credit stress remains contained or begins to affect broader lending standards and funding conditions. Source.
How E.R.A. OF CHANGES Uses Financial Stress Indicators in Its Research Process
Our analytical process moves through a layered sequence designed to reduce the risk of over-indexing on any single variable:
Macro and liquidity data → credit conditions → funding markets → labor and refinancing → cross-asset confirmation → systemic risk assessment → scenario construction and invalidation criteria.
Each stage adds information, and each stage can confirm or undermine the signal from the previous one. An analyst who works through the first stage and concludes that liquidity is contracting, then finds that credit spreads are simultaneously narrowing (which sometimes happens when central banks are cutting rates into a slowing economy), has a much more nuanced picture than if they had stopped at the first layer. Indicators are evidence inside a forecasting framework, not standalone predictions. This process is described in detail in our Forecasting Methodology.
Frequently Asked Questions
What are financial stress indicators?
Financial stress indicators are data series that track the health of the financial system’s ability to provide credit, fund leverage, refinance debt, and absorb losses. They differ from general economic indicators in that they focus on the plumbing of the financial system (credit spreads, funding rates, liquidity conditions) rather than on output measures like GDP or employment. The most widely used categories include credit market indicators such as high-yield OAS, funding-market indicators such as SOFR spreads and repo rates, liquidity indicators such as central-bank balance sheets and M2, and labor-market indicators such as initial jobless claims.
What is a financial stress index?
A financial stress index is a composite measure that combines multiple individual indicators into a single aggregate reading of systemic stress. The Federal Reserve banks of Kansas City, Cleveland, and Chicago each publish versions with different methodologies and component weightings. our own CrisisMeter functions as our proprietary version of this concept, combining liquidity, credit, monetary policy, capital flows, and geopolitical-financial risk into a broader systemic assessment framework.
What indicators signal a market crisis?
No single indicator reliably signals a market crisis in advance with high precision. What most crisis periods share is a confluence of deteriorating signals across multiple independent categories: funding-market stress involving repo spikes and SOFR widening, sharp high-yield spread widening typically above 500–600 basis points, sustained deterioration in initial jobless claims, and material contraction in global liquidity conditions. The March 2020 liquidity crisis showed simultaneous deterioration across all four categories within approximately three weeks.
What is the best single indicator of financial stress?
There is no single best indicator, and that is a structural feature of financial stress, not a limitation of the analytical framework. High-yield credit spreads are often cited as the most reliable medium-term leading indicator, and they are among the most important in our framework. But spreads can remain tight late into a credit cycle through institutional complacency, and they can widen temporarily on idiosyncratic events without signaling systemic stress. The most reliable signal in our experience is a sustained confluence of HY spread widening accompanied by MOVE elevation and deteriorating funding conditions.
Why are high-yield spreads important?
High-yield spreads represent the real-time collective judgment of professional credit investors about default probability and recovery rates across the below-investment-grade corporate spectrum. Because these investors are primarily concerned with whether borrowers can repay principal (rather than how much earnings might grow), they can sometimes identify solvency and refinancing problems before equity investors fully reflect those concerns in stock prices. The ICE BofA US HY Index OAS, available through FRED, is the most commonly referenced version of this indicator.
What does the MOVE Index measure?
MOVE is ICE’s U.S. bond-market yield-volatility index, calculated using a basket of over-the-counter options on interest-rate swaps. It is conceptually similar to VIX as a volatility measure, but it covers a different market and methodology. Sustained elevation may warrant closer monitoring, especially alongside wider credit spreads or funding disruption; MOVE is not an official definition of systemic stress and has no universal crisis threshold. Source.
Why do initial jobless claims matter for financial stress assessment?
Initial jobless claims are reported weekly, making them one of the highest-frequency labor-market indicators available. Unlike the monthly unemployment rate, which requires sustained deterioration across multiple months to move materially, initial claims can reflect the beginning of layoff trends within the first few weeks of a labor-market shift. E.R.A. OF CHANGES uses a ~300,000 sustained four-week moving average as an internal analytical threshold for materially increasing its U.S. recession assessment, not as an official definition, but as a level at which the evidence of broad labor-market deterioration becomes more compelling than the alternatives.
What does yield-curve re-steepening mean?
Yield-curve re-steepening means the difference between long-term and short-term yields increases after flattening or inversion. Bull steepening is driven by short yields falling faster and can reflect expected easing; bear steepening is driven by long yields rising faster and can reflect inflation or term-premium concerns. Those are interpretations to test against other evidence. Re-steepening alone is not a calibrated recession probability or proof that emergency easing has begun. Source.
What is funding-market stress?
Funding-market stress occurs when the costs or availability of short-term borrowing in interbank markets deteriorate in ways not directly explained by changes in the Federal Reserve’s policy rate. It manifests through rising overnight repo rates, widening spreads between SOFR and the expected federal funds rate, cross-currency basis swaps that reveal elevated demand for U.S. dollars from foreign institutions, and contracting bank reserve balances. Funding-market stress matters because financial institutions rely on short-term borrowing to maintain leverage, provide market liquidity, and intermediate credit, and when that funding becomes expensive or unavailable, positions are reduced and market liquidity can deteriorate rapidly.
How does repo-market stress affect investors?
Repo-market stress occurs when overnight repurchase agreement rates spike above typical ranges, indicating that financial institutions are having difficulty obtaining short-term secured financing. When this happens, institutions may be forced to reduce leverage rapidly, which can produce sudden selling of otherwise liquid assets to raise cash. This creates forced-selling dynamics that can temporarily disconnect asset prices from fundamental values. The September 2019 repo-market dislocation, which caused overnight rates to briefly reach 10% before Fed intervention, is the most relevant recent reference point.
What is a refinancing wall?
A refinancing wall is a period when many loans reach maturity close together. Borrowers may need to repay, refinance, modify terms, or sell assets, and the result depends on cash flow and market conditions. MBA estimated $875 billion in commercial and multifamily mortgage balances scheduled to mature in 2026 and $652 billion in 2027, using unpaid principal balances as of December 31, 2025. These amounts are a maturity schedule, not a forecast of defaults or a guarantee that all balances will be refinanced. Source.
How does commercial real estate create financial stress?
Commercial real estate creates financial stress primarily through the bank and lending exposure channel. When CRE values fall and refinancing conditions deteriorate simultaneously, borrowers unable to service new debt at current rates begin to default. Those defaults produce credit losses at banks and non-bank lenders with CRE exposure, which can lead to tighter lending standards across the sector and, in more severe cases, across corporate credit more broadly. U.S. regional banks have particularly concentrated CRE exposure relative to their capital bases, making them vulnerable to concentrated stress in office, hospitality, and other high-vacancy property types.
What is the difference between market volatility and systemic risk?
Market volatility describes price fluctuations; systemic risk concerns impairment of funding, credit, refinancing, and loss absorption across the financial system. The two can overlap. March 2020 involved both extreme volatility and serious funding-market disruption, followed by large policy interventions. Conversely, credit deterioration can build while equity volatility is still modest. I therefore assess prices alongside credit and funding conditions rather than treating either as a complete measure. Source.
How does Era CrisisMeter measure market stress?
Era CrisisMeter integrates multiple dimensions of systemic financial risk into a composite reading, combining liquidity conditions, credit market signals, monetary policy direction, capital flow patterns, and geopolitical-financial transmission. Rather than focusing on any single indicator, it is designed to give a broader assessment of how multiple risk dimensions are evolving together. The full methodology and current reading are described in Era CrisisMeter Explained.
What is the Era Global Risk Index?
The Era Global Risk Index is our broadest systemic risk measure, updated from 24 structural indicators and designed to provide a forward-looking measure of systemic financial stress that incorporates macro, financial, liquidity, geopolitical, and systemic risk dimensions together. Where financial stress indicators answer the question of where stress is appearing, and Era CrisisMeter answers how severe current systemic stress is, the Era Global Risk Index provides the broadest contextual reading of how the entire risk environment is evolving. A full explanation is available at the Era Global Risk Index methodology page.
About E.R.A. OF CHANGES
E.R.A. OF CHANGES publishes macroeconomic research, financial-market analysis, and geopolitical risk assessments. Our work combines quantitative indicators with analyst judgment in proprietary research frameworks. These frameworks are tools for interpreting risk, not guarantees of future performance or independently calibrated event probabilities. Readers can explore our methodology, forecast archive, and research catalogue on the website.
The content published by E.R.A. OF CHANGES is for informational and educational purposes only and does not constitute financial, investment, legal, or tax advice. All views expressed are the personal analytical perspective of the author. Past forecast accuracy does not guarantee future results. Readers should conduct their own research and consult a qualified financial professional before making any investment decisions.
Sources
Liquidity and Funding - Federal Reserve H.4.1, September 24, 2026 - New York Fed: Overnight Reverse Repo Facility FAQ - FRED: Secured Overnight Financing Rate - Federal Reserve: Response to March 2020 Market Disruption
Credit Spreads and Bond Volatility - FRED: ICE BofA U.S. High Yield Index Option-Adjusted Spread - FRED: ICE BofA CCC and Lower U.S. High Yield Index Option-Adjusted Spread - ICE: MOVE Index Description - Benzinga: Reported September 28, 2026 MOVE Reading
Labor and Yield Curve - U.S. Department of Labor: Unemployment Insurance Releases - FRED: Four-Week Moving Average of Initial Claims - FRED: 10-Year Minus 2-Year Treasury Yield - U.S. Treasury: Daily Treasury Par Yield Curve Rates, 2026 - Federal Reserve: Yield Curve Research
Refinancing and Business Cycles - MBA: Commercial and Multifamily Mortgage Maturities in 2026 - NBER: U.S. Business Cycle Dating
Internal E.R.A. OF CHANGES Research - Era CrisisMeter Explained - Era Global Risk Index - Era Forecasting Methodology - Yield Curve Explained - What Is M2 Money Supply? - How Interest Rate Hikes Affect Markets - How Political Events Affect Financial Markets - Bitcoin Cycles Explained - Global Debt Risks 2026 - Global Recession Probability Report - Gold Market Outlook 2026



