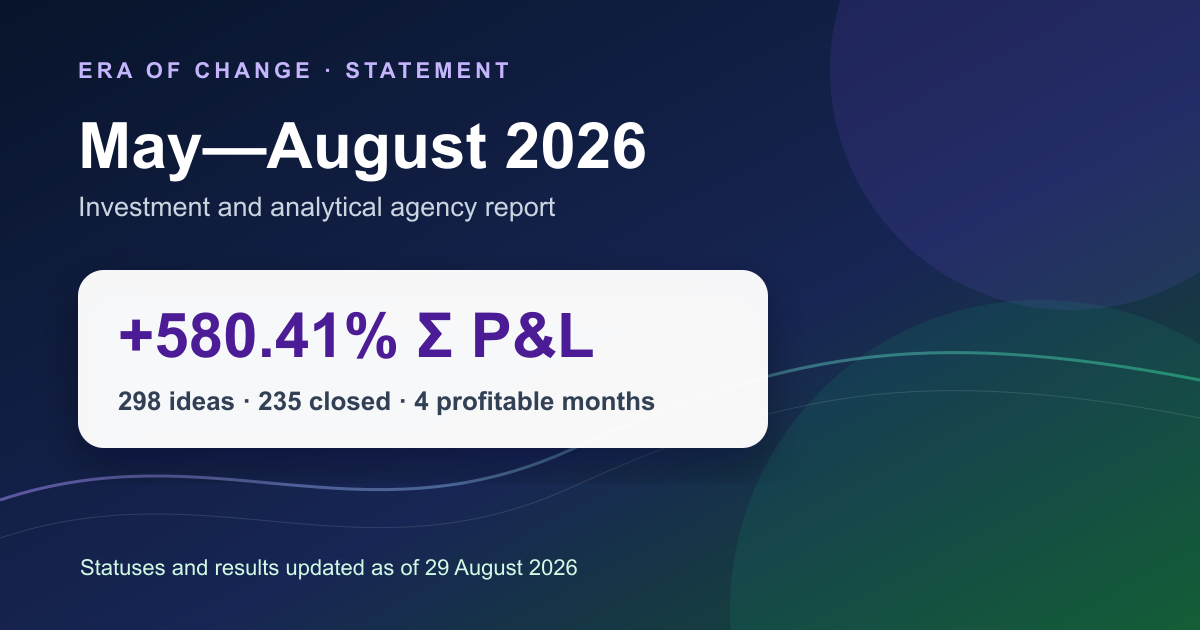
"Era of Change" Report for May–August 2026: 298 market ideas, 235 closed scenarios, and +580.41% total P&L. Attached is an anonymized line-by-line breakdown with direct links to the original publications.
Statement · May–August 2026
Four months of consistent performance: +580.41% total P&L
From May 1 to August 29, 2026, analysts at “Era of Change” published 298 market ideas. 235 scenarios have already been closed, and the total P&L for the closed ideas amounted to +580.41%. Each of the four months concludes the current period with a positive result.
1. Period Results
This report combines two operating modes. The stock segment provided scale, consistency, and the bulk of the results. The cryptocurrency segment operated significantly less frequently but maintained a higher average return per closed idea. Overall , the sum of positive results exceeded the sum of negative results by approximately 3.53 times.
| Metric | Total | Stock Market | Cryptocurrency Market |
|---|---|---|---|
| Ideas Published | 298 | 282 | 16 |
| Closed | 235 | 225 | 10 |
| Completed or closed as "used" | 186 | 180 | 6 |
| Closed due to stop-loss | 49 | 45 | 4 |
| Still open | 63 | 57 | 6 |
| Percentage of "Completed + Inactive" | 79.1% | 80.0% | 60.0% |
| Closings with actual P&L > 0 | 162 / 68.9% | 156 / 69.3% | 6 / 60.0% |
| Total P&L, net | +580.41% | +515.53% | +64.88% |
| Average P&L of closed trades | +2.47% | +2.29% | +6.49% |
2. Monthly Performance
May, June, July, and August ended the current period with a positive cumulative result. May had the strongest performance in terms of total P&L, while July showed the highest percentage of profitable trades. August reflects an incomplete month: 42 new ideas are still active and are not included in the total P&L.
May
+192.45%
June
+152.14%
July
+180.48%
August*
+55.34%
* August data is as of August 29, 2026.
| Month | Published | Closed | P&L > 0 | Σ P&L |
|---|---|---|---|---|
| May | 76 | 69 | 60.9% | +192.45% |
| June | 74 | 68 | 63.2% | +152.14% |
| July | 79 | 71 | 78.9% | +180.48% |
| August* | 69 | 27 | 77.8% | +55.34% |
3. Stock Market: Scale and Stability
The stock market segment accounted for 282 publications—94.6% of the sample. A total of 225 scenarios were closed, of which 180 were executed or closed at breakeven. This segment accounted for 88.8% of the period’s total net return and ended every month in the black.
- Total results of executed and break-even ideas: +628.54%.
- Total results of stop scenarios: −113.01%.
- Net Σ P&L: +515.53%.
- Average result in the “executed + break-even” group: +3.49%; average stop-loss: −2.51%.
The improvement in the quality of closings was particularly noticeable in the second half of the period: the share of actual positive results rose to 78.9% in July and 77.8% in August. However, the August sample is still maturing—42 ideas remain open.
4. Cryptocurrency Market: Rare but Striking Results
Publication activity in the cryptocurrency segment of the sample under review was concentrated in May: 16 ideas, 10 of which have already been closed. Six of these closed positions ended with a positive actual P&L.
- Total return on executed ideas: +172.46%.
- Total results of stop scenarios: −107.58%.
- Net Σ P&L: +64.88%.
- Average executed trade: +28.74%; average stop: −26.89%.
The profile remains highly volatile: the average profit and average stop are significantly wider than in the stock market. Therefore, cryptocurrency statistics should be evaluated as a separate module and not directly applied to a unified portfolio.
5. Comparison with the Previous Report
In the January–April report, as of the reconciliation date of July 30, 2026, 15 scenarios remained open. By August 29, two of them had closed. Their combined return was +13.96%: one profitable scenario offset one stop-loss scenario. Another 13 previous ideas remain active.
The +13.96% result is shown for reference only and is not included in the +580.41% for the new period.
6. Market Conditions: The Edge of Short Scenarios
Short scenarios accounted for 72.0% of the period’s total return. At the same time, the proportion of actual positive closes for long and short positions was similar—the advantage of short ideas stems primarily from the magnitude of returns, not just the frequency of success.
| Direction | Published | Closed | P&L > 0 | Σ P&L |
|---|---|---|---|---|
| Short | 183 | 146 | 68.5% | +418.16% |
| Long | 115 | 89 | 69.7% | +162.25% |
7. Assets with the Largest Contribution
The table below shows the P&L total for closed trades for each asset during the reporting period. This figure reflects the contribution to the statistical sample, not the return on a position with a fixed capital size.
Stock Market
- WEAT (Teucrium Wheat Fund) — 1 close, +63.16%
- Brent (UKOIL) — 2 closes, +36.01%
- Strategy (MSTR) — 1 close, +33.82%
- Micron (MU) — 1 close, +27.13%
- Oracle (ORCL) — 1 close, +21.25%
Cryptocurrency Market
- NEAR — 1 close, +35.90%
- HYPE — 1 close, +33.09%
- CELO — 1 close, +31.49%
- INJ — 1 close, +28.33%
- ETC — 1 close, +27.00%
8. What the Second Four-Month Cycle Shows
The company maintained a positive result each month despite a significantly changed flow structure. The focus shifted to the equity segment, and the quality of closed trades improved in July and August. At the same time, accounting discipline remained unchanged: open positions are not included in the total P&L, and the results of the previous cohort are shown separately.
Conclusion
From May through August 2026, “Era of Change” published 298 ideas, closed 235 of them, and generated a total P&L of +580.41%. The sum of positive results exceeded the sum of negative results by a factor of 3.53, and 162 closed trades ended with an actual P&L above zero.
Taking into account the January–April update, the cumulative snapshot for 2026 covers 611 published ideas, of which 535 have been closed. The total P&L for closed ideas across the two periods reached +1,630.61%. These statistics represent independent forecasts, not the return on a single portfolio.
Public Appendix to the Report
Line-by-line breakdown of all 298 ideas
An anonymized Google Sheet contains the parameters and current status of each idea from the reporting period. Employees’ first and last names have been removed. The last column of each row contains a direct link to the original post—any reader can open the post and verify the transaction.
Access: view-only. The company’s original working spreadsheets are not published and have not been modified.
Technical Notes
- New report selection period: publication dates from May 1, 2026, through August 29, 2026, inclusive.
- Statuses and results are updated as of August 29, 2026.
- Only closed ideas are included in the total P&L calculation; 63 “in progress” scenarios from the new period are excluded.
- The 79.1% share includes the statuses “completed” and “inactive.” The share of closed ideas with an actual P&L above zero—68.9%—is shown separately.
- The reconciliation for the previous cohort is presented separately to avoid mixing publication periods.
- Due to the rounding of results in individual rows, the sum of the detailed values may differ from the aggregate figure by a few thousandths of a percentage point.
Disclaimer: Past performance is not a guarantee of future results. The materials from “Era of Change” are for research and informational-analytical purposes only and do not constitute individual investment advice, an offer, or a trading signal. Any decisions made in financial markets carry the risk of total or partial loss of capital.



