
This is the main forecast of the year. It’s not a weekly roundup or an analysis of a single news story—it’s the complete picture of 2027 broken down by categories: war, oil, the U.S. market, gold, the dollar, the ruble, and the Russian stock index. It includes dates, levels, and the conditions under which I’ll admit I was wrong.
I’ll warn you right away: it’s a grim scenario. But it didn’t come out of thin air—it’s a continuation of the line of thinking I’ve been developing on this site for several years now. So I’ll start not with something new, but with something old.
Section 0. What I’ve Written About 2027 Before
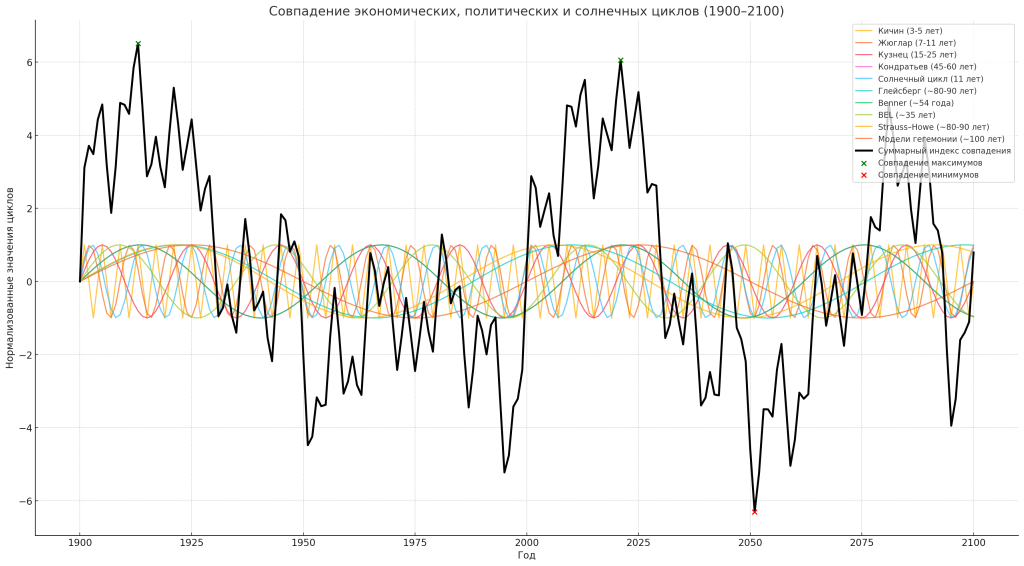
June 2025. A cyclical forecast through 2050. We combined the cycles of Kitchin, Juglar, Kuznets, and Kondratiev cycles into a single calculation, added the Benner cycle, solar cycles, and the Strauss-Hau generational model, and mapped out each year through the middle of the century. The entry for 2027 is brief and stark: “A year of high social tension. The collapse of major institutions and a loss of trust in the elites are possible.” I’m not changing the wording. I’m just clarifying which institutions and in what order.
June 2025. Analysis of southern Ukraine. A phased operation: a massive strike on infrastructure to cut the country off from the sea, followed by an internal factor, then the deployment of troops. At the time, this was dismissed as alarmism. Today, the debate is not about whether it will happen, but about the timing.
July 2026. “Half the forecast has come true.” Oil at 140 coupled with a rising dollar index—a sign of a stagflationary shock. An S&P 500 correction of about 15%. The dollar above 100 rubles. The RTS at 500 points. Back then, the dollar was worth less than 90 rubles, and it was considered taboo to even mention the RTS hitting 500.
August 2026. “The Perfect Storm of 2026–2029.” Four phases for the dollar: stabilization, dollar shortage, policy reversal, inflationary momentum. The sequence for the dollar index: 100, then 108–115, then 70–80.
October 2026. How I use forecasts in practice. There, I showed not only numbers but also positions: put options on the S&P 500 at 7,740, a long position in the Dollar Index with a close at 120, and gold sold near 4,500. Targets: S&P 500—5,000–5,500, RTS—below 500 with a target of 400; dollar to ruble—130–140 with a time horizon of spring 2027; gold—a decline to 2,800–3,000.
October 2026. “The Second 1929.” The mechanics of the crisis in their entirety and my main bet: all my money on this scenario. Oil—first a plunge to 50, then a rally to 240.
The forecast for 2027 that you’re reading isn’t a new idea. It’s the same framework, broken down by month and asset class. If you’ve read the items listed above, you’ll recognize every element. What’s new here are the timing and the sequence of events.
Now, by section.
Section 1. Politics and War
1.1. This Winter: Strikes on Moscow and St. Petersburg
I’ll start with the most immediate scenario, because it’s already on the horizon, not halfway through the year.
This winter, I expect missile and bomb strikes on Moscow and St. Petersburg from Ukraine. Not the isolated drone incursions we’ve grown accustomed to over the past three years—and which no longer make headlines—but strikes of a different caliber, range, and intensity. The difference is fundamental: a drone strike on an oil refinery is economic damage; a strike on the capital is a political event.
The response will be symmetrical in logic and asymmetrical in scale: Russia will begin to pound Ukrainian cities with missiles. Not targeted strikes against energy infrastructure, as in recent winters, but strikes against cities. This is the threshold beyond which talk of “de-escalation” ends and the arithmetic of reserves begins.
I’ve said this everywhere, and I’ll repeat it here: it is precisely a winter escalation that marks the turning point after which the negotiation track falls silent for several months. A strike on the capital cannot be “overlooked” or brushed aside. It changes the domestic politics of both countries faster than any diplomacy and makes any compromise political suicide for whoever agrees to it.
For the markets, this means one simple thing: winter and early spring of 2027 are not the time to take on risk. This is the time to have cash on hand.
1.2. Spring: The Active Phase Through the End of April
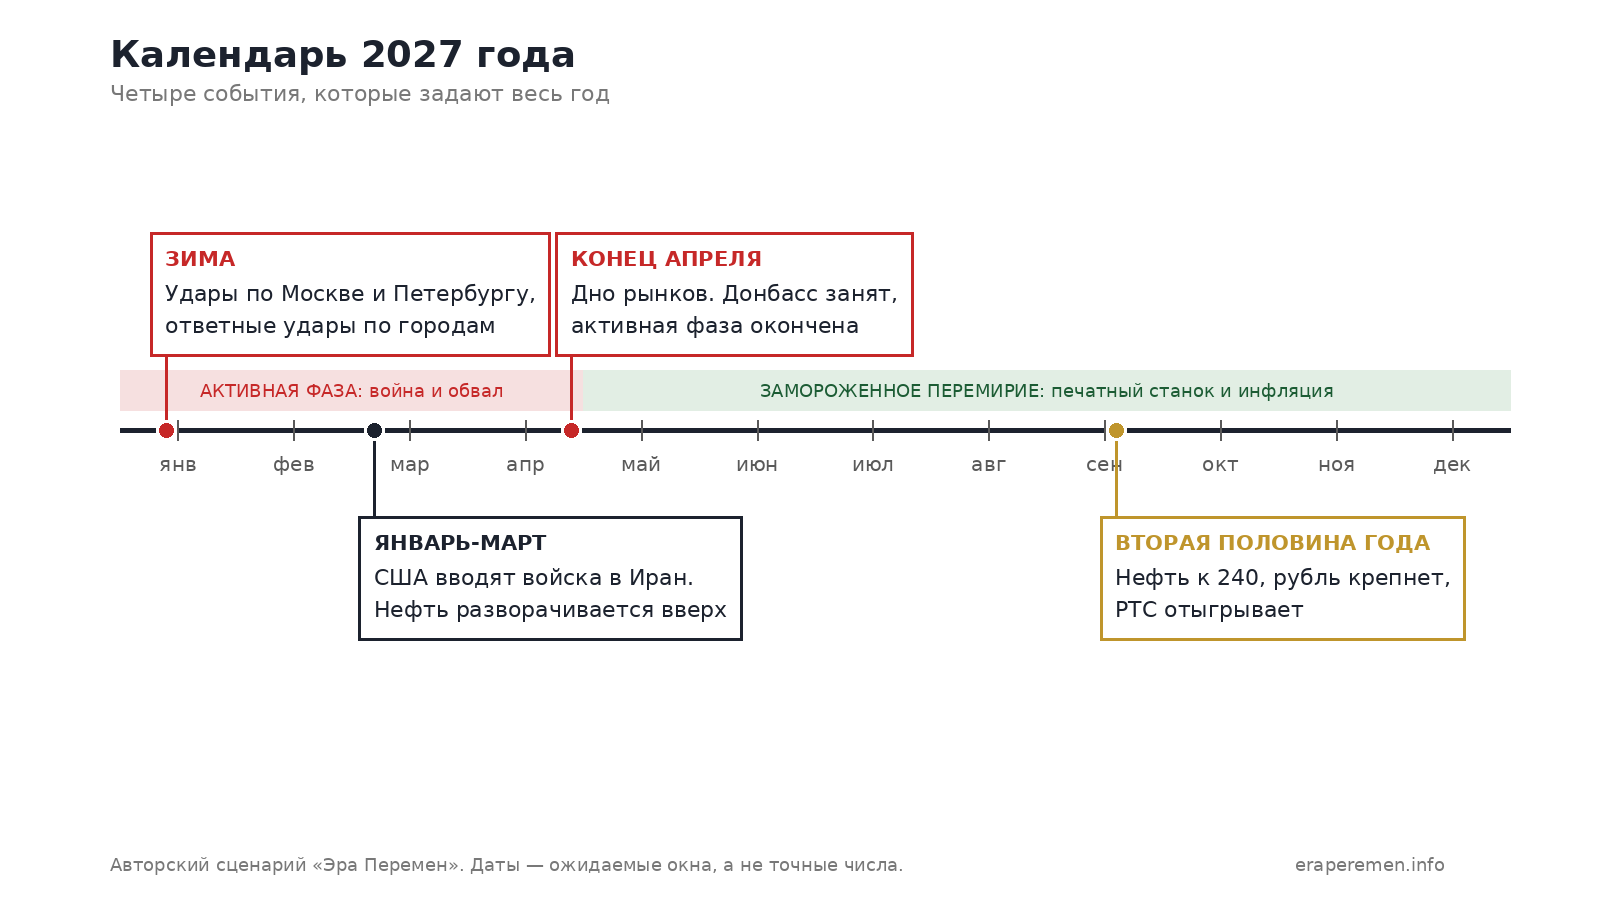
The winter escalation turns into a full-scale war that lasts until the end of April 2027. This is not the positional tug-of-war along the front lines to which everyone has grown accustomed, but rather a high-intensity active phase with decisive stakes.
Then Russia occupies the entire Donbas—and the active phase ends. The remainder of the year unfolds in a state that would be more accurately described not as peace, but as a frozen ceasefire: there may be no formal agreements at all; hostilities simply die down. The logic is extremely simple and unpleasant for both sides: the Donbas has been taken—and that’s it.
Why not fight to the bitter end? Because by spring, both sides will face three constraints at once.
First, mobilization resources. Neither side has an infinite supply, and by 2027, both will have exhausted theirs—just in different ways.
Second—supplies. Ammunition consumption during the active phase far exceeds current production. Stockpiles accumulated over decades will have been depleted by then, and new production capacity won’t reach the required levels—neither in Russia nor in Europe.
Third—external sponsors. By 2027, all participants will have their own budget shortfalls and debt crises. When you’re facing a crisis at home, someone else’s war is the first thing to be cut from the budget.
A war does not end when someone wins. It ends when continuing becomes more expensive than stopping. April 2027—that is my estimate of the point at which this calculation aligns for both sides simultaneously.
What I do not expect: a formal peace treaty recognizing borders, a return to the pre-war status quo, Ukraine’s accession to NATO this year, or a ceasefire lasting longer than two or three years. This is a pause, not an ending.
1.3. Iran: A Second Front and a Trigger for Oil
And this is, perhaps, the main event of the year—and the one that’s hardly ever mentioned.
In 2027, the U.S. will enter Iran. Troops will be deployed. Not airstrikes, as was the case before, but a ground operation.
The window opens after the November elections—no American president would go along with this before then. So, starting in January, and I expect tensions to escalate right at the beginning of the year: after January or in January itself.
There’s a perfectly rational explanation for this, without resorting to conspiracy theories. A war started before an election determines the outcome of that election—and usually not in favor of whoever started it. A war started immediately afterward has a full term to unfold and, by the next election cycle, is either forgotten or sold as a victory. This isn’t unique to the current administration; it’s a general rule of the American political calendar that has held true for decades.
And this is where politics intersects with economics . It is precisely the Iranian crisis that is turning the oil market upside down. By this point, oil prices are already at rock bottom—driven there by a contracting global economy. Then the war premium and a real shortage of physical supplies send prices soaring—and they do so rapidly.
Iran is not just a regional conflict. It’s the Strait of Hormuz, through which roughly one-fifth of global oil trade passes. Any threat to tanker passage transforms the oil market from a price-driven market into a supply-driven market.
Block 2. Oil: First 50, Then 240
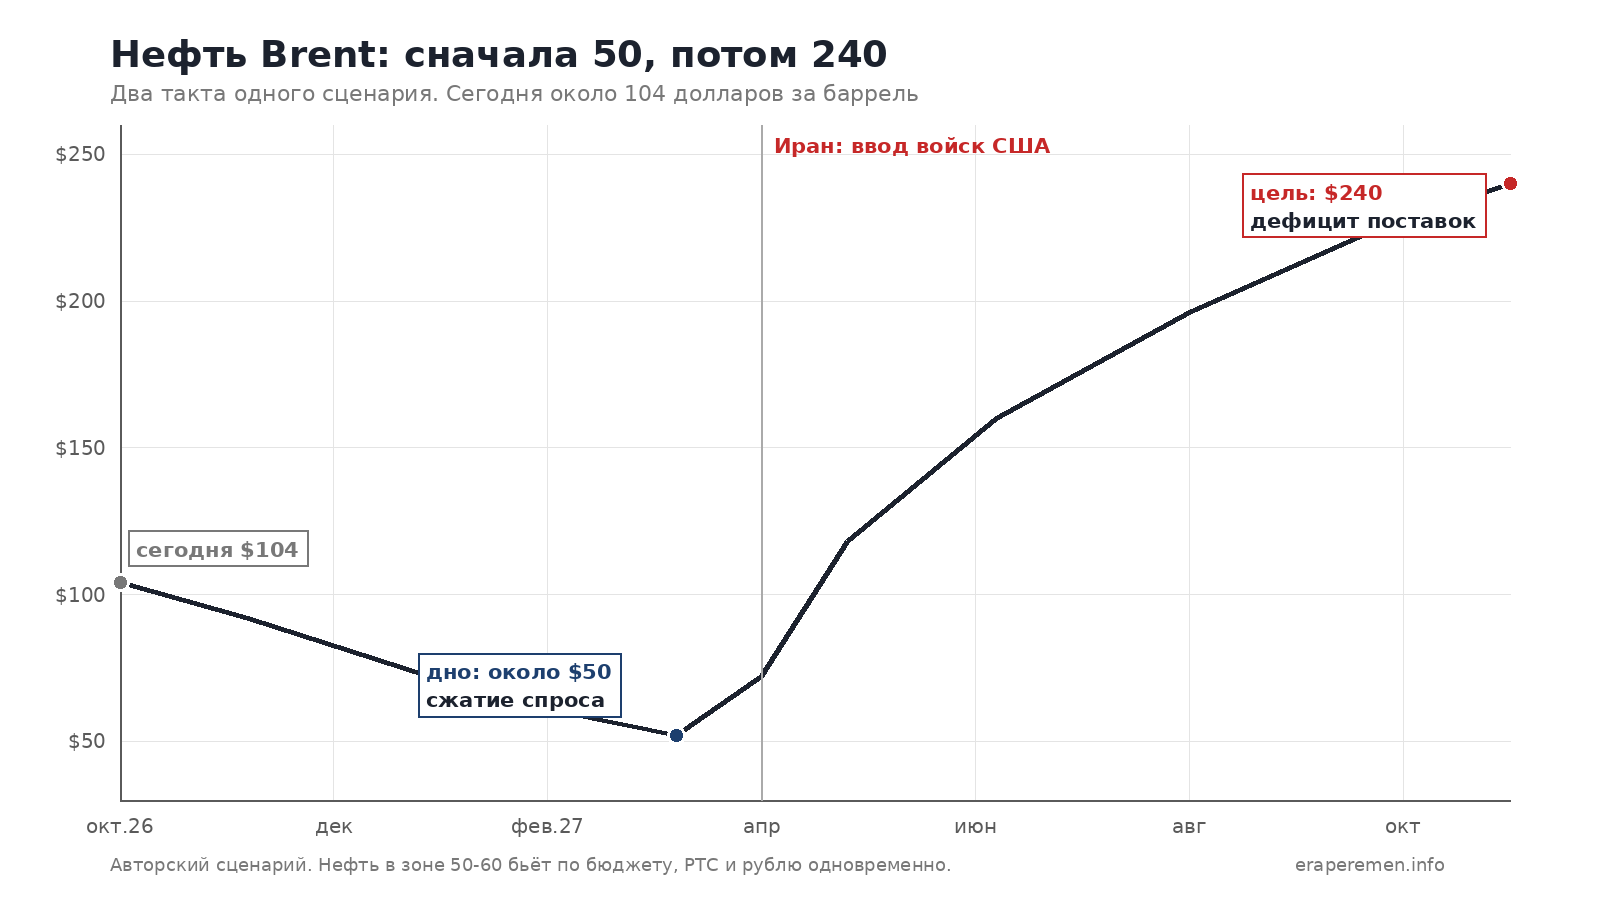
Brent is trading at around $104 per barrel today. My scenario is divided into two phases, and the sequence of events here is more important than the final figure.
The first phase is a drop into the $50 range. The reason is not military but economic: the global economy begins to contract, demand for fuel falls, and the geopolitical premium that is currently propping up oilprices is the first to evaporate. In a general sell-off, everything gets sold, and commodities are no exception. For the Russian budget, this is the main blow of the year: oil in the $50–60 range, combined with a strong dollar, hits revenues, the market, and the ruble all at once.
The second phase—a surge to $240. The trigger: Iran. A physical supply shortage, against the backdrop of an already running printing press, results not in gradual growth but in a price gap. By this point, oil will also have its own long-term driver: years of underinvestment in production and disrupted logistics. There is almost no spare capacity left in the world that could quickly make up for the shortfall.
To be honest about where I’ve revised my outlook. In July 2026, I presented two scenarios for Brent starting from the 70 level: a base case with a rally to 140 and an alternative scenario with a plunge to 46. Since then, oil has moved from 70 to 104—the direction turned out to be correct. Today, I’m shifting my focus toward the alternative scenario: first a sharp drop, and only then a final rally. The end point remains the same; it’s the sequence that’s changing. Anyone who bought oil expecting a straight path to 140 risks seeing 50 first.
Section 3. The U.S. Market: S&P 500 to 5,000
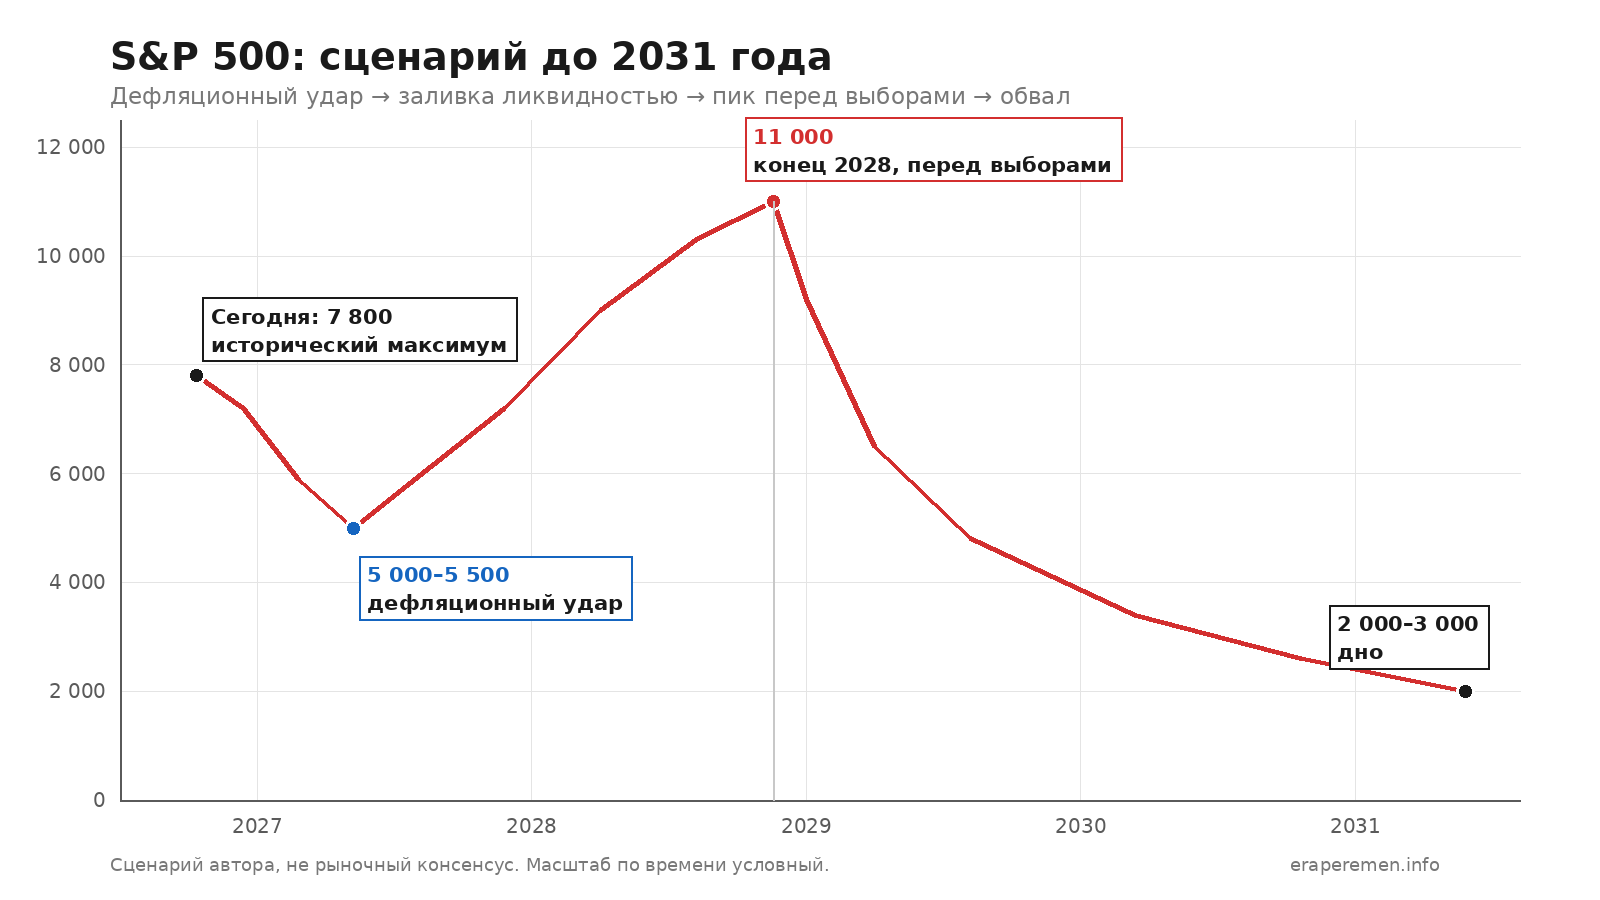
The S&P 500 index stands at around 7,800 points; its all-time high—7,818.93 points—was set on October 6, 2026.
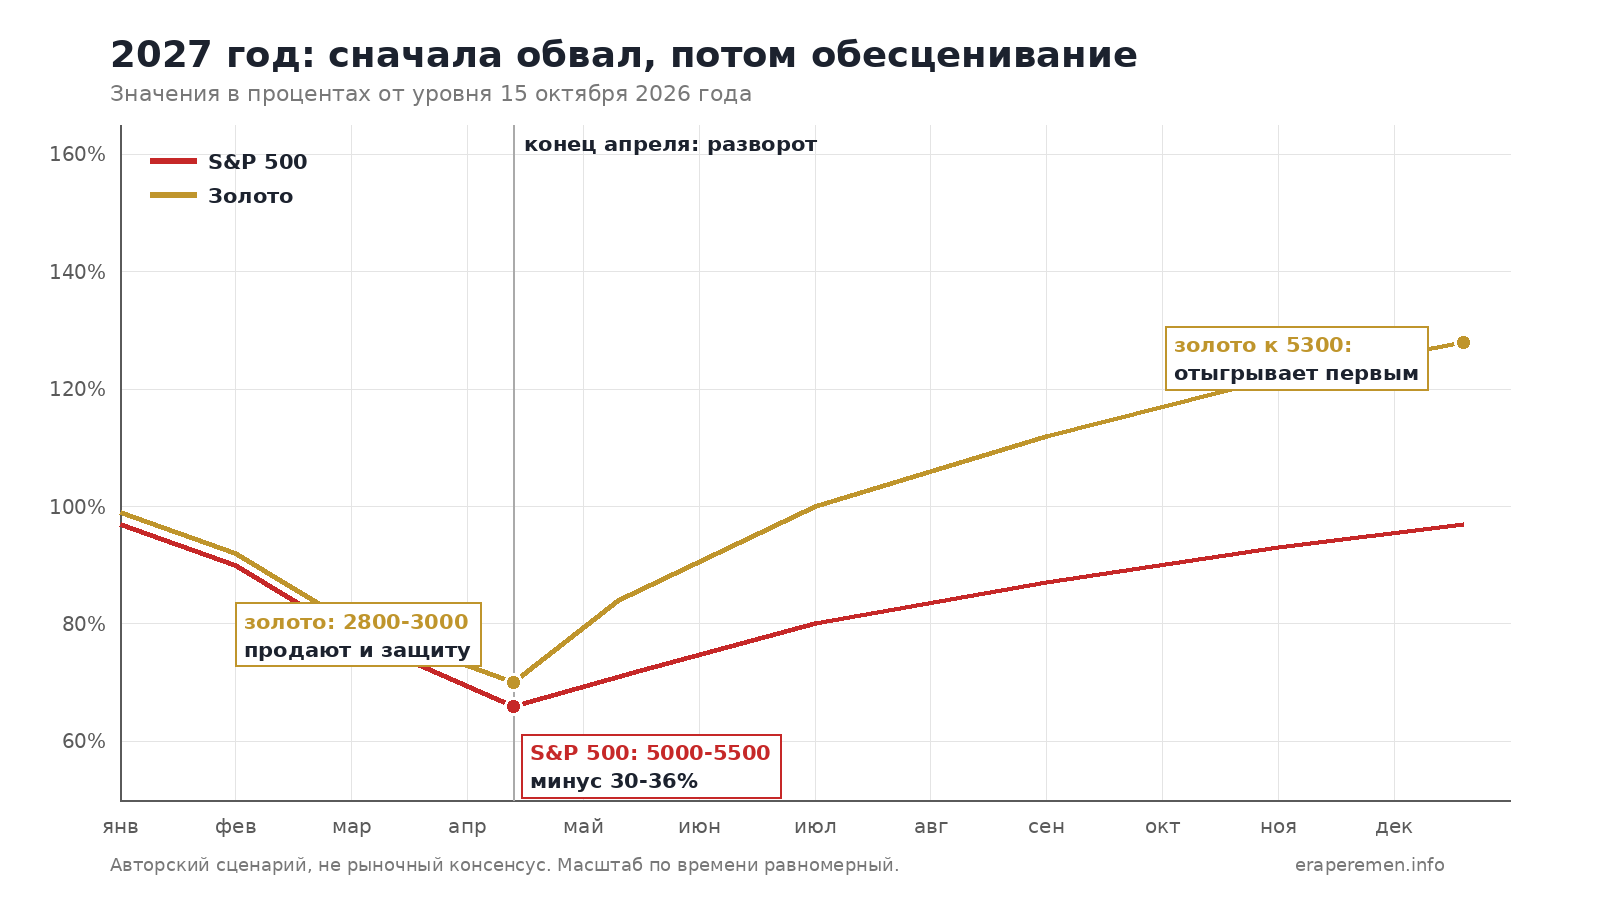
By the end of April 2027, it is expected to fall to the 5,500-point range, or to 5,000 in a severe scenario. This represents a decline of 30–36% from current levels. My public stance on this has not changed since the summer: the market will not rise above 6,100 at most, with the main target range being 5,000–5,500.
The decline is driven by two factors simultaneously. The first is military escalation in two theaters at once. The second, more important factor is a “dollar shortage”: when the cost of money rises and there is no free liquidity, capital flows out of everything into cash. People aren’t selling just good assets—they’re selling anything for which they can get cash.
A separate note on artificial intelligence, which accounts for a significant portion of the index’s current market capitalization. I’m not claiming that the technology doesn’t work. I am saying that valuations are based on cash flows that do not yet exist, and investments in infrastructure are financed by debt. When money is expensive, debt is the first thing to break down.
After April—a reversal at the printing press. And here lies the main trap of the year. The growth in the second half of 2027 will not be an economic recovery. It’s a devaluation of the measuring stick: nominal values are rising, while purchasing power is falling. The index is rising, but that same amount of money buys less than it did a year ago.
During this rebound, those who sat on the sidelines throughout the entire downturn and decided the danger had passed will enter the market. They’ll enter right in the middle of the next round of the cycle.
Section 4. Gold: A Dip Before a Rally
An ounce is currently trading at around $4,150. Gold has risen so much over the past two years that growth has come to seem like the market’s natural state.
I’m expecting gold to drop to the $2,800–$3,000 range. I closed my position around $4,500—not because I’ve lost faith in the metal, but because I was waiting for precisely this drop.
The mechanics are simple and nothing new: when a margin call comes in, you don’t sell what you want to sell, but rather what you can get cash for immediately. Gold is liquid—it’s the first thing to be sold. This is exactly what happened in 2008 and in March 2020: the metal fell along with the market and only then rebounded.
After the rebound, gold recovers faster than stocks because it can’t be printed, whereas money will be printed in large quantities. By the end of 2027, my target is the $5,300-per-ounce range—roughly where the consensus among major investment firms stands today. But my colleagues and I take completely different paths to reach this figure, and for an investor, the difference in the path is more important than the coincidence in the destination.
Section 5. Currencies
5.1. Dollar Index: 120, then a reversal to 70–80
Here, I’m continuing the line of thought I’ve been following since the summer, and I’m not changing anything about it. The target for the Dollar Index is 120. This marks the peak of “dollar hunger”: a global shortage of dollar liquidity, capital flight into the most liquid currency, and forced position closures. The intermediate zone along the way is 108–115.
That’s where I’ll close my dollar position. Not because the scenario is being called off, but because after the peak, the reverse movement begins: a policy reversal, the printing press, and the index sliding into the 70–80 range. The dollar’s peak and the markets’ bottom are one and the same moment, simply measured by different instruments.
5.2. Dollar to ruble: 140 by the end of April, then down to 100
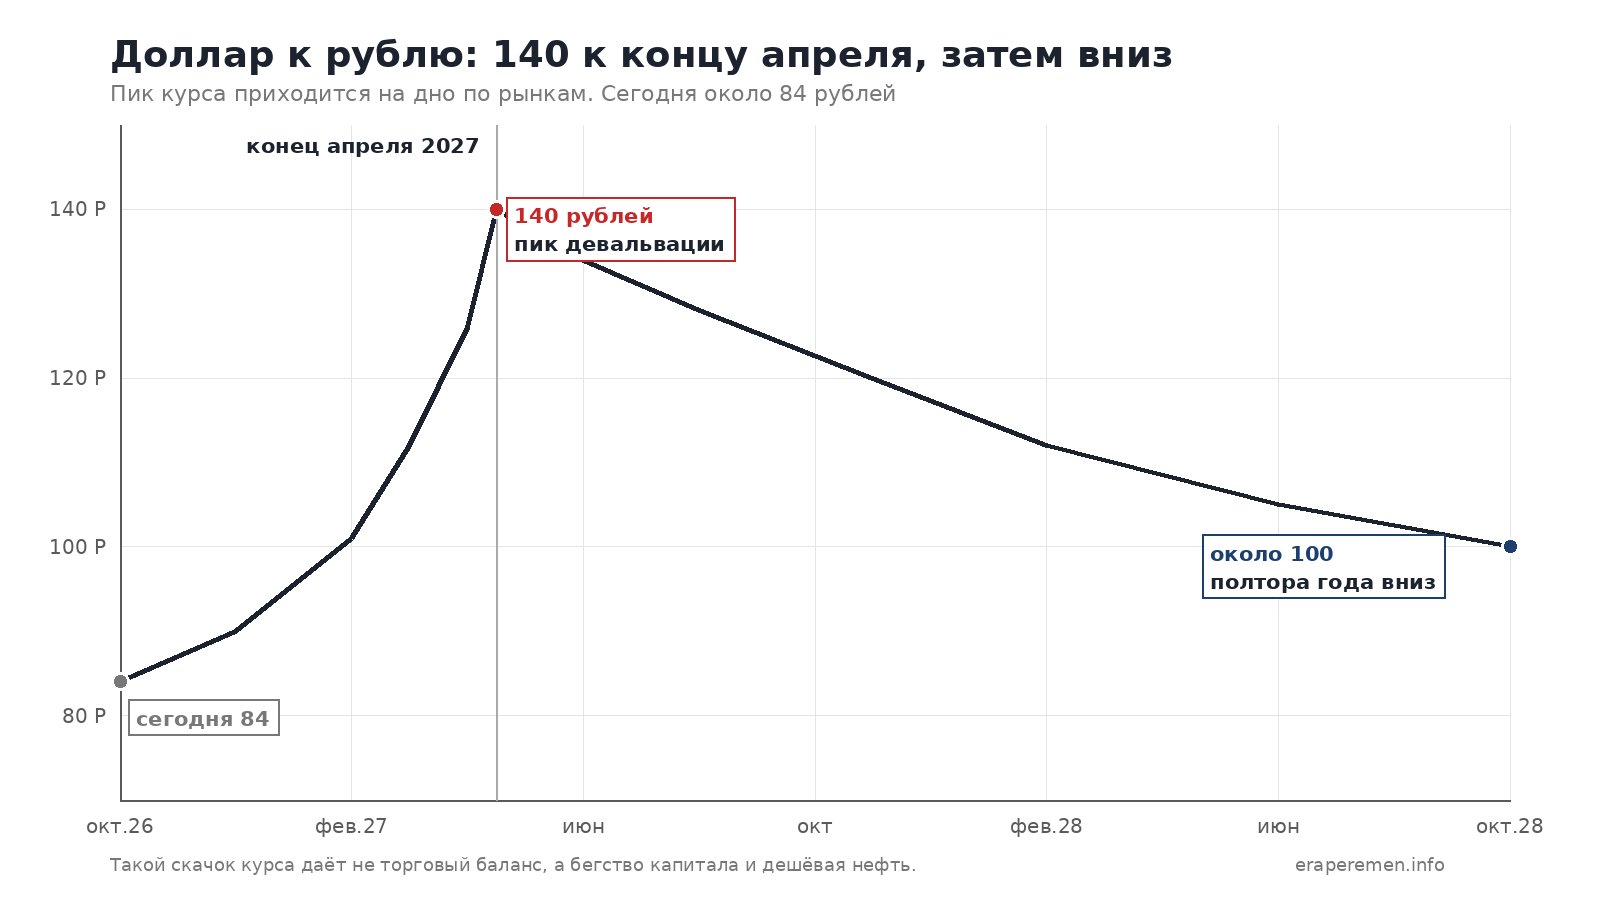
Currently, the official exchange rate is about 84 rubles per dollar.
By the end of April 2027, I expect 140 rubles per dollar. That’s an increase of two-thirds from the current rate over a year and a half. In October, I cited a range of 130–140 with a time horizon of spring 2027—I’m now clarifying: the upper limit of the range will be reached by the end of April.
The factors are all pointing in one direction, and this reason is not economic in nature. Such a surge in the exchange rate does not stem from the trade balance. It arises from a new round of military hostilities and the associated capital flight. Add to this the contraction in foreign exchange earnings with oil prices in the 50–60 range, deficit financing through money creation, and the strengthening of the dollar on the global market to 120 on the index—and you get 140.
Note the coincidence of dates. The peak in the dollar coincides exactly with the bottom in oil prices, the market bottom, and the turning point on the front lines. These are not three separate events; they are a single event viewed from four different angles.
Then comes the reversal. Over the next year and a half, the exchange rate slides back down—all the way to 100 rubles per dollar—and may fluctuate within that range. The reason for the reversal is not the strengthening of the Russian economy. The reason is that by this point, oil prices will have risen to 240, foreign exchange earnings will have recovered, and the dollar itself will have weakened against real assets worldwide.
Section 6. The Russian Market: RTS to 400, Then to 1,500
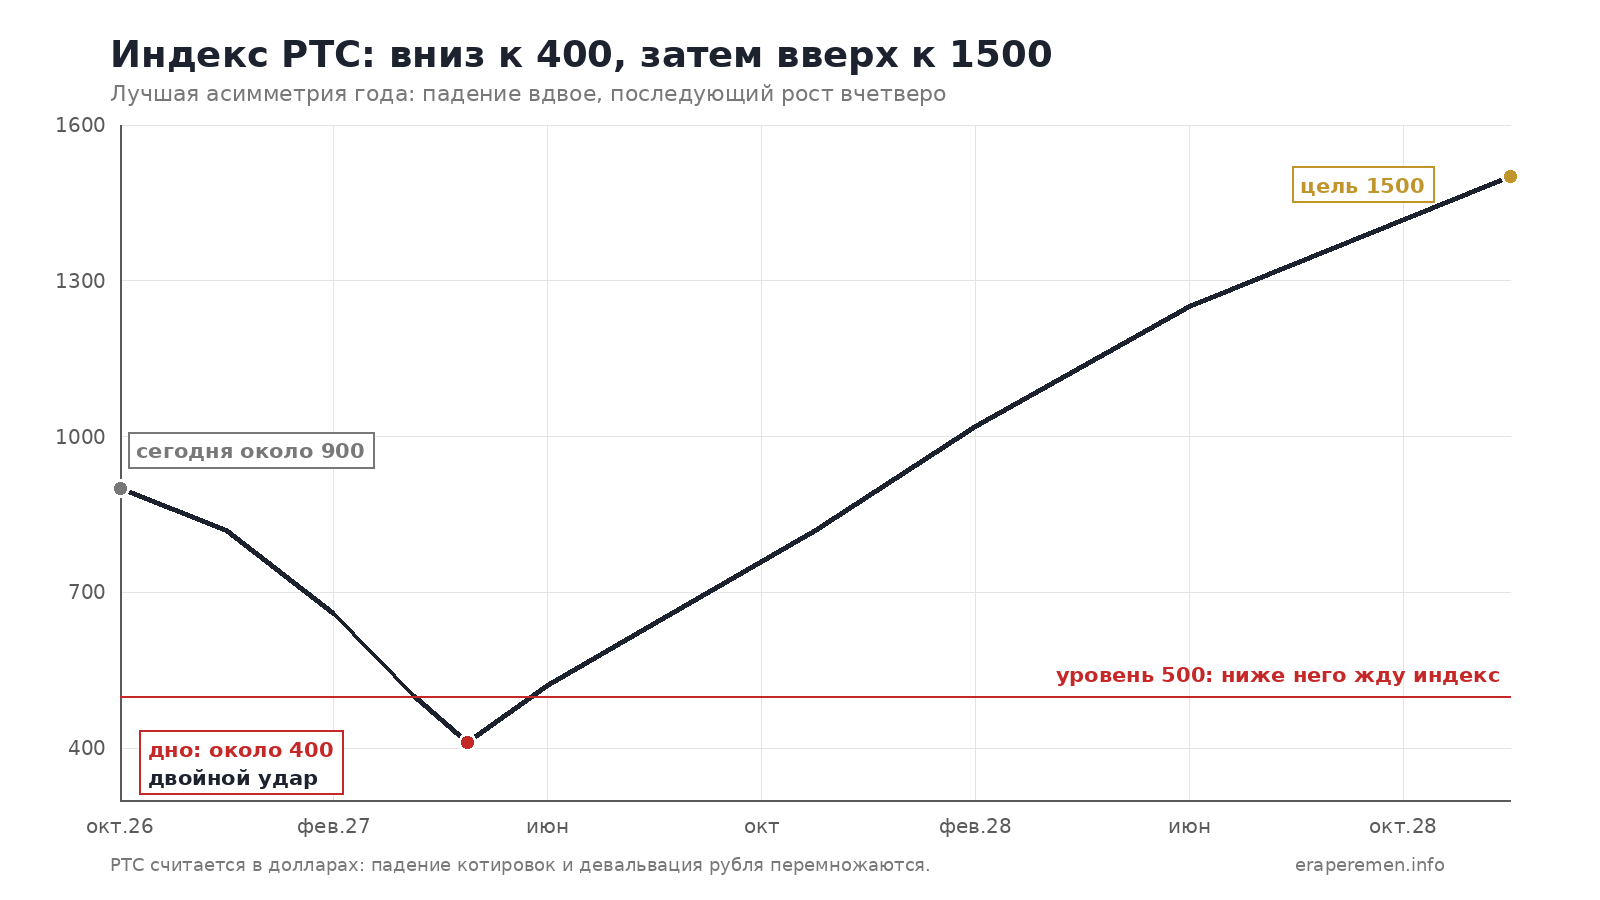
The RTS Index is currently around 900 points—it has just crossed the 900 mark for the first time since August, and the market is talking about an upward reversal.
I expect the RTS to fall below 500 points, with a target around 400 or lower. I don’t see any other options here. This represents a drop of more than half from current levels.
Why such a steep decline? The RTS is denominated in dollars, so it’s taking a double hit: a drop in ruble-denominated prices in tandem with global markets, plus the ruble’s devaluation to 140. These two factors are working in the same direction and amplifying each other’s effects. For holders of ruble-denominated assets, this is the main risk of the period—the index’s decline and the ruble’s weakening hit the same portfolio twice.
Add a third factor: oil in the 50–60 range. The Russian market consists mainly of exporters. Cheap oil combined with a strong dollar hits the budget, the index, and the currency all at once.
Then comes a rebound to 1,500 points— a nearly fourfold increase from the low. Here, the same factors come into play and begin to work in the index’s favor: oil rising to 240 boosts exporters’ ruble-denominated prices, the ruble’s strengthening to 100 adds to the dollar conversion, and the frozen ceasefire removes part of the military risk premium.
And this is the main asymmetry of the entire year: in the Russian market, the potential for a decline is twice as great as the potential for subsequent growth. I don’t see this ratio anywhere else. The only question is at what point in this movement you’ll find yourself—and whether you’ll have enough money to buy at the bottom rather than sell there.
Section 7. 2027 Calendar by Month
December 2026–February 2027. Winter escalation: strikes on Moscow and St. Petersburg, retaliatory strikes on Ukrainian cities. Markets are still holding on by inertia and faith in imminent negotiations. The dollar is strengthening, while oil is slipping lower as demand contracts. This is the last window of opportunity to exit positions at your own prices, rather than at panic prices.
January–March. U.S. troops enter Iran. Oil’s initial reaction is a sharp spike upward from low levels. Stock markets react with a decline: for them, a war in the Middle East is not a reason for growth, but a reason to reassess costs. The dollar index is heading toward a peak.
April. The peak of tension and the worst month of the year. Everything converges here at once: the S&P 500 bottoms out in the 5,000–5,500 range, gold bottoms out in the 2,800–3,000 range, the peak of the dollar against the ruble at 140, the peak of the dollar index at 120, the RTS bottom around 400, and a resolution on the Ukrainian front with Russia advancing to the administrative borders of Donbas.
May–July. Hostilities subside; the Donbas is secured. What I call a policy reversal begins: the printing press is turned on not because it was decided to do so, but because otherwise the debt market would collapse. Stocks test the bottom. Gold turns around first—it always does.
August–December. An inflationary surge. Oil prices head toward triple-digit levels and higher due to the Iranian supply shortage. The ruble begins to strengthen, and the RTS recovers from its decline. Formally, the year ends on a note of optimism: indices are rising, the exchange rate is strengthening, and the war has subsided. In reality, however, purchasing power is eroding—a trend that statistics will only reflect after a delay.
Section 8. What My Colleagues Are Saying—and Where We Differ
I don’t work in a vacuum, and I believe it’s important to show what others are thinking. Divergence from the consensus is the very essence of a forecast. If my figures match those of the major firms, I’m adding nothing but repetition.
In its October report,the IMF expects global economic growth of 3.4% in 2027, with inflation at 4.1%. Growth is projected at 2.3% for the U.S. and 1.2% for the eurozone. The Fund is projecting a calm, uneventful year. I disagree on principle: such a forecast does not account for military escalation, a crisis involving Iran, or debt stress. By its very nature, the IMF extrapolates rather than forecasts disruptions—this is both its value as a consensus indicator and its uselessness as a tool for preparing for shocks.
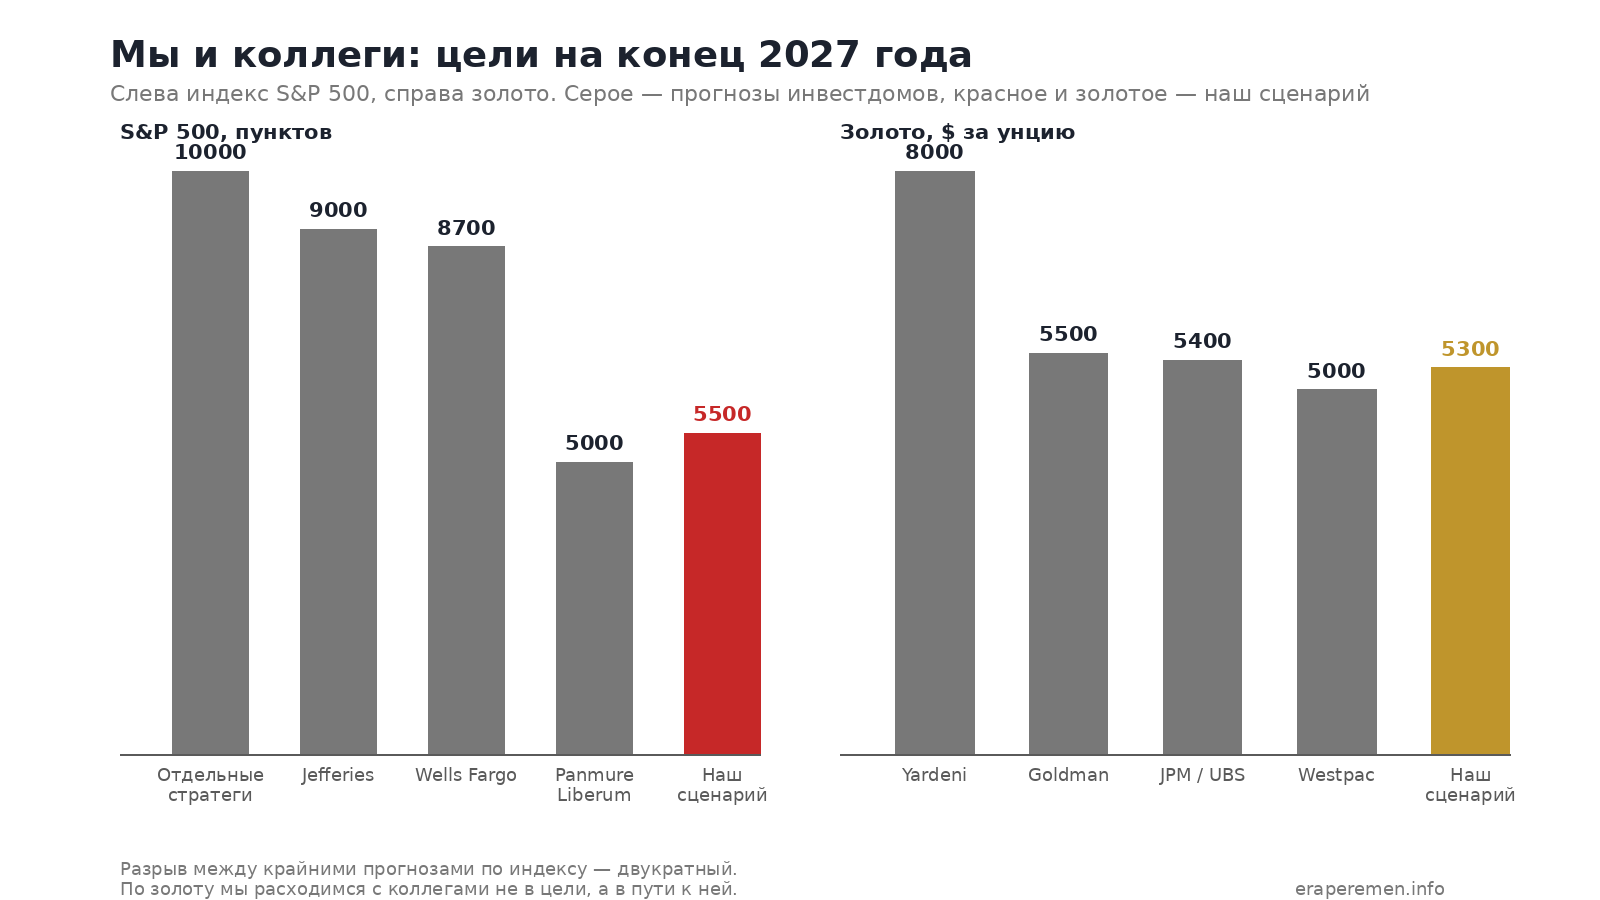
For the S&P 500 at the end of 2027, the range of estimates alone speaks louder than any single one. Jefferies: 9,000 points. Wells Fargo: 8,600–8,800. Some strategists are calling for 10,000. Panmure Liberum is at 5,000, arguing that the artificial intelligence boom will fizzle out within two years.
The gap between the extreme forecasts is twofold. This isn’t just normal uncertainty; it’s a sign that the market doesn’t understand what mode it’s in. My target is 5,000–5,500 by April, meaning I’m closest to Panmure Liberum, but I arrive at that figure via a different path: not through the bursting of a tech bubble, but through dollar scarcity and military escalation.
The consensus on gold is unanimous and high. J.P. Morgan and UBS predict $5,400 per ounce. Goldman Sachs forecasts $5,400–5,600. Metals Focus projects an average price of $5,330. Standard Chartered forecasts $5,100 by mid-year. Westpac is the most cautious, with a peak around $5,000, while Yardeni Research is the most aggressive, forecasting $8,000.
And this is where the divergence is most interesting of all. My colleagues are right about the direction but wrong about the trajectory. Almost all of them are forecasting a smooth rise from current levels. I expect a dip to 2,800–3,000 first—and only then a move toward those same final levels. For an investor, this difference is everything: the entire outcome of the year hinges on the choice between “buy now and hold” and “wait for the panic and buy then”—and the safety of one’s account rests on those shoulders as well.
Why the consensus consistently overlooks such reversals is a separate question, and the answer certainly isn’t a lack of intelligence. A major firm cannot publicly forecast a 35% drop in the index: it has client funds and a product line tied to that index. A forecast that calls for selling everything and sitting on cash is incompatible with a management company’s business model. This isn’t malicious intent; it’s a conflict of interest built into the system.
Section 9. What Would Change My Mind
A forecast without conditions for failure is mere guesswork. I’ll outline the conditions for each scenario; all of them are verifiable by facts, not interpretations.
- War. If the winter passes without attacks on Moscow and St. Petersburg, and substantive negotiations involving the U.S. and the EU begin by the end of February—the escalation scenario is incorrect. A second sign: Donbas does not come under full control by summer.
- Iran. If by April there are no U.S. troops in Iran and no obvious preparations for a deployment are visible—the trigger for oil prices has not been pulled, and the entire oil scenario needs to be reassessed from scratch.
- Oil. If Brent rises above 140 without first dipping below 70—my own baseline scenario from July is correct, not the current sequence of events.
- U.S. Market. If the S&P 500 does not dip below 6,500 even once by the end of April amid rising yields on long-term bonds—the bearish model does not hold.
- Gold. If there is no crash at all and the metal moves smoothly toward 5,000 without dipping even to 3,500—the consensus is correct, not me.
- Dollar Index. If the DXY turns downward without reaching 112—the dollar shortage phase is unfolding differently than I expect.
- Ruble. If the dollar does not exceed 110 rubles by the end of April, the devaluation part of the scenario is incorrect.
- RTS. If the index remains above 700 points throughout the spring—the depth of the decline has been overestimated.
The deadline for verifying the first part is the end of April 2027. That’s fifteen months, not some distant “someday” where it’s convenient to hide inconvenient forecasts. I will return to this text publicly and go through it point by point to see what came true and what didn’t—just as I did with the July forecast back in July.
Section 10. What to Do About This
This is not investment advice, but a description of my own reasoning. Make your own decisions.
The first half of the year is the time for cash. The main risk in 2027 isn’t that you’ll miss out on growth. The main risk is that you’ll enter April with leverage and no spare cash. In a cascade of forced sales, assets go for a song, and they’re bought by those who have the means to pay. Holding cash isn’t cowardice—it’s a strategic position.
A safe-haven asset isn’t one that’s labeled as such, but one that can’t be printed. In the first phase, everything falls, including gold. This isn’t a reason to abandon gold—it’s a reason not to buy it at its peak right before the crash.
The Russian market is for those who can withstand a 50% drop. The asymmetry here is the best I see on the horizon: a 55% decline to the bottom, followed by nearly a fourfold rise. But most people exit at the bottom, not enter. If you’re not confident you can weather a 55% drop without selling, don’t take this position at all—or take a significantly smaller position.
Geography is more important than portfolio structure. In a year of military conflict, the risk shifts from “the asset will become cheaper” to “the asset will be inaccessible.” An account in the wrong jurisdiction nullifies any sound diversification within it. People think about this last, but they’re the first to pay the price.
The time horizon is measured not in years, but in needs. If you’ll need the money in the spring of 2027, your actual time horizon extends only until April, and you must build your plan based on that date, not on pretty numbers at the end of the year.
2027 is not the end of the world. It is the year in which one cycle closes and the next opens. The problem is that there is no smooth transition between them. There is a cliff edge. And it falls in the spring.
This article reflects the author’s analytical opinion and does not constitute individual investment advice. All price projections after October 15, 2026, are the author’s scenario-based estimates, not guaranteed outcomes. Current values are as of October 15, 2026.



