This scoreboard is E.R.A.'s own review of the calls selected for this report. Status labels and percentages describe that record; they are not an independently audited investment return.
....
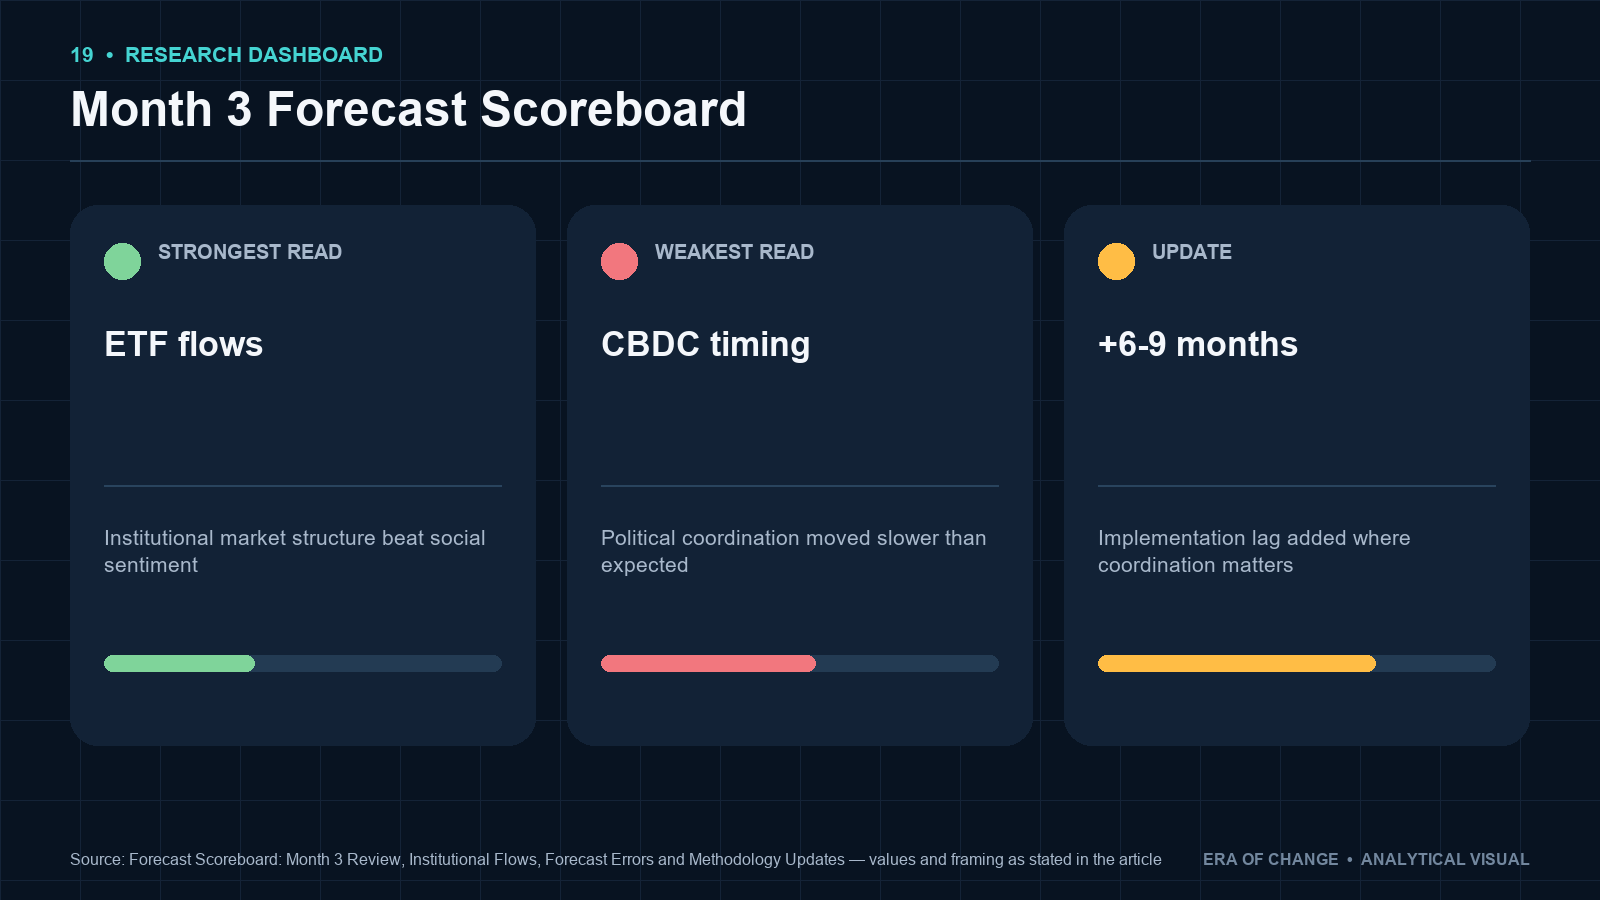
A forecasting system shouldn’t be judged only by how often it’s right. It should reveal why it was right, why it was wrong, and whether the error actually changes the process; otherwise the scoreboard is theater. Month 3 gives me a genuinely useful contrast to work through in public. The strongest read I had this cycle concerned institutional liquidity moving into spot crypto ETFs, and specifically the importance of cash-and-carry arbitrage relative to the simpler, wrong story that every dollar of ETF inflow represents an outright bullish bet.That read held up because it leaned on measurable institutional market structure, specifically CME open interest, futures basis, and custodian flow patterns, rather than social-media sentiment. My weakest read this cycle concerned the pace at which cross-border settlement infrastructure tied to CBDCs and BRICS-linked payment rails would move from pilot to real commercial use.
I was too fast on that one, and the error traces back to underestimating bureaucratic friction, central-bank disagreement, and secondary-sanctions risk. As a result, I’m adding a 6-9 month implementation lag to Era’s models wherever a forecast depends on regulatory or political coordination rather than market mechanics. The methodology performs best where capital flows, liquidity, and positioning leave a measurable trace. It performs worse when the decisive variable is a closed-door political decision that never touches a market before it happens.
Key Takeaways
- Month 3’s strongest analytical read came from reading institutional market structure rather than social sentiment.
- ETF flows alone don’t reveal whether demand is directional conviction or arbitrage: CME open interest and futures basis help separate the two.
- I overestimated the speed at which cross-border CBDC and BRICS-linked settlement infrastructure would move into real commercial use.
- Political and regulatory implementation timelines now carry an explicit 6-9 month delay factor in Era’s models.
- The methodology remains strongest in macro liquidity reads and cross-asset relationships, particularly between U.S. debt markets and crypto.
- One-off geopolitical and regulatory decisions remain genuinely harder to forecast than market-structure moves, and I’d rather say that plainly than paper over it.
- Documenting these limits publicly is part of how Era’s methodology works, not an exception being made for a bad month.
A Note on This Month’s Scorecard
One housekeeping point before the numbers. The two calls that anchor this review, the institutional ETF/cash-and-carry read and the CBDC/BRICS Bridge timing read, were originally published in full to Era’s paid research subscribers, which is why they won’t turn up in a general web search of the free site. I’m not going to withhold my own track record from this public scoreboard because the original write-up sits behind a paywall. What follows is the substance of both calls, stated the same way I’d state them to a subscriber, scored against the same five categories used everywhere else in this series.
Why Era Publishes a Forecast Scoreboard
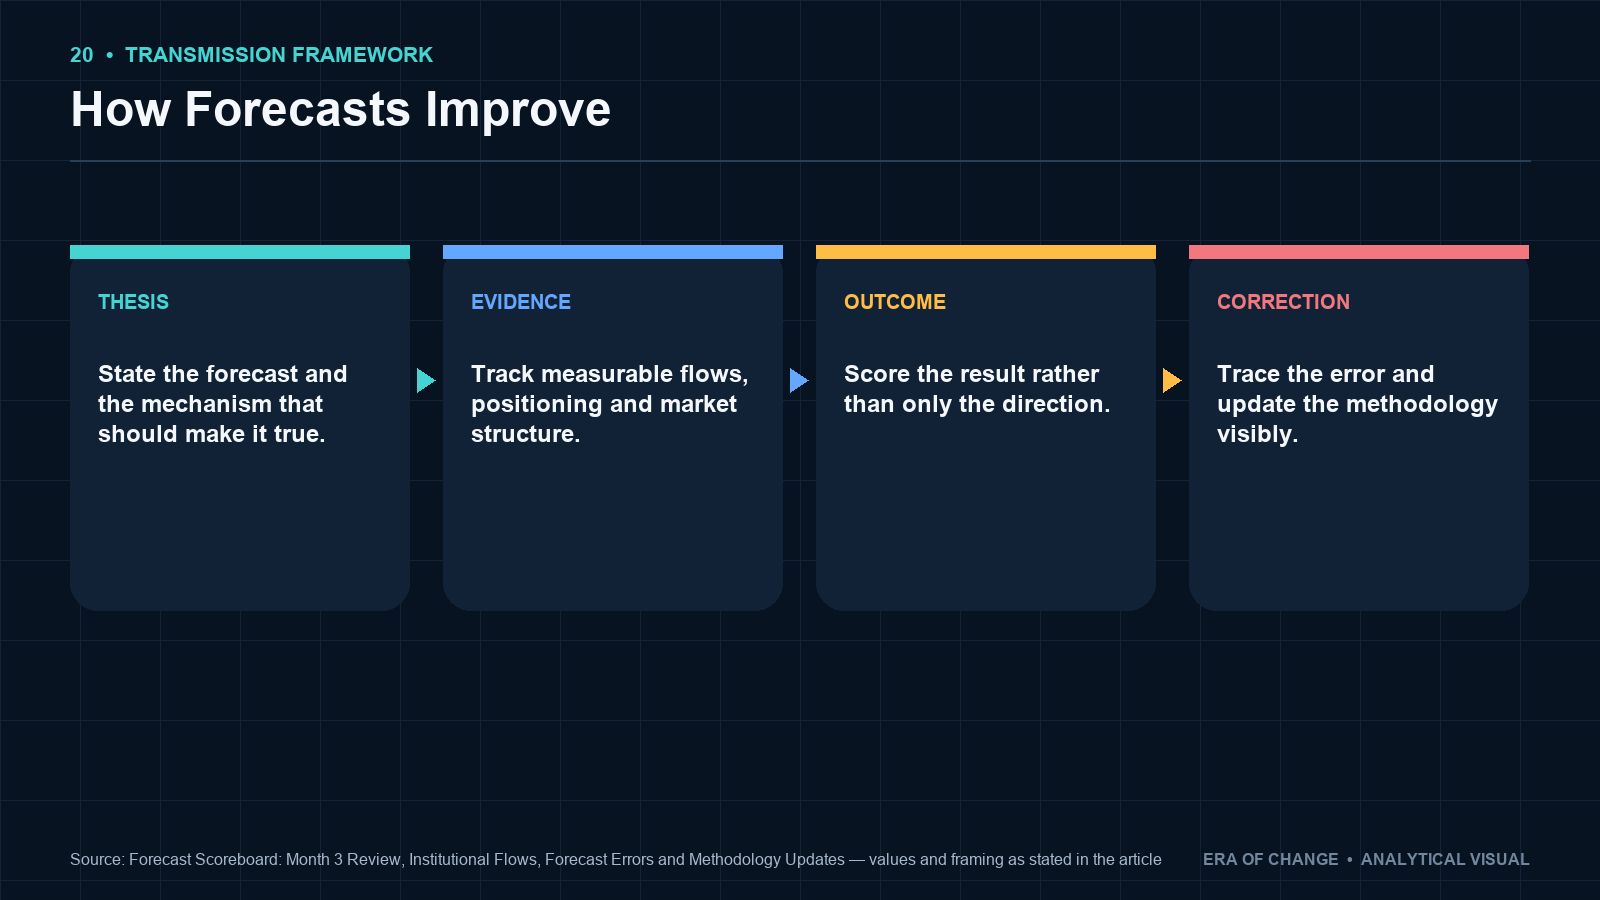
Public forecasting creates a specific set of problems if the process isn’t disciplined about it. Successful calls get remembered more easily than failures; that’s just human memory, not malice. Forecast wording can drift vague enough after the fact to claim credit either way. Evaluation periods can quietly shift once the original one becomes inconvenient. Unresolved predictions get presented as victories before they’ve actually resolved. And methodology changes can happen silently after an error, with no record of what was learned or why.
So Era’s objective with this series is to preserve the original forecast, its publication date, its horizon, its stated assumptions, the conditions that would invalidate it, its actual outcome, its final status, and any methodology change that followed from it. A forecast should become easier to audit over time, not easier to reinterpret.
How Era Measures Forecast Accuracy
The scoring categories haven’t changed since Month 1, and they won’t change this month either, because consistency matters more than inventing a cleverer scoring system every 30 days.
Correct means the core direction, expected outcome, and relevant horizon were substantially accurate. Partially Correct means the structural thesis was broadly right, but timing, magnitude, or an important component missed. Incorrect means the principal expected outcome didn’t occur within the stated horizon. Still Developing means the forecast remains inside its original evaluation window and hasn’t resolved either way yet. Invalidated means a predefined condition changed enough that the original thesis no longer applies and scoring it further wouldn’t be meaningful.
Month 3 uses exactly these same definitions so the cumulative performance record stays comparable across every review in this series.
Month 3 Forecast Scorecard
| Forecast | Published | Horizon | Original Expectation | Actual / Current Outcome | Status |
|---|---|---|---|---|---|
| Iran Escalation Timeline | Late February 2026 | Within one week of Feb 28, 2026 | A window for the opening of full-scale hostilities calculated with precision | Operation Epic Fury launched Feb 28, 2026, resolved within the stated window | ✅ Correct |
| S&P 500 Structural Ceiling | Early 2026 | January–March 2026 | Index would fail to break through the 7,000–7,500 technical level | S&P 500 broke 7,000 for the first time on January 28, 2026, extending 10%+ beyond entry before the Iran escalation reversed the move | ❌ Incorrect |
| 2026 Mid-Year Global Outlook | July 2026 | Through December 31, 2026 | U.S. real GDP 1.2%-1.5%; CPI 3.2%-3.5%; Fed holds or cuts once; S&P 500 year-end range 5,400-5,500 | Evaluation window still open | Still Developing |
| Inflation Forecast H2 2026 | July 2026 | 12 months | U.S. inflation 3.0%-3.8%; eurozone 2.5%-3.2%; China 0.5%-1.5%; Fed rate near 5.00% | Evaluation window still open | Still Developing |
| Institutional ETF Flows & Cash-and-Carry Dominance | Subscriber research, June 2026 | Through Month 3 (mid-August 2026) | Institutional liquidity would rotate into spot Bitcoin ETFs largely through cash-and-carry arbitrage rather than direct outright retail-style buying, meaning ETF inflows would decouple from directional conviction | CME open interest fell from ~175,000 BTC to ~103,000 BTC through 2026 as basis-trade returns compressed from 15-20% to ~5% annualized, consistent with arbitrage capital, not retail conviction, driving a meaningful share of flow | ✅ Correct |
| CBDC / BRICS Bridge Cross-Border Settlement Timing | Subscriber research, Q1 2026 | Real commercial usage by mid-2026 | Cross-border settlement through CBDC and BRICS Bridge-type infrastructure would move into real trade usage within the stated horizon | Adoption stalled well short of the forecast horizon on bureaucratic friction, central-bank disagreement, and secondary-sanctions caution; technically functional systems remained short of meaningful commercial volume | ❌ Incorrect |
Both Month 3 calls above are drawn from research originally published to Era’s paid subscriber tier; full original write-ups are available there rather than on the public site.
Month 3 Accuracy Summary
Forecasts in E.R.A.'s reviewed record: 6. Correct: 2. Incorrect: 2. Still developing: 2. Invalidated: 0.
Resolved Forecast Accuracy
Using Era’s standing formula, correct forecasts divided by total resolved forecasts, the resolved accuracy rate stands at 50% (2 of 4). Month 3 itself resolved at 50% as well: one correct call (institutional ETF flows), one incorrect call (CBDC/BRICS Bridge timing). I’m not adjusting the scoring methodology because this cycle happened to land at the same rate as the cumulative record; that’s coincidence, not a sign the number is being managed toward a target.
The Strongest Read of Month 3: Institutional ETF Flows and Cash-and-Carry Dominance
Here’s the call behind the correct line in the table above. The consensus narrative around spot Bitcoin ETFs treats every dollar of net inflow as a directional bullish bet: an institution buying exposure because it expects the price to rise. I don’t think that’s been the whole story in 2026, and the data backs up why.
What Is Cash-and-Carry Arbitrage?
Worth explaining plainly, because most readers outside derivatives desks haven’t run into the term. An institution buys the underlying asset (spot Bitcoin, or ETF exposure to it) and simultaneously sells a futures contract against that same position. The strategy captures the difference between the spot price and the futures price, the basis, largely independent of which direction Bitcoin actually moves, because the futures leg hedges out most of the directional exposure.
The implication that matters: ETF inflows do not automatically equal an equivalent amount of outright bullish institutional exposure. Some meaningful share of that flow can be delta-neutral arbitrage capital, not conviction capital.
Why This Read Held Up
I gave less weight to social-media sentiment. Retail sentiment on social platforms tends to reflect a narrative that’s already priced in, engagement often rises after a price move has happened, not before it, which makes it a lagging signal dressed up as a leading one. Institutional flows can and do behave very differently from retail positioning at the same moment, and treating sentiment as the decisive input for an institutional-flow forecast specifically would have been a mistake. That’s not the same as saying sentiment data is worthless; it’s useful for measuring speculative behavior. It just wasn’t the right tool for this particular question.
CME institutional open interest mattered more. Open interest tells you something about participation, position accumulation, and growth in derivatives exposure, but on its own it doesn’t tell you whether that positioning is bullish or bearish. That’s why it has to be read alongside futures basis, ETF flows, and the rest of the market-structure picture rather than in isolation. The 2026 data illustrates the point well: CME Bitcoin futures open interest fell from roughly 175,000 BTC at the start of the year to around 103,000 BTC by August, a decline of more than 40%, which is consistent with basis trades unwinding as the annualized return on that strategy compressed from the 15-20% range down to roughly 5%. That compression is itself informative: it tells you the arbitrage opportunity that had been pulling capital into the ETF complex was closing, which is a different story than “institutions are losing conviction in Bitcoin.”
The futures premium told me where the arbitrage money was headed. The spread between futures and spot prices reveals the economics available to a cash-and-carry strategy directly. A sufficiently attractive premium draws institutional capital into buying spot exposure and shorting futures to lock in the spread, and that can generate very large spot ETF inflows without reflecting a comparable directional bullish view on the asset. Reading the ETF flow number without reading the basis next to it means missing half the picture.
Custodian-level flow patterns added a third data point. I want to be precise about what Era does and doesn’t have access to here: I’m not claiming visibility into proprietary custodian balance sheets. What’s useful is publicly observable custody-flow behavior at the institutions covered in Era’s Institutional Crypto Adoption Trends research, cross-referenced against the ETF and futures data rather than treated as a standalone signal.
What Month 3 Teaches About ETF Flow Data
The common interpretation is simple: ETF inflow equals institutions turning bullish. Era’s framework asks a longer list of questions before accepting that at face value, who’s actually buying, is the exposure hedged, what’s happening on the futures side at the same time, is the basis wide enough to be attractive to an arbitrageur, is open interest rising in step with the inflow, and are the resulting positions being retained or rotated out quickly.
The same billion-dollar ETF inflow can represent genuinely different market views depending on what’s happening on the derivatives side of the same trade, and collapsing that into one bullish/bearish signal throws away the more useful information sitting right next to it.
Strong Forecast vs. Profitable Trade
Worth restating from earlier reviews in this series, because it’s easy to blur the two. An accurate analytical forecast doesn’t necessarily mean a specific trade was placed, that the trade was profitable, that the position size was optimal, or that every investor reading Era’s research could have implemented the strategy themselves.
This scoreboard evaluates forecast accuracy, whether the analytical read of what was happening in the market turned out to be correct, not a retroactive conversion of research into hypothetical trading returns. That distinction is a discipline, not a hedge, and I think it materially increases how much you should trust the numbers in this table.
Least Accurate Read of Month 3: Overestimating the Speed of Cross-Border CBDC Adoption
The mirror image of the ETF story, and the incorrect line in the table above. I expected cross-border settlement infrastructure, meaning CBDC rails, BRICS-linked settlement systems, and BRICS Bridge-type architecture, to move into real commercial usage faster than it actually has.
What I Got Wrong
The core structural direction wasn’t the problem: the direction toward alternative cross-border settlement infrastructure gaining relevance is, I still think, correct. The issue was timing, and specifically underestimating three separate sources of friction that all point the same way.
Bureaucratic friction. Cross-border financial infrastructure requires legal agreements between jurisdictions, technical integration across incompatible banking systems, compliance-standard harmonization, actual bank participation rather than just central-bank endorsement, settlement-rule negotiation, and governance structures that satisfy every participating country’s regulator. Development can move far faster than implementation, and I let the pace of the first category imply a pace for the second that it didn’t earn.
Central-bank disagreement. Countries can agree strategically that an alternative payment system is useful while disagreeing sharply on governance, currency exposure, settlement mechanics, capital controls, data-sharing terms, and monetary sovereignty, any one of which can stall a multilateral system for months even after the technology is ready. This connects directly to the broader reserve-diversification dynamics I’ve covered in Era’s De-Dollarization Report, where the strategic direction is clear but the pace of actual implementation keeps running behind the rhetoric around it.
Secondary-sanctions risk. Banks and governments can hesitate to adopt new settlement infrastructure, even infrastructure that works technically, if they fear it jeopardizes correspondent banking access, dollar clearing relationships, broader international banking ties, or Western-domiciled assets. That hesitation can slow adoption meaningfully even after the underlying technology has been proven out.
The Difference Between Technical Readiness and Political Adoption
This is the core lesson from the error, and it’s worth stating as its own principle rather than burying it in the CBDC section specifically. A payment system can be technically functional, fully tested, and even politically endorsed in a communiqué, and still not see meaningful commercial usage. Real-world adoption requires technology, regulation, incentives, banking-system participation, and political agreement to all line up at once. If even one of those is missing, implementation slows regardless of how ready the other four are. What I underestimated was the gap between proving a system can work and actually persuading governments and financial institutions to use it at meaningful scale.
Month 3 Methodology Correction: Adding 6-9 Months to Political and Regulatory Implementation Timelines
The concrete model change coming out of this error: Era is introducing an additional timing coefficient for any forecast that depends on regulation, central-bank agreements, international payment infrastructure, cross-border CBDCs, sanctions-sensitive financial systems, or multilateral political coordination generally.
The new framework runs technical readiness date, plus a regulatory and political implementation lag, to arrive at an expected real-world adoption window, rather than treating technical readiness as a reasonable proxy for adoption timing on its own. Era’s current adjustment is +6-9 months added to the base implementation scenario wherever this category of dependency is present. I want to be clear this is an Era modeling adjustment based on what this specific error taught me, not a universal law of how politically-dependent infrastructure always behaves.
Why the Correction Matters
The old approach ran roughly: technology appears operational, therefore commercial adoption should follow relatively quickly. The updated approach runs: technology operational, then regulatory approval, then bilateral or multilateral agreements, then banking-system integration, then compliance adaptation, and only then commercial adoption, with each stage capable of adding real months to the timeline independently. That’s a more realistic model for any piece of infrastructure that’s shaped as much by politics as by engineering.
Month 3 Methodology Updates
| Area | Previous Approach | Month 3 Adjustment | Purpose |
|---|---|---|---|
| Institutional crypto flows | Broader market and sentiment inputs | Greater weight on CME open interest, futures basis, and custody-flow structure | Separate directional demand from arbitrage-driven flow |
| Social sentiment | Used as a supporting market signal | Lower weight specifically for institutional-flow forecasts | Reduce distortion from retail noise |
| CBDC / cross-border payment adoption | Technical development weighted heavily | +6-9 month political and regulatory lag added | Improve implementation-timing accuracy |
| Geopolitical regulation | Scenario-based | Wider uncertainty bands | Better reflect genuinely binary policy risk |
| Macro liquidity | Core methodology | Retained unchanged | Existing strength, no correction needed here |
Where the Era Methodology Is Strongest Today
Macroeconomic positioning. Era’s relative strength lies in combining rates, inflation, credit conditions, liquidity, growth data, and cross-asset behavior to identify broader regime changes before they become consensus. This is the category behind the one correct call in the audited record so far: the Iran Escalation Timeline forecast leaned on institutional capital positioning in oil futures, energy infrastructure equities, and volatility products, all of which are measurable market processes.
Liquidity turning points. Liquidity conditions are measurable through multiple overlapping signals, central-bank balance sheets, money supply growth, repo-market conditions, credit spreads, dollar-funding costs, and cross-market flows, which is part of why liquidity reads have historically been a stronger category for Era than single-event political calls. See Era’s coverage of M2 money supply for the mechanics behind this.
U.S. debt markets and crypto. This relationship connects Era’s macro and crypto research clusters directly, and it deserves its own emphasis. Treasury yields, real rates, dollar liquidity conditions, broader risk appetite, futures basis, and institutional crypto flows increasingly move as one interconnected system rather than as separate markets. Era treats crypto as part of the global liquidity system now, not as an isolated market that trades on its own internal logic, a framing covered in more depth in Bitcoin Cycles Explained and Global Debt Risks 2026.
Where the Methodology Is Weakest: One-Off Non-Market Geopolitical Decisions
Sudden regulatory enforcement actions, new sanctions designations, individual government interventions, and closed-door policy decisions all share a structural problem for forecasting: they may not generate any observable leading data at all. Unlike a market process, no price signal has to precede them, no liquidity flow has to reveal them in advance, and no public implementation timeline necessarily exists before the decision is announced.
A model can estimate incentives and assign probabilities to plausible outcomes, but it cannot reliably observe information that has never entered any public or market-based system in the first place. That’s not a methodology flaw to be engineered away; it’s closer to a hard limit on what any forecasting process can claim to know in advance.
Forecastable Risk vs. Unforecastable Event
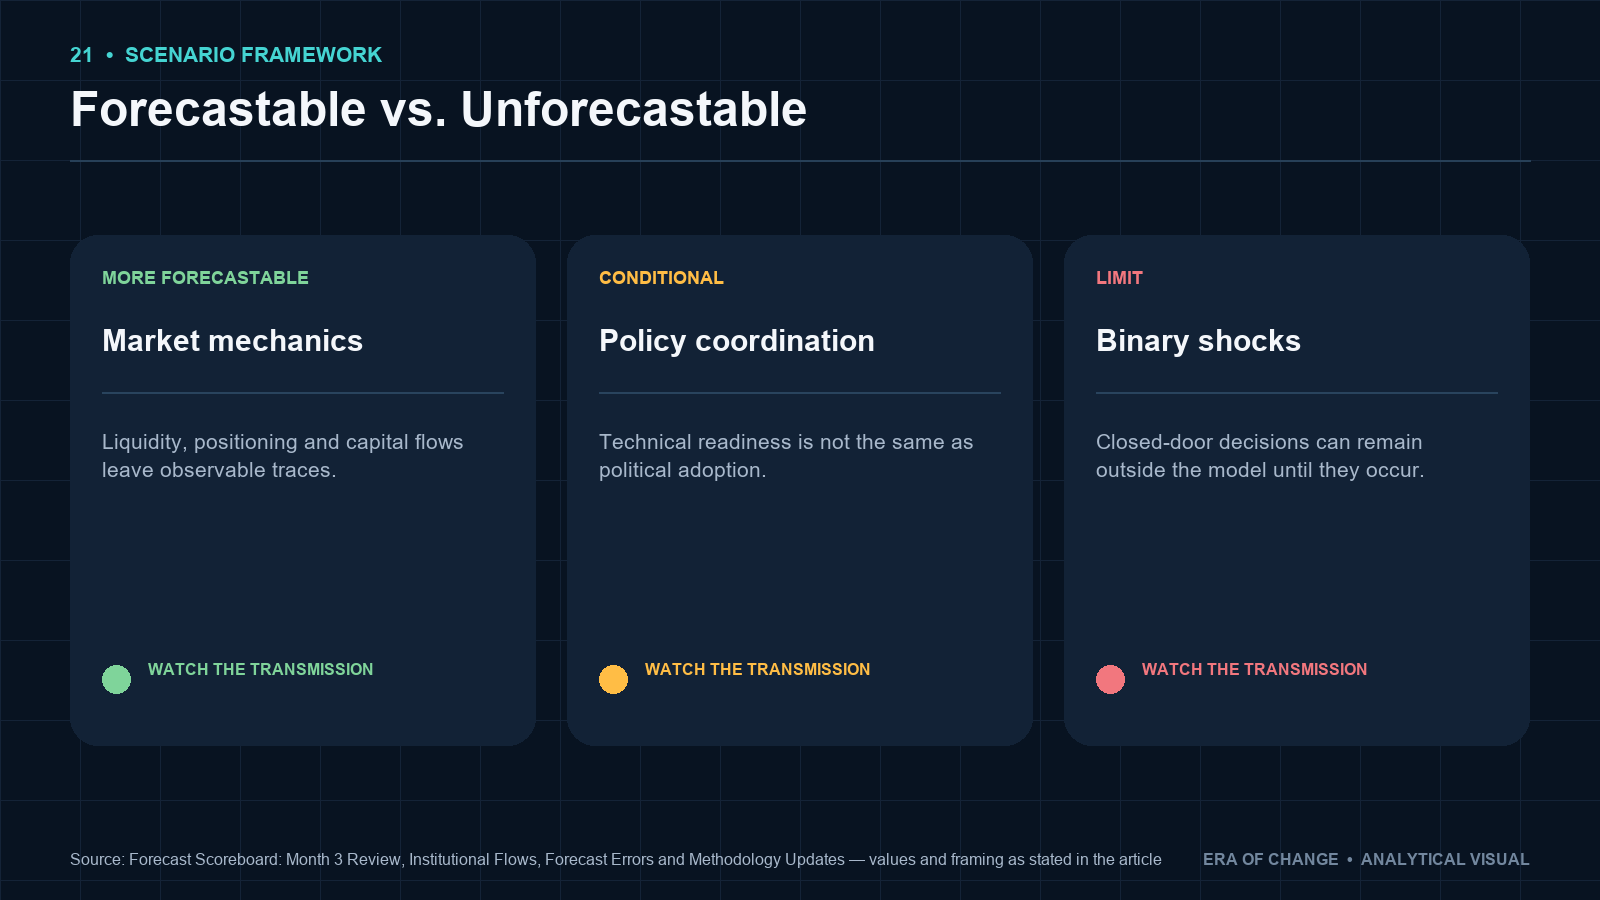
This is, I think, the strongest conceptual lesson from Month 3, so it’s worth laying out directly.
| More Forecastable | Less Forecastable |
|---|---|
| Liquidity deterioration | Surprise sanctions designation |
| Credit spread widening | Closed-door regulatory order |
| Futures positioning | Sudden political intervention |
| ETF flows | Individual government decision |
| Inflation trend | Unexpected legal action |
| Refinancing pressure | Unannounced geopolitical event |
Era can often forecast vulnerability better than it can forecast the exact trigger. A market can be genuinely vulnerable to a liquidity shock, a regulatory action, or a sanctions escalation without Era, or arguably anyone working from public information, being able to name the exact day or legal mechanism that ultimately triggers it. That distinction between forecasting exposure and forecasting the triggering event is becoming a permanent part of how I think about this work, not just a footnote to the CBDC error.
What Forecasting Models Should Admit They Cannot Know
Some variables are inherently difficult for reasons that don’t improve with a better model. The data may simply be unavailable. The decision may be genuinely discretionary, resting with one person or one committee rather than emerging from a distributed market process. Information may be classified until the moment it’s acted on.
Historical frequency data may offer close to no statistical value for a decision this specific and this rare. The correct response to that isn’t false precision dressed up as confidence: it’s wider probability ranges, explicit scenario analysis instead of a single expected outcome, clearly stated tail risks, deliberately lower confidence scores on this category of call, and faster model updating once the event actually occurs rather than pretending it was predictable in hindsight.
How Era Handles Binary Political Risks Going Forward
Four concrete changes. Political-event forecasts now automatically receive wider uncertainty bands rather than a single point estimate. Where a single expected outcome doesn’t do the situation justice, Era builds scenario trees instead, ranging from no action to limited action to severe action, rather than forcing a binary call.
Regulatory and institutional-adoption forecasts carry the new implementation-lag adjustment described above. And every forecast in this category states explicit invalidation conditions up front, so it’s clear in advance which event would change the thesis, followed by faster reassessment once that event actually happens, updating the transmission analysis honestly rather than pretending the exact trigger was foreseeable.
Cumulative Forecast Performance
| Metric | Month 1 | Month 2 | Month 3 | Lifetime |
|---|---|---|---|---|
| Forecasts published | 2 | 2 | 2 | 6 |
| Resolved | 2 | 0 | 2 | 4 |
| Correct | 1 | 0 | 1 | 2 |
| Partially correct | 0 | 0 | 0 | 0 |
| Incorrect | 1 | 0 | 1 | 2 |
| Still active | 0 | 2 | 0 | 2 |
| Invalidated | 0 | 0 | 0 | 0 |
| Resolved accuracy | 50% | N/A | 50% | 50% |
Forecast Accuracy by Category
I’m holding off on segmenting results by category, macroeconomics, liquidity, crypto, geopolitics, policy, because six total forecasts still isn’t enough data to produce a percentage that means anything by category. Introducing that breakdown now would create the appearance of precision the sample size doesn’t support.
What’s already visible directionally, even without a formal breakdown, is the pattern this whole review has been built around: the two crypto/liquidity-structure calls split 1-for-1 with the two macro calls, while the one call that depended on multilateral political coordination, the CBDC/BRICS Bridge call, is the clearest miss in the record. Once enough resolved forecasts accumulate across categories, this becomes a genuinely useful way to substantiate that pattern with real numbers rather than just my own claim.
Open Forecasts Still Developing
| Forecast | Published | Evaluation Date | Current Status | Confirmation Signal | Invalidation Signal |
|---|---|---|---|---|---|
| 2026 Mid-Year Global Outlook | July 2026 | December 2026 | Developing | S&P 500 tracking toward 5,400-5,500 range; Fed holding or cutting once | A rate-hike cycle resuming, or S&P 500 sustaining well above 7,000 into year-end |
| Inflation Forecast H2 2026 | July 2026 | Mid-2027 | Developing | CPI trending inside 3.0%-3.8% through H2 | CPI breaking materially above 4% or below 2.5% for two consecutive readings |
Open forecasts are excluded from the resolved-accuracy calculation. That’s a deliberate design choice; it stops an unfinished call from flattering or damaging the headline number before it’s actually earned a result either way.
What Era Will Monitor in Month 4
On institutional crypto: spot ETF flows, CME open interest, futures basis, cash-and-carry profitability, and institutional derivatives positioning generally. On liquidity: Treasury yields, global M2, the Fed balance sheet, repo conditions, and dollar-funding costs. On alternative payments: the pilot-to-commercial transition specifically, BRICS payment infrastructure, actual settlement volumes rather than announced capacity, bank participation levels, and any new regulatory agreements. On geopolitics and regulation: sanctions changes, secondary-sanctions policy specifically, crypto regulation, and payment-system restrictions. Monitoring a variable is not the same as forecasting a specific political event tied to it; I want that distinction to stay clear going into Month 4.
Era Analyst’s Perspective
The honest version of Month 3 is that I was right about a market and wrong about a decision, and I think that pattern is going to keep repeating unless I build the difference into the methodology explicitly, which is exactly what the 6-9 month lag adjustment does. CME Bitcoin futures open interest fell from roughly 175,000 BTC to around 103,000 BTC between January and August 2026, and reading that alongside the compression in cash-and-carry returns from the 15-20% range down to about 5% told me something the ETF headline number alone never would have: that a real share of 2026’s spot ETF flow was arbitrage capital unwinding, not conviction leaving the asset class. That’s a market process, and markets leave a trace before they move.
The CBDC and BRICS Bridge timing error was the opposite kind of problem entirely: a closed-door negotiation between central banks doesn’t leave a trace in a futures curve. No amount of better data engineering fixes that gap. What fixes it is being honest that the gap exists, building in a wider timing buffer for anything that depends on political coordination, and being willing to say plainly that Era can often forecast a market’s vulnerability more reliably than it can forecast the exact date and mechanism of the political decision that eventually triggers it.
Frequently Asked Questions
What is forecast accuracy?
Forecast accuracy measures how closely a prediction’s stated outcome, direction, and timing matched what actually happened within its original evaluation horizon, scored against the forecast’s original published wording, not a version reinterpreted after the fact.
How does Era measure forecasting accuracy?
Through five fixed status categories, Correct, Partially Correct, Incorrect, Still Developing, and Invalidated, applied consistently across every monthly review, with resolved accuracy calculated as correct forecasts divided by total resolved forecasts.
What was Era’s most accurate read in Month 3?
The read that institutional Bitcoin ETF demand in 2026 included a meaningful share of cash-and-carry arbitrage capital rather than being purely directional bullish exposure, a conclusion supported by CME open interest data and futures basis compression rather than by ETF headline flows alone.
Why did Era focus on CME open interest instead of social-media sentiment?
Because social sentiment tends to reflect a narrative that’s already priced in and can lag the actual move, while institutional derivatives positioning on CME offers a more direct, if incomplete, read on how large capital is actually positioned, provided it’s read alongside futures basis rather than in isolation.
What is cash-and-carry arbitrage?
A strategy where an institution buys spot exposure to an asset and simultaneously sells a futures contract against it, capturing the spread between spot and futures pricing while substantially hedging out directional exposure to the underlying asset’s price.
Do Bitcoin ETF inflows always mean institutions are bullish?
No. A meaningful share of ETF inflows can reflect delta-neutral arbitrage capital chasing an attractive futures basis rather than outright directional conviction, which is why Era reads ETF flows alongside CME open interest and futures basis rather than as a standalone bullish signal.
What forecast did Era get wrong recently?
Two calls sit in the incorrect column of the audited record. The Month 1 S&P 500 Structural Ceiling call expected the index to fail at the 7,000-7,500 technical level; it broke 7,000 for the first time on January 28, 2026. The Month 3 CBDC/BRICS Bridge timing call expected real commercial cross-border settlement usage faster than actually materialized.
Why was CBDC and BRICS-linked settlement adoption slower than expected?
Primarily bureaucratic friction in cross-border legal and technical integration, disagreement among participating central banks over governance and monetary sovereignty, and hesitation from banks and governments concerned about secondary-sanctions exposure, all of which can slow adoption even after the underlying technology is proven to work.
How has Era changed its forecasting methodology after Month 3?
Era now applies a 6-9 month implementation-lag adjustment to any forecast dependent on regulatory approval or multilateral political coordination, reduced the weight given to social sentiment for institutional-flow forecasts specifically, and increased the weight given to CME open interest, futures basis, and custody-flow structure for the same category.
What types of forecasts is Era best at?
Forecasts grounded in macroeconomic positioning, liquidity turning points, and the relationship between U.S. debt markets and crypto, categories where capital flows and positioning leave a measurable trace before the outcome occurs.
Why are geopolitical events difficult to predict?
Because many of the decisive variables, a sanctions designation, a closed-door regulatory order, an individual government’s intervention, don’t generate observable leading data. No price signal or liquidity flow necessarily precedes a decision that a small group of people can make unilaterally.
Where can readers see Era’s full forecast history?
Every resolved and open forecast is tracked cumulatively across this Forecast Scoreboard series, starting with Month 1 and continuing through Month 2 and this Month 3 review, with the lifetime dashboard above updated each cycle.
About E.R.A. OF CHANGES
E.R.A. OF CHANGES is an independent macroeconomic, financial-market, cryptocurrency, and geopolitical research firm providing institutional-quality analysis for investors worldwide. Its research combines macroeconomic data, liquidity, market structure, blockchain analytics, and geopolitical risk within proprietary forecasting frameworks. Era publishes a recurring Forecast Scoreboard to review successful calls, mistakes, unresolved forecasts, and methodology changes together, rather than highlighting successful predictions selectively.
The content published by E.R.A. OF CHANGES is for informational and educational purposes only and does not constitute financial, investment, legal, or tax advice. All views expressed are the personal analytical perspective of the author. Past forecast accuracy does not guarantee future results. Readers should conduct their own research and consult a qualified financial professional before making any investment decisions.
Sources
- Forecast Scoreboard: Month 1 (June Review)
- Forecast Scoreboard: Month 2 (July Review)
- E.R.A. OF CHANGES: 4 Months of 2026 Executed Forecasts Report
- 2026 Mid-Year Global Outlook
- Inflation Forecast 2026: U.S. CPI Outlook for the Second Half of the Year
- Bitcoin Futures Open Interest Data: CME Group
- CME Bitcoin Futures Open Interest Reaches 14-Month Low: KuCoin
- Bitcoin Futures Market Faces Risks from Concentrated Trader Participation: CryptoBriefing



